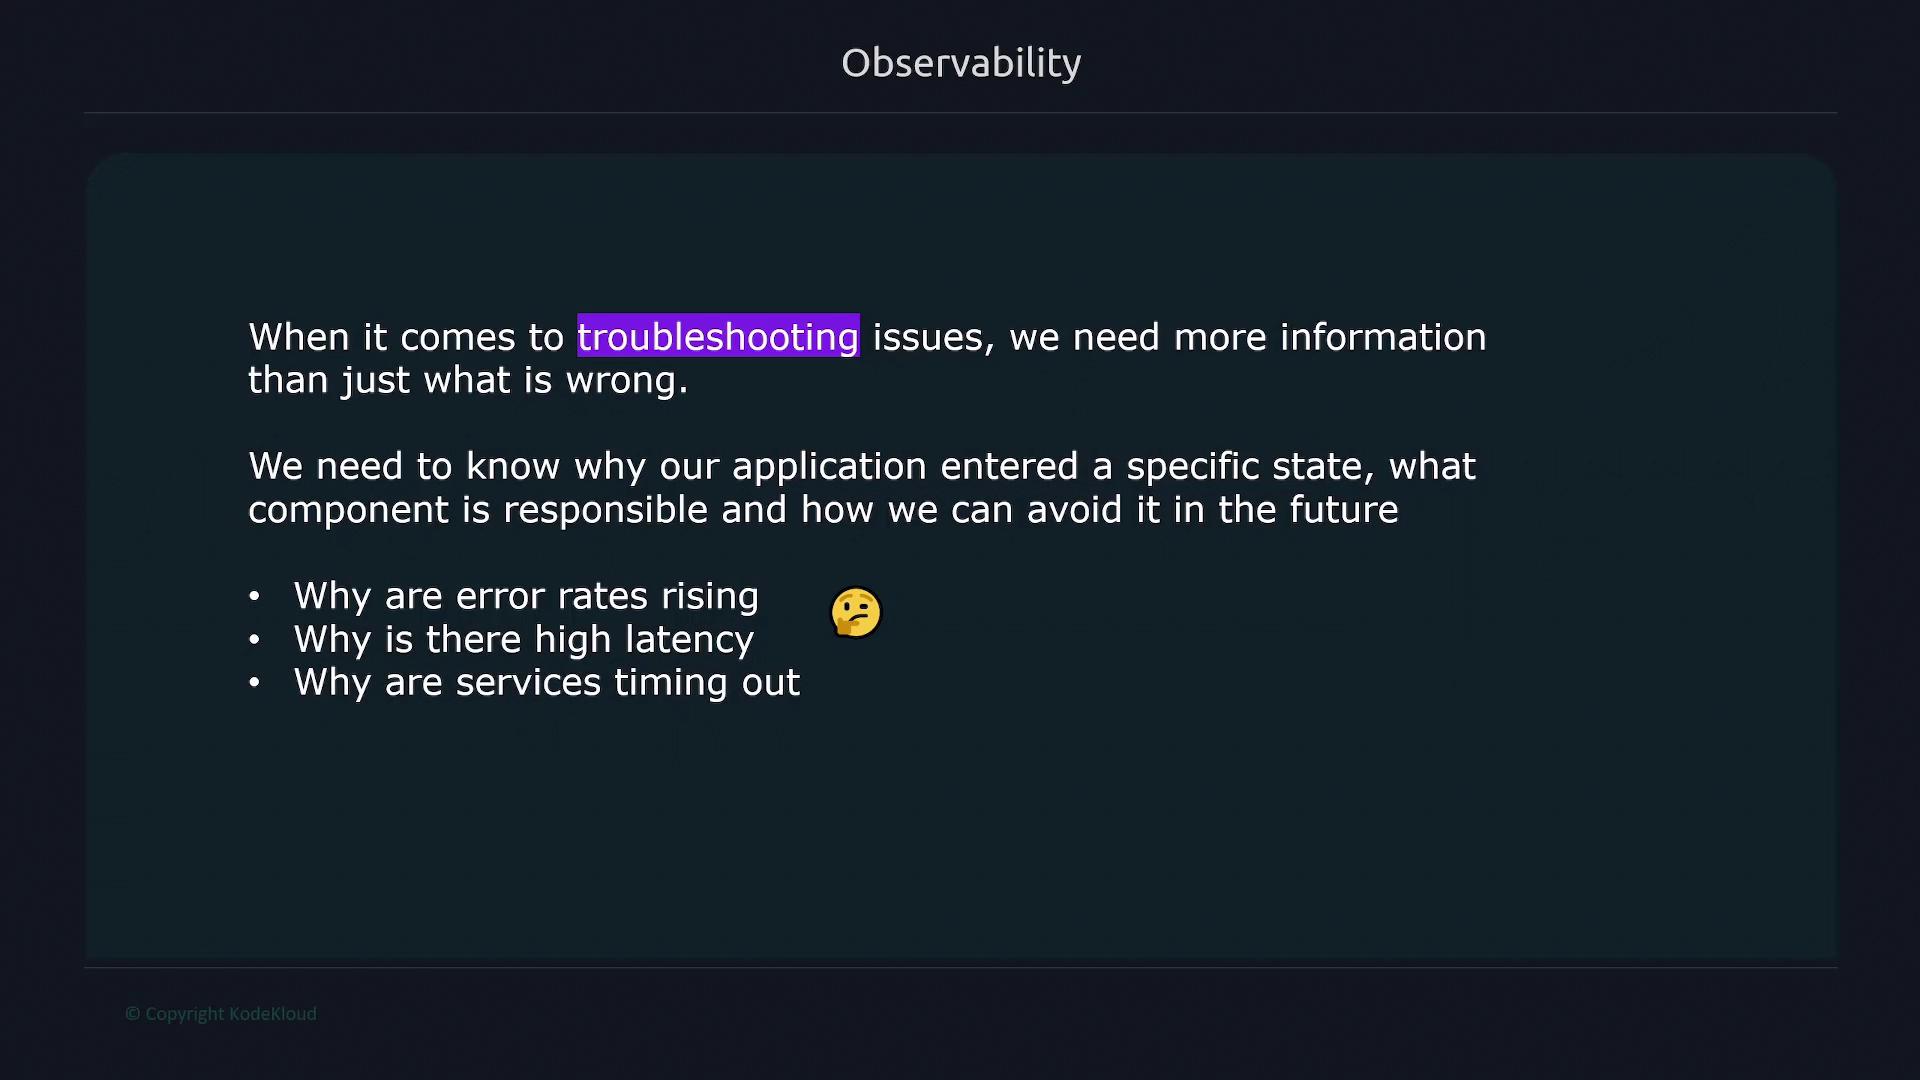
When encountering issues like increased error rates, high latency, or service timeouts, observing just the symptom isn’t enough. Effective observability helps you diagnose the underlying causes, enabling you to address both the symptoms and the root issues.
Logging
Logs are records of events that occur within the system, capturing details such as timestamps and event messages. They are generated by operating systems, applications, databases, and more. Although logs offer a wealth of information, they can be verbose and interleaved with data from concurrent processes across various systems, making it challenging to isolate specific issues. Below is an example of typical log entries:Tracing
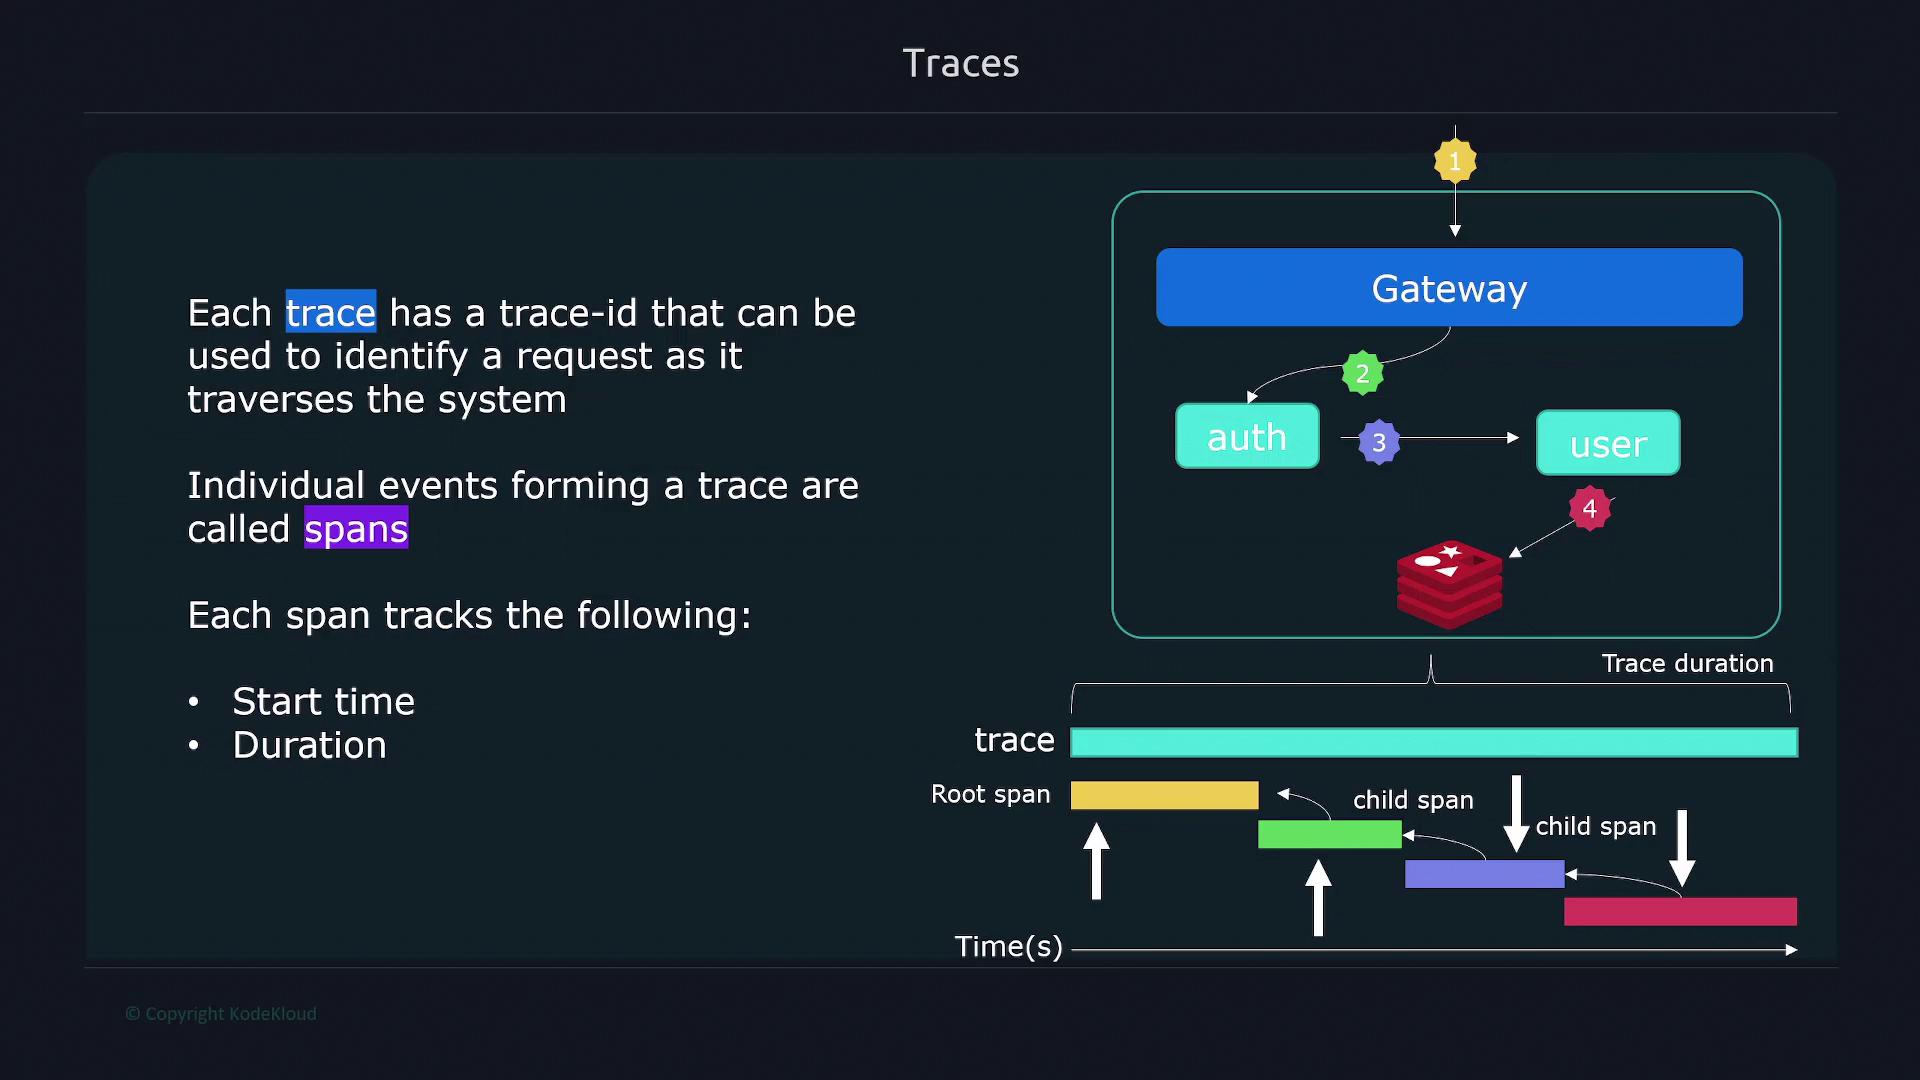
Tracing involves following the entire journey of an individual request as it traverses various systems and services. This process provides a detailed, step-by-step insight into how different components of your application interact. Each trace is identified by a unique trace ID, and individual trace events, known as spans, capture critical details such as start time, duration, and context (including parent-child relationships). These spans may be generated by components like gateways, authentication services, user management, and databases.
Metrics
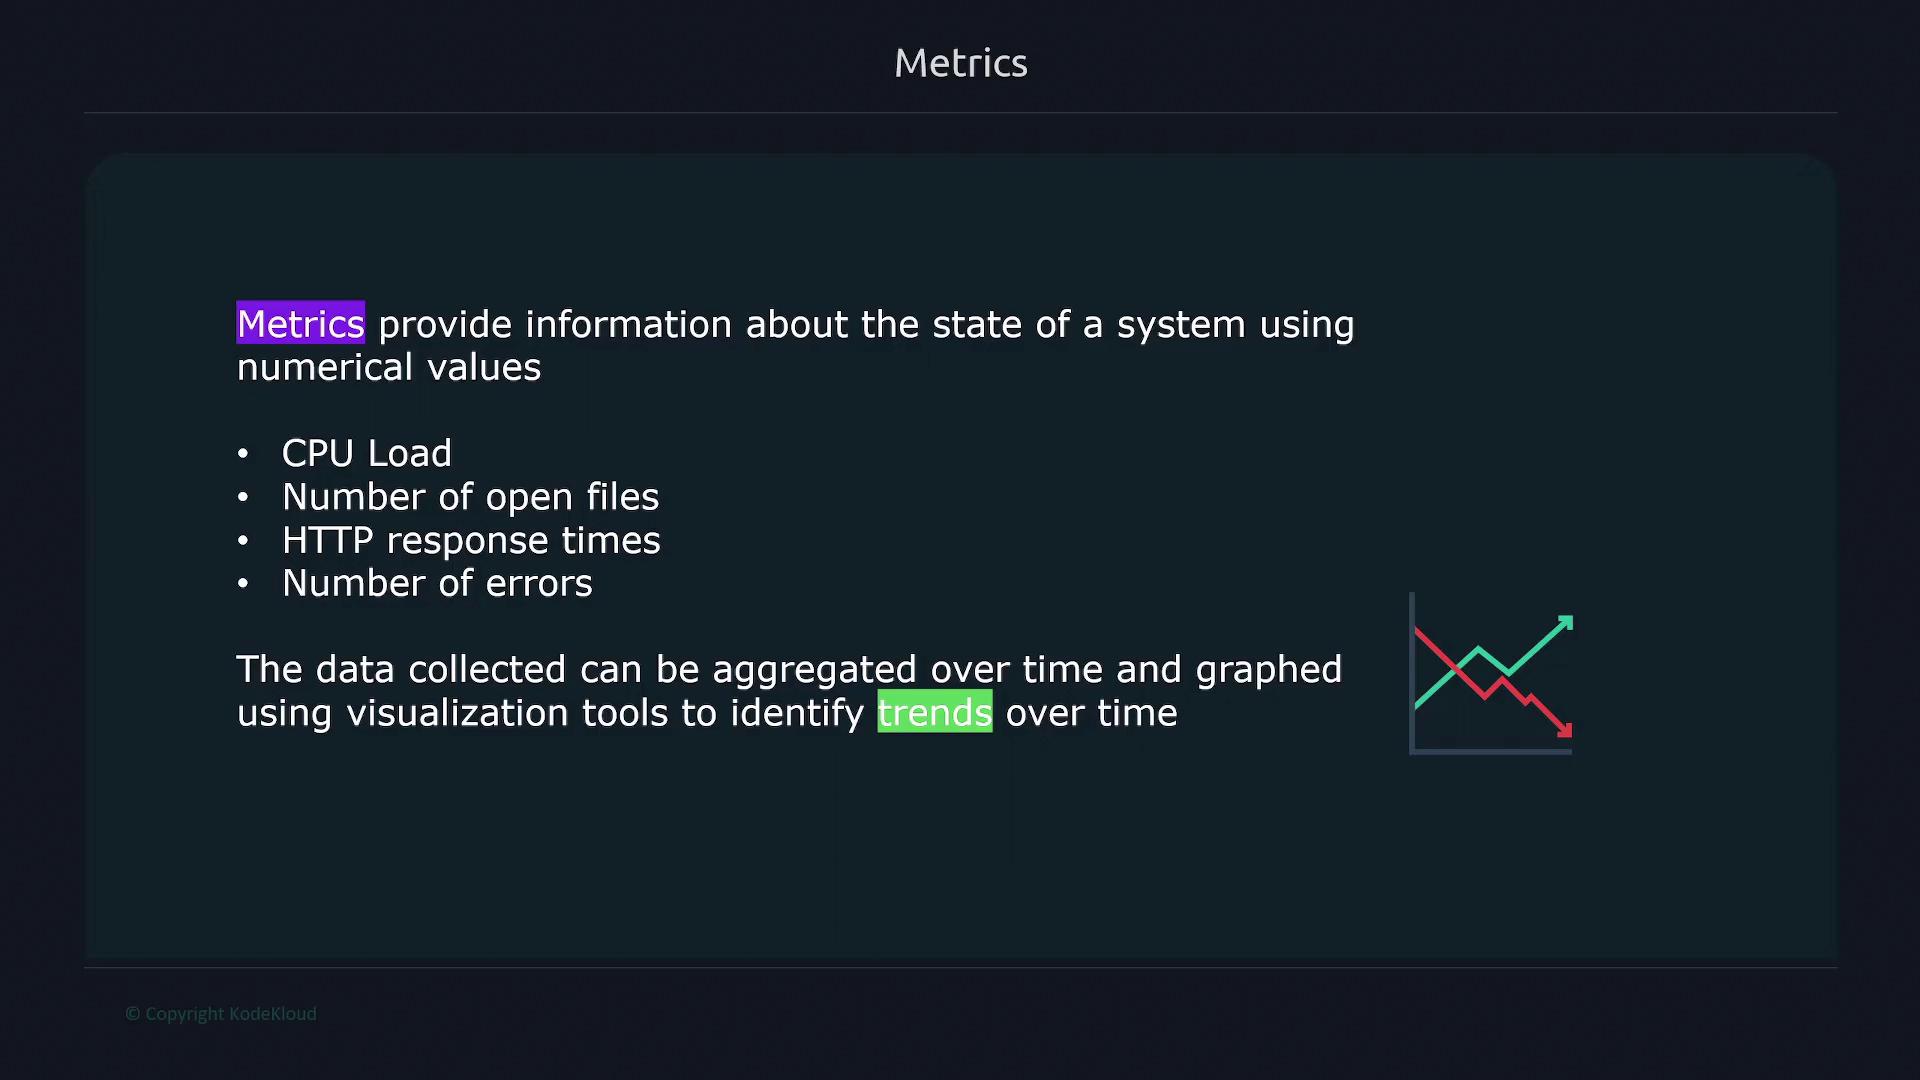
Metrics provide numerical data that reflect a system’s state. Unlike logs—which are text-based—metrics track quantitative measures such as CPU load, number of open files, HTTP response times, and error counts. This data can be aggregated and visualized over time to identify trends, anomalies, and performance issues. Metrics typically include four key attributes:| Attribute | Description |
|---|---|
| Metric Name | A descriptive label explaining what the metric represents. |
| Value | The current or most recent measure of the metric. |
| Timestamp | The exact time at which the metric was recorded. |
| Dimensions | Additional tags or context that provide further insights into the metric’s meaning. |
Prometheus and Its Role in Observability
This section highlights Prometheus, a specialized monitoring solution designed for collecting and aggregating metrics data—the metrics pillar of observability. It is important to note that Prometheus does not handle logs or traces; you will need separate applications to capture those components of observability.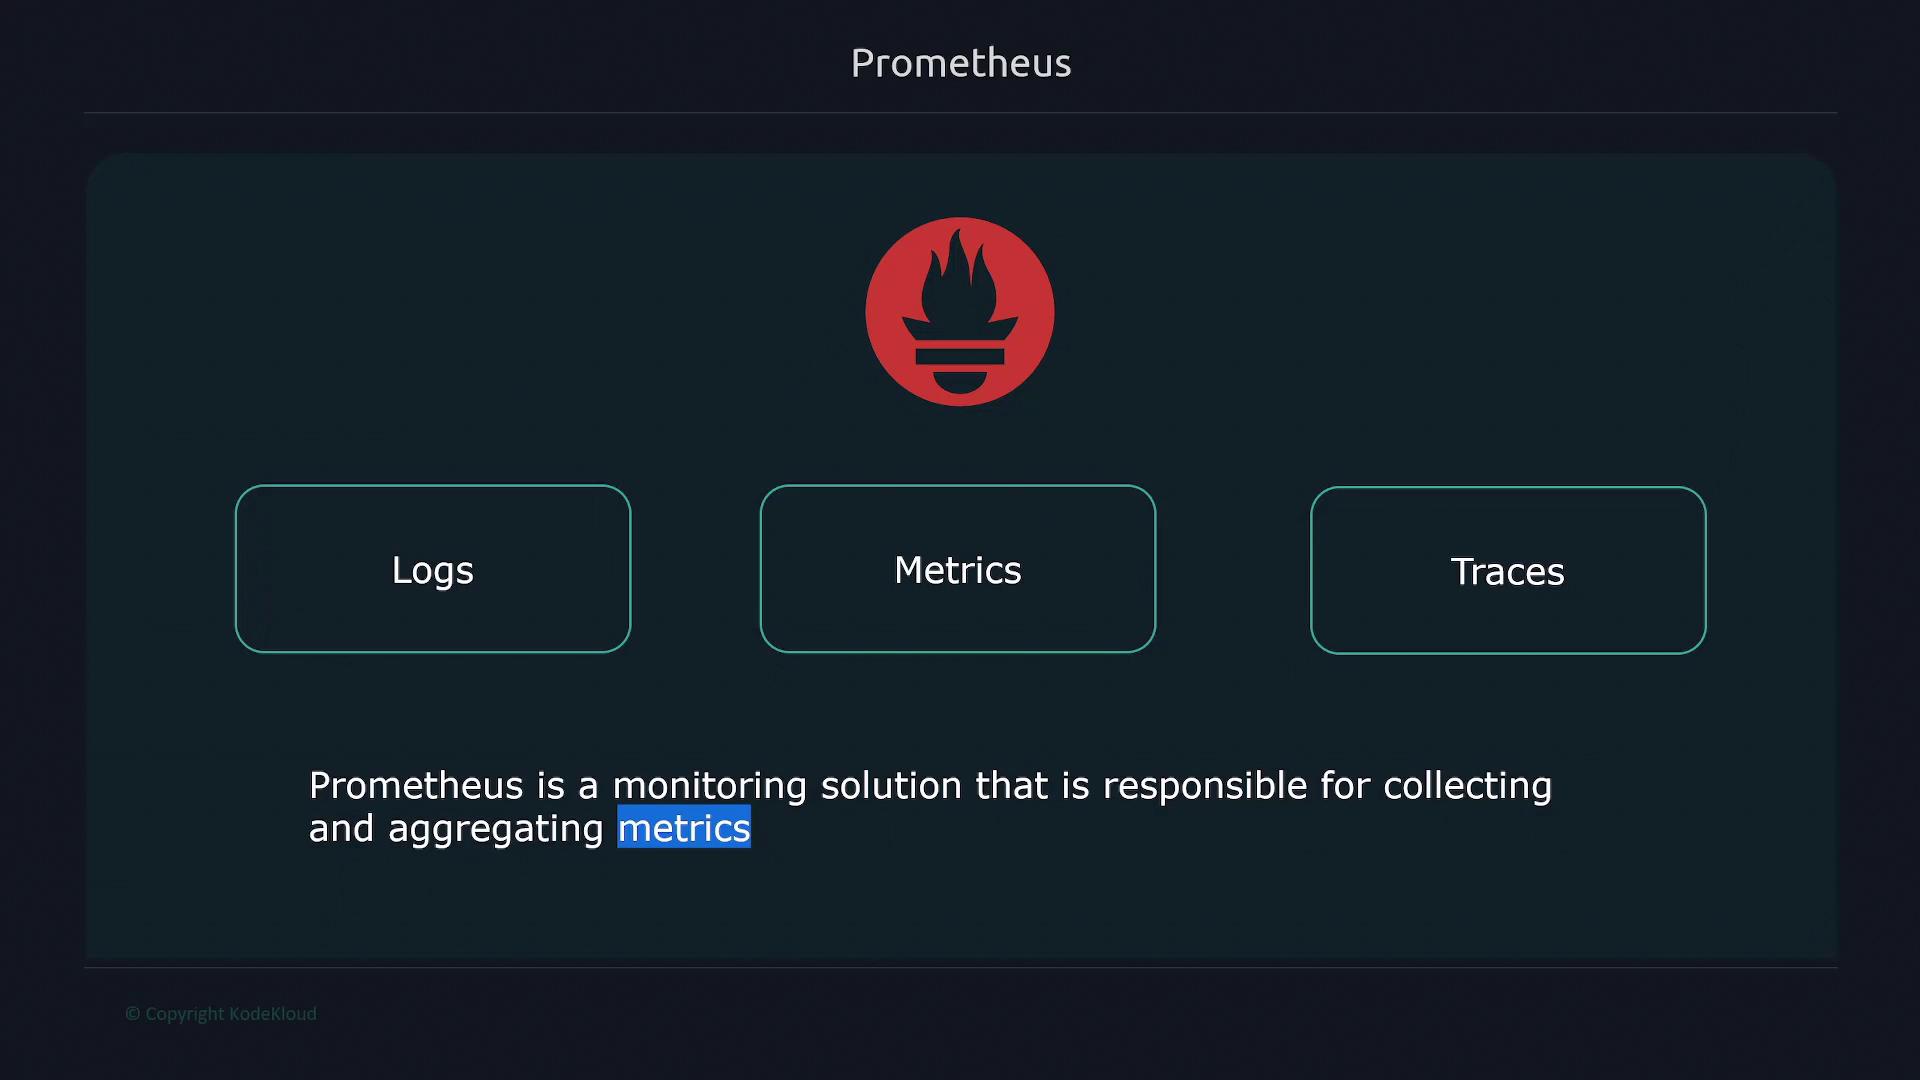
Implementing comprehensive observability practices—including logging, tracing, and metrics—is essential for managing modern, distributed systems effectively. Explore additional resources like Prometheus Documentation and Kubernetes Basics for further insights.