Prometheus Certified Associate (PCA)

PromQL

Vector Matching

In this article, we explore vector matching in PromQL, focusing on arithmetic operations between two instant vectors. Previously, most examples demonstrated operations between an instant vector and a scalar. Here, we dive deeper into matching vectors based on shared and differing labels.

Calculating Filesystem Free Space

Consider two metrics:

  • node_filesystem_avail_bytes
  • node_filesystem_size_bytes

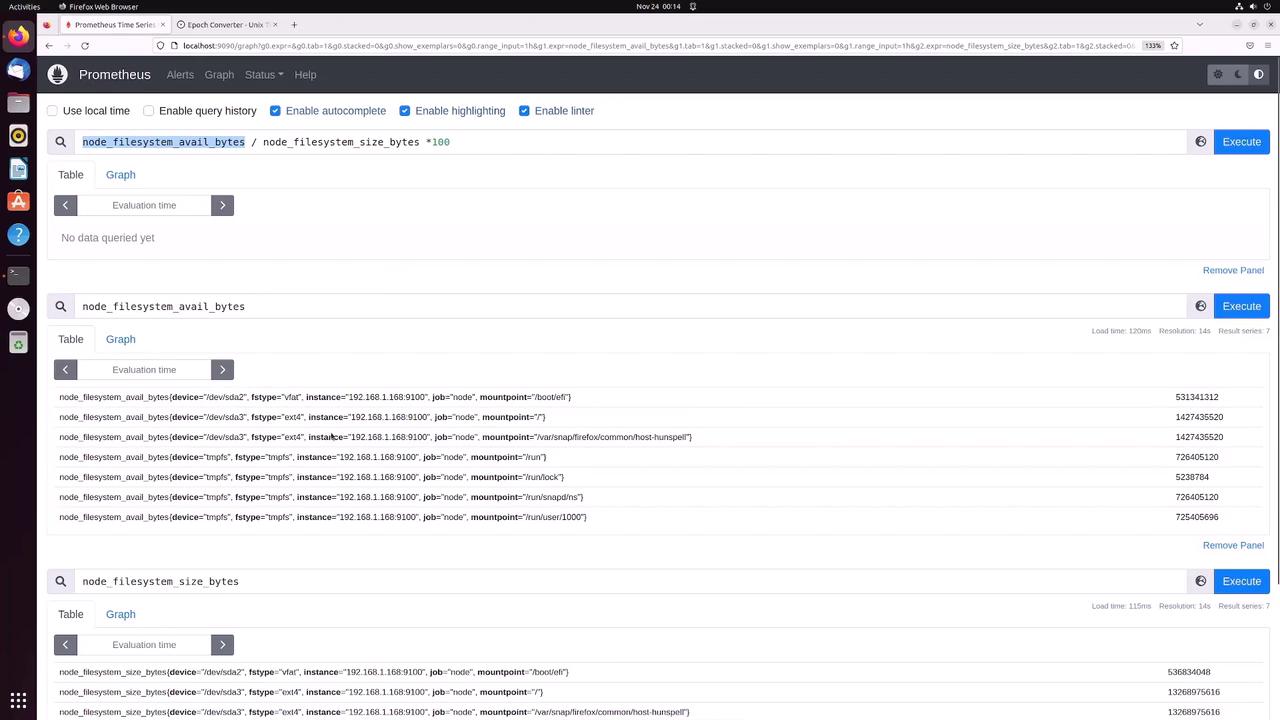
You may want to calculate the percentage of free filesystem space by dividing available bytes by total size bytes and multiplying by 100. For example, assume you have these sample data points:

node_filesystem_avail_bytes{instance="node1", job="node", mountpoint="/home"} 512
node_filesystem_avail_bytes{instance="node1", job="node", mountpoint="/var"} 484
node_filesystem_size_bytes{instance="node1", job="node", mountpoint="/home"} 1024
node_filesystem_size_bytes{instance="node1", job="node", mountpoint="/var"} 2048

The query to calculate the percentage is:

node_filesystem_avail_bytes / node_filesystem_size_bytes * 100

PromQL performs this operation by matching series that have exactly the same labels. In the example above, both metrics contain the labels instance, job, and mountpoint. A perfect match on these labels ensures that each division occurs correctly.

Label Matching Reminder

Every label must match exactly. A mismatch or an extra label on either metric will prevent the match from occurring.

For example, this mismatch will not produce a result:

node_filesystem_avail_bytes{instance="node1", job="node", mountpoint="/home"} 512
node_filesystem_size_bytes{instance="node2", job="node", mountpoint="/home"} 1024

Extra labels, such as an additional device label on one metric, will also cause the series to fail to match.

Matching Vectors with Different Label Sets

There are scenarios where you need to perform operations on vectors that do not share identical labels. Imagine you have HTTP metrics:

  • An http_errors metric with labels method and code
  • An http_requests metric with only the method label

The metrics could appear as follows:

# HTTP errors with two labels: method and code.
http_errors{method="get", code="500"}  40
http_errors{method="get", code="404"}  77
http_errors{method="put", code="501"}  23
http_errors{method="post", code="500"}  61
http_errors{method="post", code="404"}  42
# HTTP requests with one label: method.
http_requests{method="get"} 421
http_requests{method="del"} 288
http_requests{method="post"} 372

A direct query like the one below will fail because the metrics do not match exactly:

http_errors{code="500"} / http_requests

Ignoring Extra Labels

To resolve label mismatches, instruct Prometheus to ignore specific labels using the ignoring keyword. For example, to ignore the code label:

http_errors{code="500"} / ignoring(code) http_requests

This query matches samples based solely on the method label, producing results similar to:

{method="get"}  0.0950  // 40 / 421
{method="post"} 0.1612  // 61 / 372

Tip

You can use the on keyword as an alternative to explicitly specify the labels to match:

http_errors{code="500"} / on(method) http_requests

Both methods allow you to control which labels to include or exclude for matching.

Additional Example: Matching CPU Vectors

Consider two vectors reporting CPU statistics. Each vector has cpu and mode labels, but one may include a mode value that the other does not.

Vector 1:

{cpu="0", mode="idle"}   4
{cpu="1", mode="iowait"} 7
{cpu="2", mode="user"}   2

Vector 2:

{cpu="1", mode="steal"} 4
{cpu="2", mode="user"}  7
{cpu="0", mode="idle"}  2

If matching on only the cpu label is sufficient, you can apply either:

... ignoring(mode) ...

or

... on(cpu) ...

This flexibility allows you to perform the desired calculations regardless of differing mode labels.

The image explains vector matching keywords, showing how two vectors (vector1 and vector2) are combined using specific labels, resulting in a new vector with matching elements. It includes examples of using "on" and "ignoring" keywords for vector operations.

One-to-One vs. Many-to-One Vector Matching

PromQL supports two primary types of vector matching:

One-to-One Matching

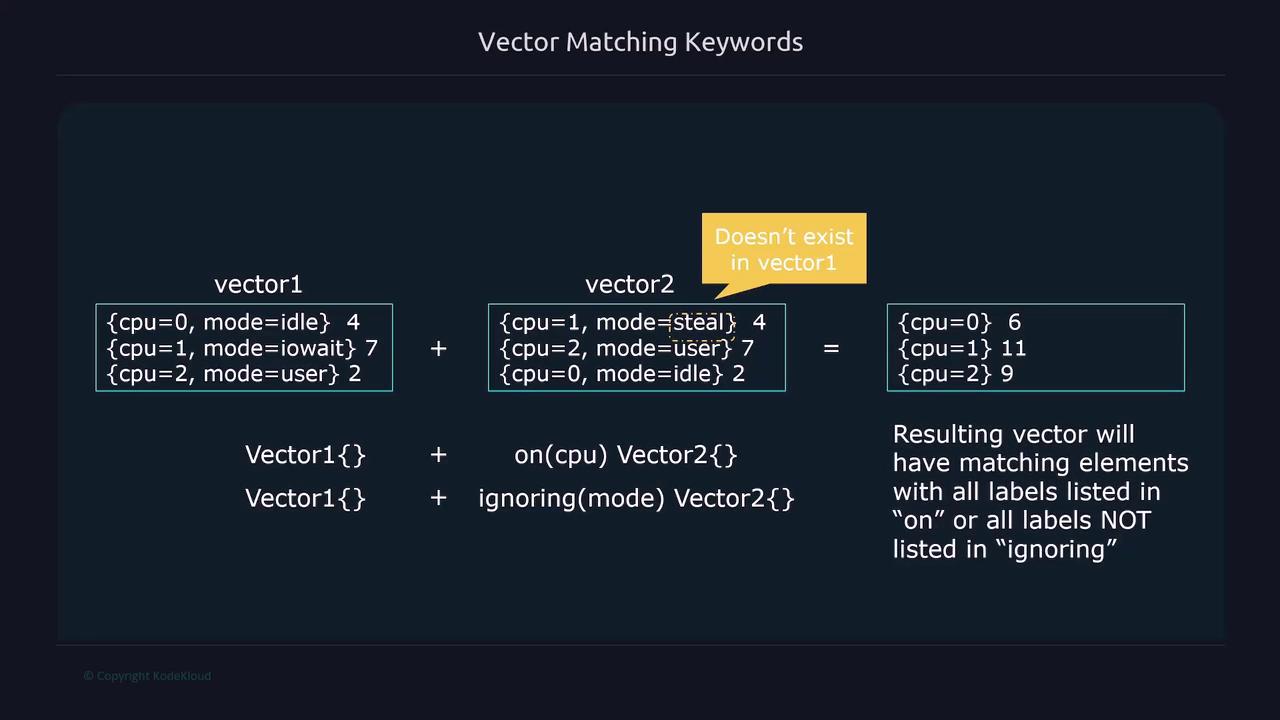
One-to-one matching is the default behavior where every element in the left-hand vector matches with a single element in the right-hand vector. This scenario occurs when all series have identical sets of labels.

The image illustrates a one-to-one vector matching process, where elements from two vectors (Vector1 and Vector2) are matched and summed based on specific attributes, resulting in a new vector.

Many-to-One Matching

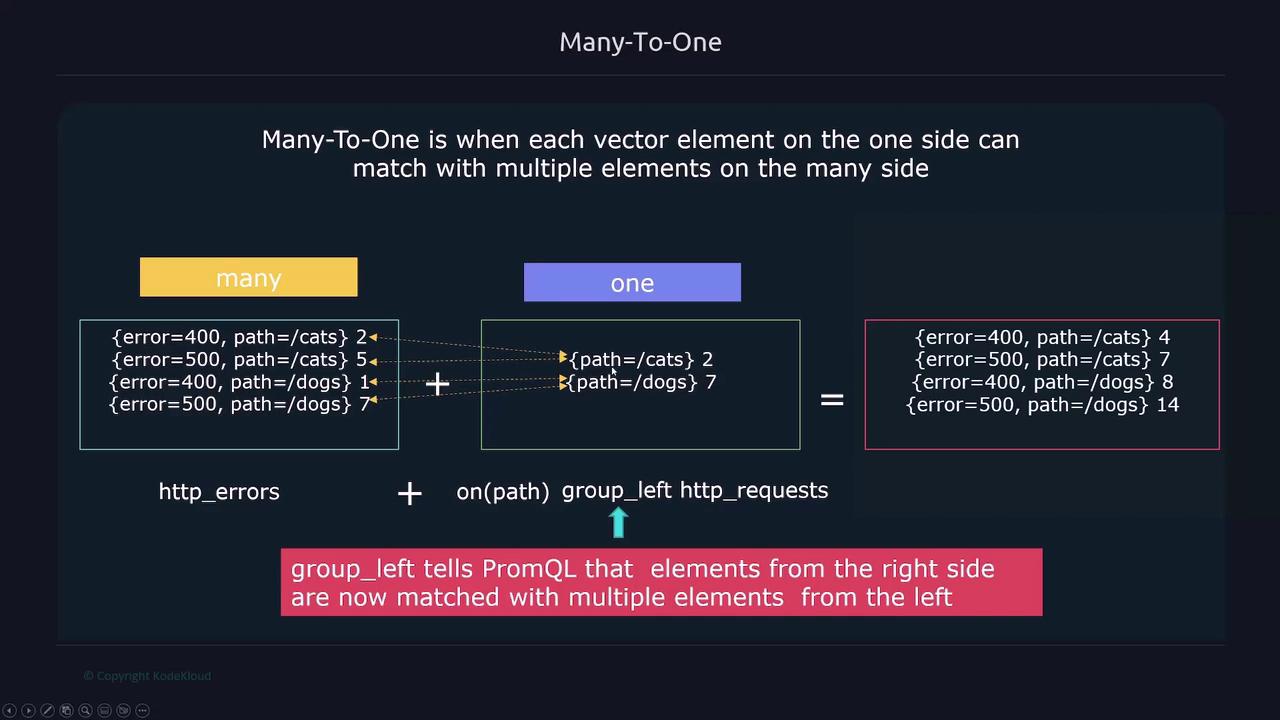
Many-to-one matching occurs when each element on one side corresponds to multiple elements on the other side. For instance, consider an HTTP error metric where multiple error codes exist for a single endpoint paired with a single total requests metric.

When there are more matching series on one side, PromQL produces an error stating "multiple matches for labels." To manage this, use group_left or group_right to explicitly define the matching relationship:

  • group_left: Indicates that multiple series on the left should match with a single series on the right.
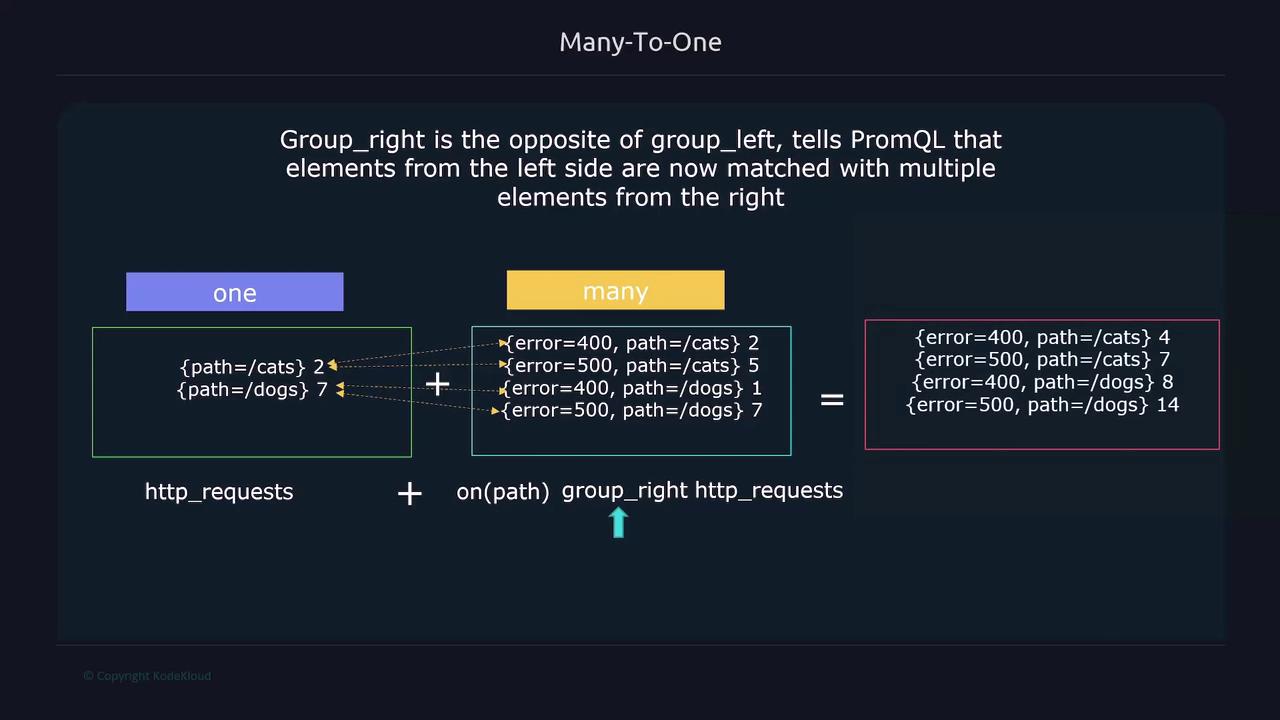
  • group_right: Indicates that a single series on the left should match with multiple series on the right.

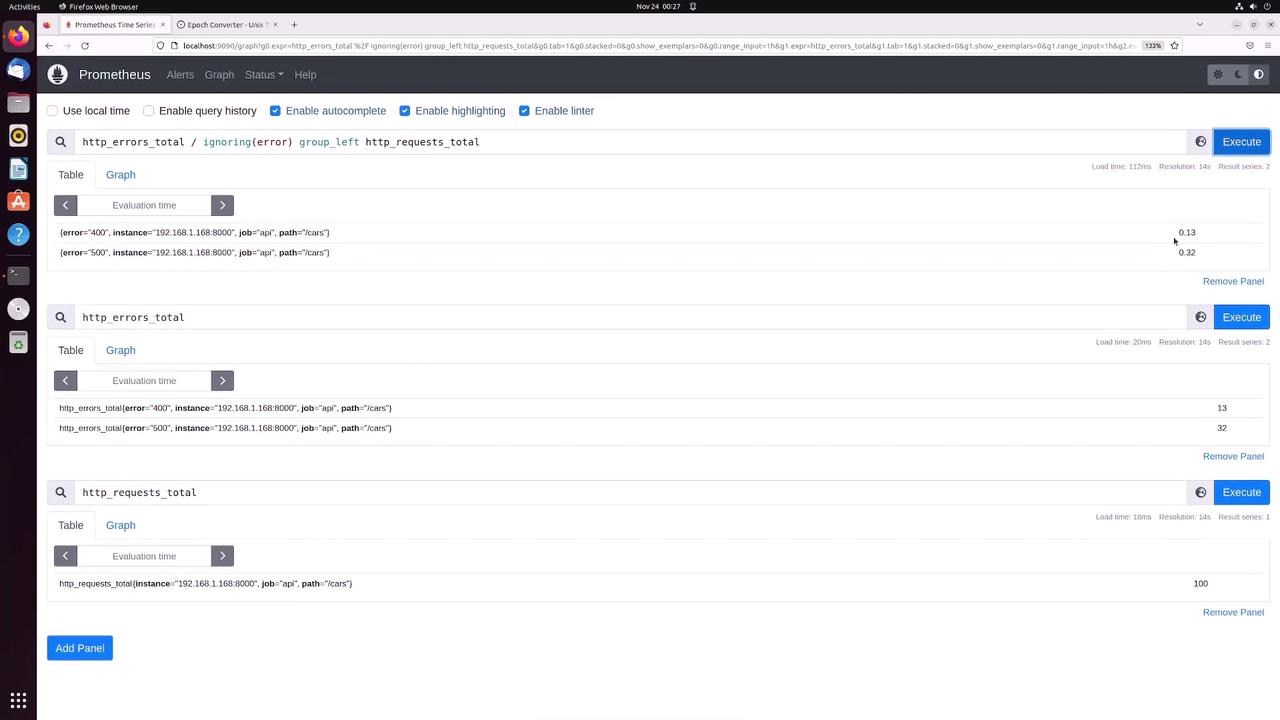
For example, if HTTP errors are on the left and HTTP requests on the right, and you want to match on the path label, the query would be:

http_errors_total{error="400", instance="192.168.1.168:8000", job="api", path="/cars"} 
/
ignoring(error) group_left
http_requests_total{instance="192.168.1.168:8000", job="api", path="/cars"}

This query aggregates multiple error series (grouped on the left) with the corresponding request series (on the right).

The image explains a "Many-To-One" relationship in PromQL, showing how vector elements on one side can match with multiple elements on the other side using the `group_left` function. It includes examples of HTTP errors and requests with paths for illustration.

If the situation were reversed, you could use group_right.

The image below demonstrates a concrete example of a query utilizing group_right for many-to-one matching in PromQL:

The image illustrates a PromQL operation using `group_right` to match elements from the left with multiple elements on the right, resulting in a combined output. It shows a "Many-To-One" relationship with labeled sections "one" and "many" and the resulting calculations.

Filesystem Metrics Example

Let’s review a practical example involving filesystem metrics.

  1. Query available filesystem bytes:

    node_filesystem_avail_bytes
    
  2. Query total filesystem size:

    node_filesystem_size_bytes
    

To calculate the percentage of free filesystem space, the arithmetic is:

node_filesystem_avail_bytes / node_filesystem_size_bytes * 100

Prometheus processes this query by matching each series in the available bytes metric with the corresponding series in the size bytes metric. Labels such as device, fstype, instance, job, and mountpoint must match exactly. Any discrepancy—such as an extra or missing label—will cause the operation to fail.

The image shows a Prometheus web interface displaying queries related to filesystem metrics, including available and total bytes, with results shown in a table format.

For example, consider these sample outputs:

node_filesystem_avail_bytes{device="/dev/sda2", fstype="vfat", instance="192.168.1.168:9100", job="node", mountpoint="/boot/efi"} 98.97682793770934
node_filesystem_avail_bytes{device="/dev/sda3", fstype="ext4", instance="192.168.1.168:9100", job="node", mountpoint="/"} 10.7576191937264315
node_filesystem_size_bytes{device="/dev/sda2", fstype="vfat", instance="192.168.1.168:9100", job="node", mountpoint="/boot/efi"} 5313431312
node_filesystem_size_bytes{device="/dev/sda3", fstype="ext4", instance="192.168.1.168:9100", job="node", mountpoint="/"} 1427435520

For the operation to be successful, every label on the left must find an exact match on the right.

HTTP Metrics Example with Label Matching

Another common scenario involves comparing HTTP metrics. Consider these two metrics:

  • http_errors_total with labels: error, instance, job, path
  • http_requests_total with labels: instance, job, path

For instance:

http_errors_total{error="400", instance="192.168.1.168:8000", job="api", path="/cars"} 48
http_requests_total{instance="192.168.1.168:8000", job="api", path="/cars"} 100

A direct division would fail because the error series includes an extra label (error). To address this, you can:

  • Use ignoring(error):

    http_errors_total / ignoring(error) http_requests_total
    
  • Or specify the matching labels using on:

    http_errors_total / on(instance, job, path) http_requests_total
    

Both approaches yield a value of 0.48, meaning 48% of the requests resulted in an error.

If you have multiple error series (e.g., separate series for error 400 and error 500) corresponding to a single request series, you must use group_left (or group_right, depending on your data structure):

http_errors_total / ignoring(error) group_left http_requests_total

This grouping enables each error series to match with the corresponding request series while preserving individual error labels.

The image shows a Prometheus web interface displaying query results for HTTP errors and requests, with data visualized in tables and graphs.

Summary

By mastering vector matching techniques—whether one-to-one or many-to-one using ignoring, on, group_left, or group_right—you can construct sophisticated PromQL queries that accurately aggregate and compare metrics. For further reading, consider exploring these resources:

Understanding these techniques enables you to build queries that reflect your monitoring requirements precisely and efficiently.

Watch Video

Watch video content

Previous
Operators