Prometheus Certified Associate (PCA)

Prometheus Fundamentals

Node Exporter

This guide explains how to install and run the Prometheus Node Exporter on a Linux host to collect and expose system metrics for Prometheus. Node Exporter gathers various system metrics—such as CPU, memory, and disk statistics—and makes them available in a Prometheus-friendly format.

Downloading and Installing Node Exporter

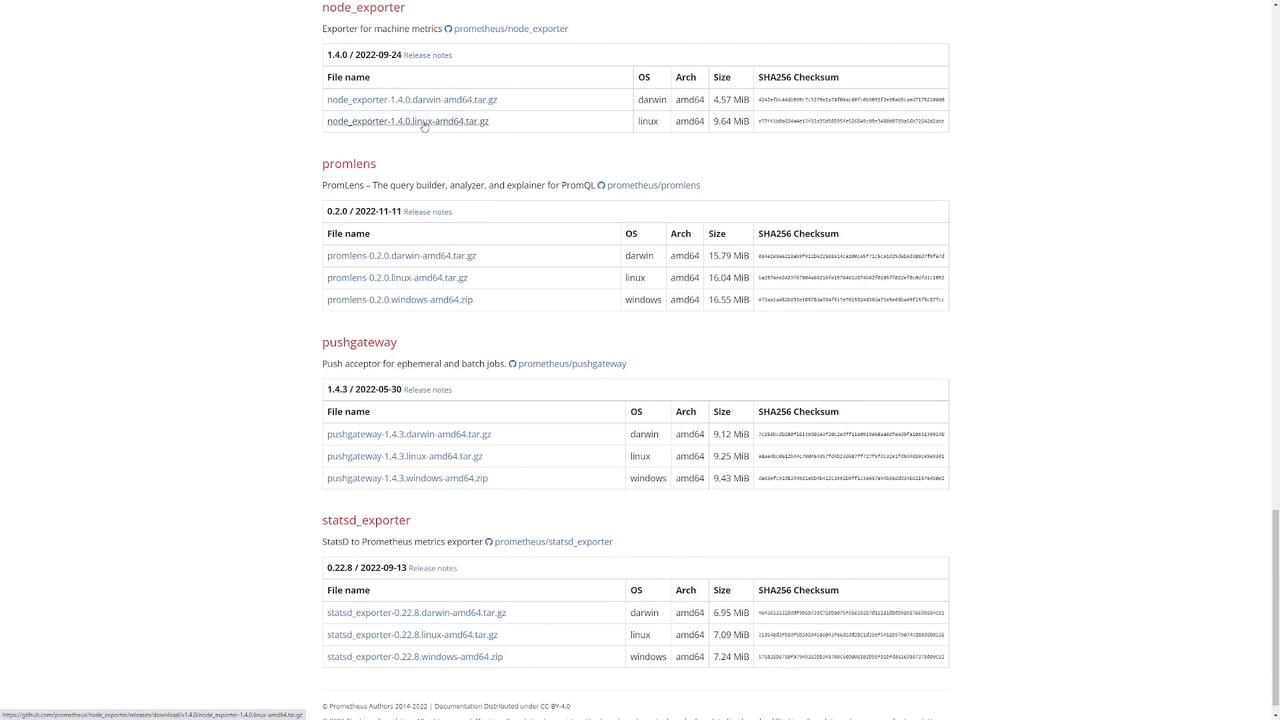
First, navigate to the Prometheus download page and select Node Exporter. Choose your desired version and either download the binary directly or copy its URL for later use.

For example, to download the binary using wget, run:

wget https://github.com/prometheus/node_exporter/releases/download/v1.3.1/node_exporter-1.3.1.linux-amd64.tar.gz

Since the file is packaged as a tarball, you need to extract it. Use the following command:

tar -xvf node_exporter-1.3.1.linux-amd64.tar.gz

After extraction, change into the newly created directory. This directory contains the main Node Exporter executable.

Running Node Exporter

To start Node Exporter, execute the binary:

./node_exporter

By default, Node Exporter listens on port 9100. To verify that it is running correctly, open a new terminal tab and run:

curl localhost:9100/metrics

You should see output similar to the following, listing various Prometheus metrics:

# TYPE promhttp_metric_handler_requests_in_flight gauge
promhttp_metric_handler_requests_in_flight 1
# HELP promhttp_metric_handler_requests_total Total number of scrapes by HTTP status code.
# TYPE promhttp_metric_handler_requests_total counter
promhttp_metric_handler_requests_total{code="200"} 0
promhttp_metric_handler_requests_total{code="500"} 0
promhttp_metric_handler_requests_total{code="503"} 0

This confirms that Node Exporter is successfully collecting and exposing system metrics for Prometheus.

Demonstration with Node Exporter 1.4.0

In this example, we will use Node Exporter version 1.4.0.

  1. Visit the Prometheus download page and select Node Exporter.

  2. On the download page, locate the desired Node Exporter version and copy the download link for that release.

    Note

    The download page displays detailed information including version numbers, supported operating systems, architectures, file sizes, and SHA256 checksums to help you verify the correct release.

    The image shows a list of software packages with details such as version numbers, operating systems, architecture, file sizes, and SHA256 checksums. It includes entries for "node_exporter," "promlens," "pushgateway," and "statsd_exporter."

  3. Download the file using wget:

    wget https://github.com/prometheus/node_exporter/releases/download/v1.4.0/node_exporter-1.4.0.linux-amd64.tar.gz
    

    The console will display the download progress:

    --2022-11-12 23:43:09--  https://github.com/prometheus/node_exporter/releases/download/v1.4.0/node_exporter-1.4.0.linux-amd64.tar.gz
    Resolving github.com (github.com)... 140.82.114.4
    Connecting to github.com (github.com)|140.82.114.4|:443... connected.
    HTTP request sent, awaiting response... 302 Found
    Location: https://objects.githubusercontent.com/github-production-release-asset-2e65bfe/9524057/5fdacb9b-a17a-4b4a-bf0f-f2946771d4ca?... [following]
    Resolving objects.githubusercontent.com (objects.githubusercontent.com)... 185.199.108.133, 185.199.110.133, 185.199.111.133, ...
    HTTP request sent, awaiting response... 200 OK
    Length: 10111972 (9.6M) [application/octet-stream]
    Saving to: ‘node_exporter-1.4.0.linux-amd64.tar.gz’
    
    node_exporter-1.4.0.linux-amd64.tar.gz           100%[============================================================================>]  9.64M  22.7MB/s    in 0.4s
    
    2022-11-12 23:43:10 (22.7 MB/s) - ‘node_exporter-1.4.0.linux-amd64.tar.gz’ saved [10111972/10111972]
    
  4. Verify the downloaded tarball by listing the files:

    ls
    

    You should see the tarball and a directory named similar to node_exporter-1.4.0.linux-amd64.

  5. Change into the Node Exporter directory:

    cd node_exporter-1.4.0.linux-amd64/
    
  6. Start Node Exporter by running the executable:

    ./node_exporter
    

    The output will include logs indicating that the exporter is running on port 9100 without any errors, for example:

    ts=2022-11-13T04:43:38.820Z caller=node_exporter.go:115 level=info collector=edac
    ts=2022-11-13T04:43:38.820Z caller=node_exporter.go:115 level=info collector=entropy
    ...
    ts=2022-11-13T04:43:38.821Z caller=tls_config.go:195 level=info msg="Listening on" address=::9100
    ts=2022-11-13T04:43:38.821Z caller=tls_config.go:195 level=info msg="TLS is disabled." http2=false
    

Verifying Metrics Exposure

To confirm that Node Exporter is exposing metrics correctly, open a new terminal tab and execute:

curl localhost:9100/metrics

You will see a variety of Prometheus metrics, for example:

# TYPE node_timex_tick_seconds gauge
node_timex_tick_seconds 0.01
# HELP node_udp_queues Number of allocated memory in the kernel for UDP datagrams in bytes.
# TYPE node_udp_queues gauge
node_udp_queues{ip="v4",queue="rx"} 0
node_udp_queues{ip="v4",queue="tx"} 0
node_udp_queues{ip="v6",queue="rx"} 0
node_udp_queues{ip="v6",queue="tx"} 0
# HELP node_uname_info Labeled system information as provided by the uname system call.
node_uname_info{domainname="(none)",machine="x86_64",nodename="user2",release="5.15.0-52-generic",sysname="Linux",version="#58-Ubuntu SMP Thu Oct 13 08:03:55 UTC 2022"} 1
...

This output confirms that Prometheus can successfully scrape the system metrics provided by Node Exporter. Alternatively, you can view the metrics by accessing http://localhost:9100/metrics in your web browser.

Now your Linux system is successfully running Node Exporter, providing detailed system metrics for monitoring with Prometheus.

Watch Video

Watch video content

Previous
Prometheus Installation Demo