Prometheus enables you to collect, store, and analyze metrics from a wide variety of sources. Its built-in dashboarding tools and alerting mechanisms allow you to maintain a proactive approach to system monitoring.
Distributed Data Center Monitoring
Imagine managing multiple data centers scattered across the country alongside services hosted on cloud platforms like AWS. In such a distributed infrastructure, consolidating metrics from all these locations onto a unified dashboard becomes essential. Prometheus makes this possible by aggregating data from various endpoints and presenting it in a single, coherent view.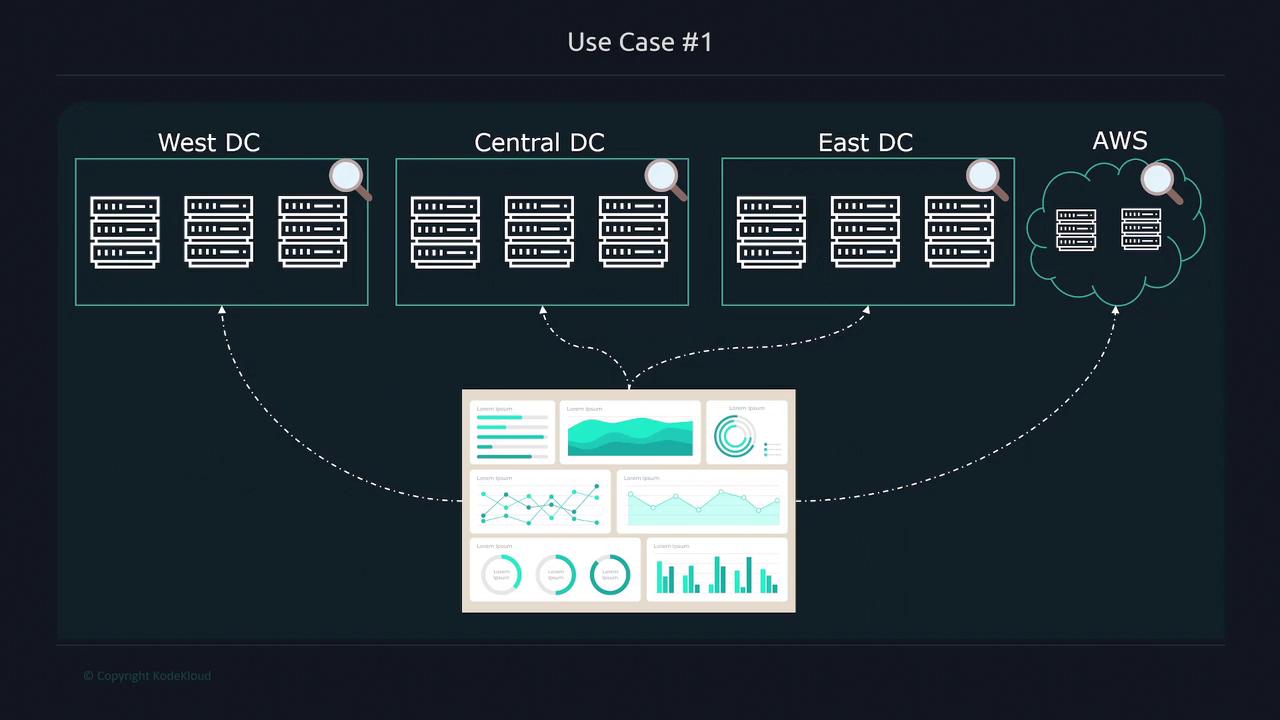
Proactive Alerting for High Memory Usage
Consider a scenario where outages occur due to high memory usage on your MySQL database server. To mitigate this risk, you can configure Prometheus to monitor memory consumption and send alerts when usage exceeds a predetermined threshold, such as 80% of maximum capacity. These alerts can notify your operations team via email, Slack, SMS, and other channels, enabling prompt action to prevent service disruptions.
Analyzing Video Upload Performance
In another scenario, a new video upload feature on your website raises concerns about possible performance degradation when handling large files. To address this, you can use Prometheus to track two key metrics: the average file size of uploads and the corresponding request latency. By charting these metrics together, you can identify the file size threshold at which application performance begins to decline.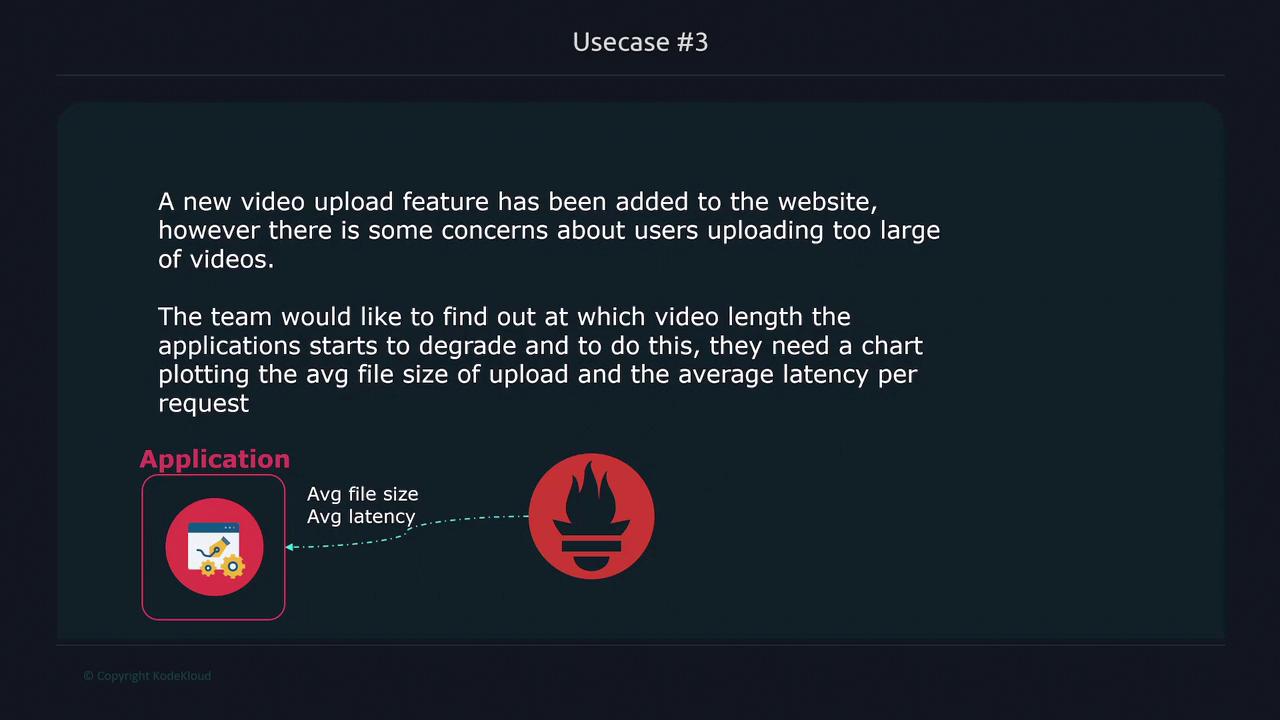
Conclusion
Leveraging Prometheus across these scenarios provides a comprehensive monitoring solution:| Key Capability | Use Case | Benefit |
|---|---|---|
| Metric Aggregation | Monitoring distributed data centers and cloud systems | Unified dashboard for comprehensive data insights |
| Alerting | Proactively managing resource thresholds | Timely notifications to prevent service outages |
| Performance Analysis | Evaluating video upload impacts | Determine thresholds to maintain optimal performance |
For further insights into monitoring best practices and configuration options, explore the Prometheus Documentation.