Why Debugging Is Important in Rust
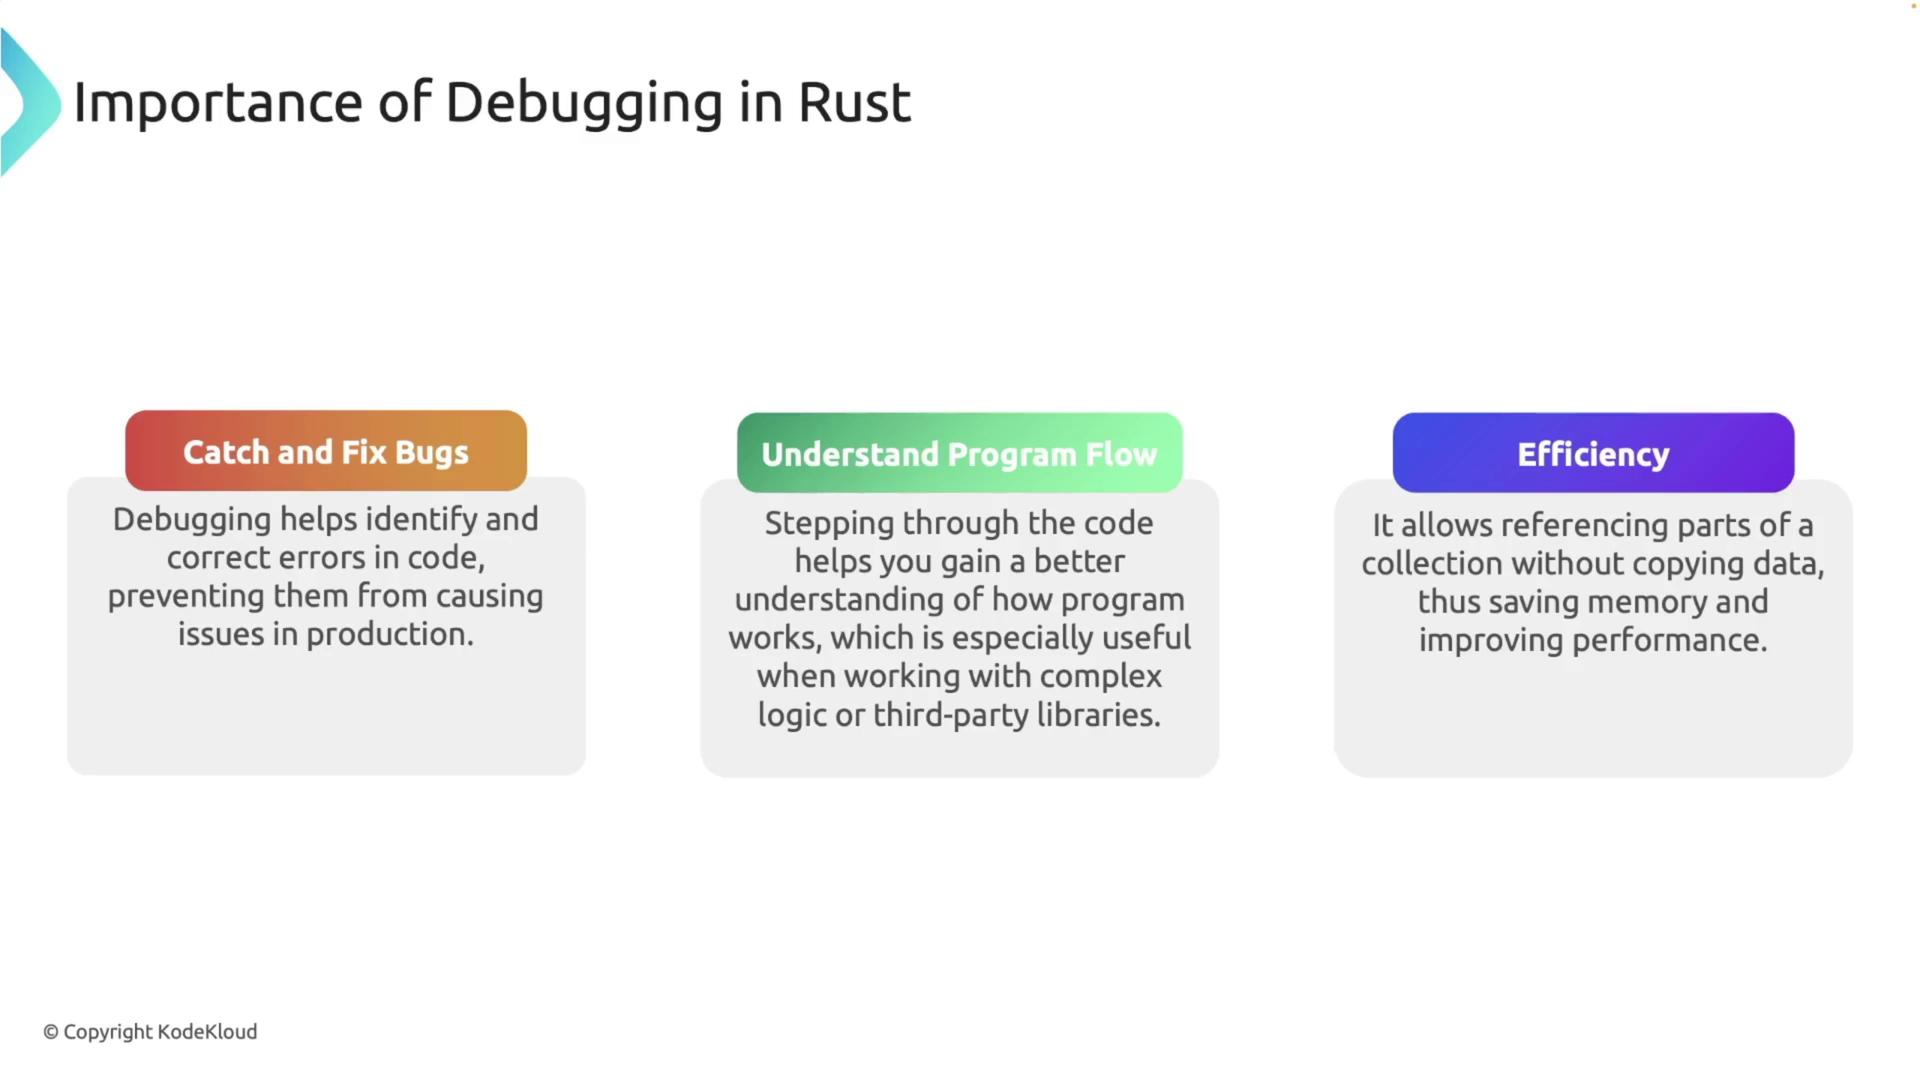
Rust is renowned for its memory safety and robust concurrency features. However, bugs in logic, memory management, or concurrency can still arise. Effective debugging ensures the reliability and efficiency of your applications by:- Catching and Fixing Bugs: Identify and resolve errors before they manifest in production.
- Understanding Program Flow: Step through your code to gain insights into complex logic and the behavior of third-party libraries.
- Optimizing Performance: Uncover performance bottlenecks to fine-tune your application.

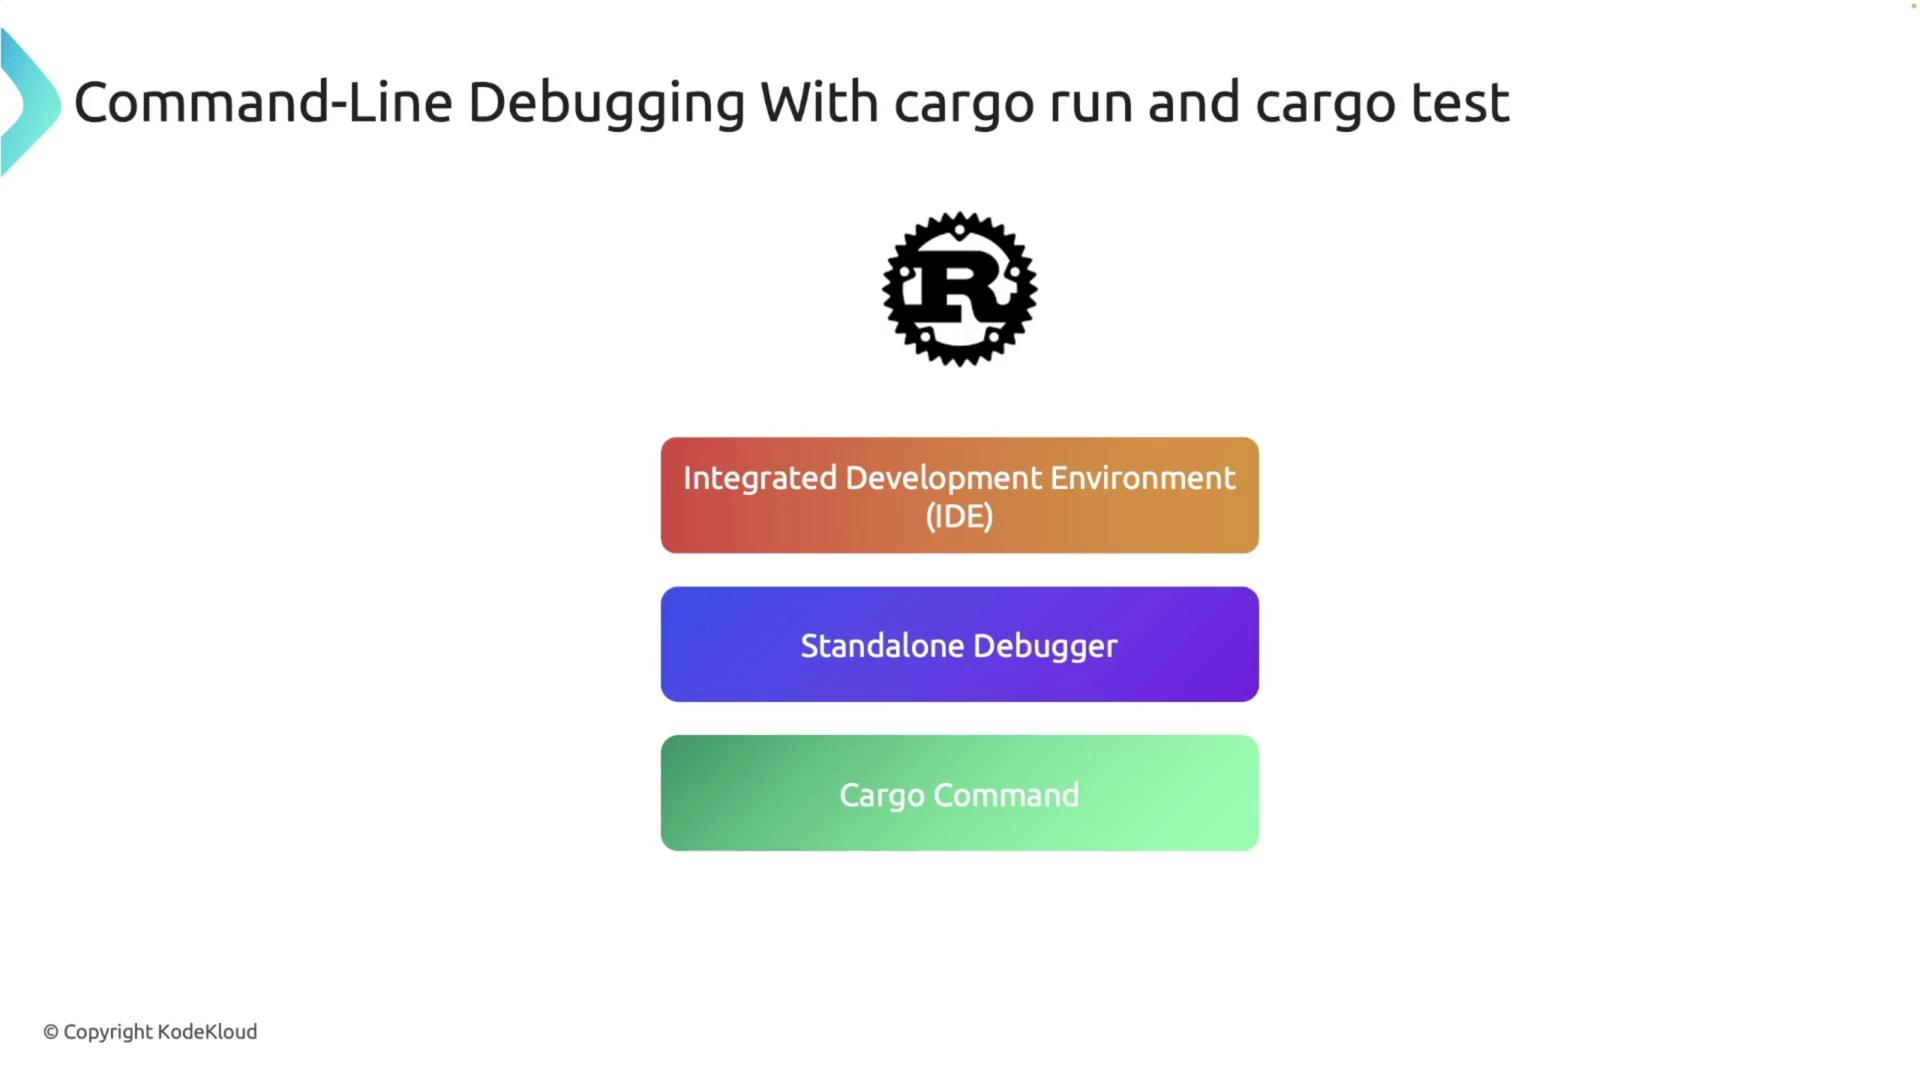
Debugging Tools in Rust
Let’s explore the range of tools available to help you debug your Rust code.Integrated Development Environments (IDEs)
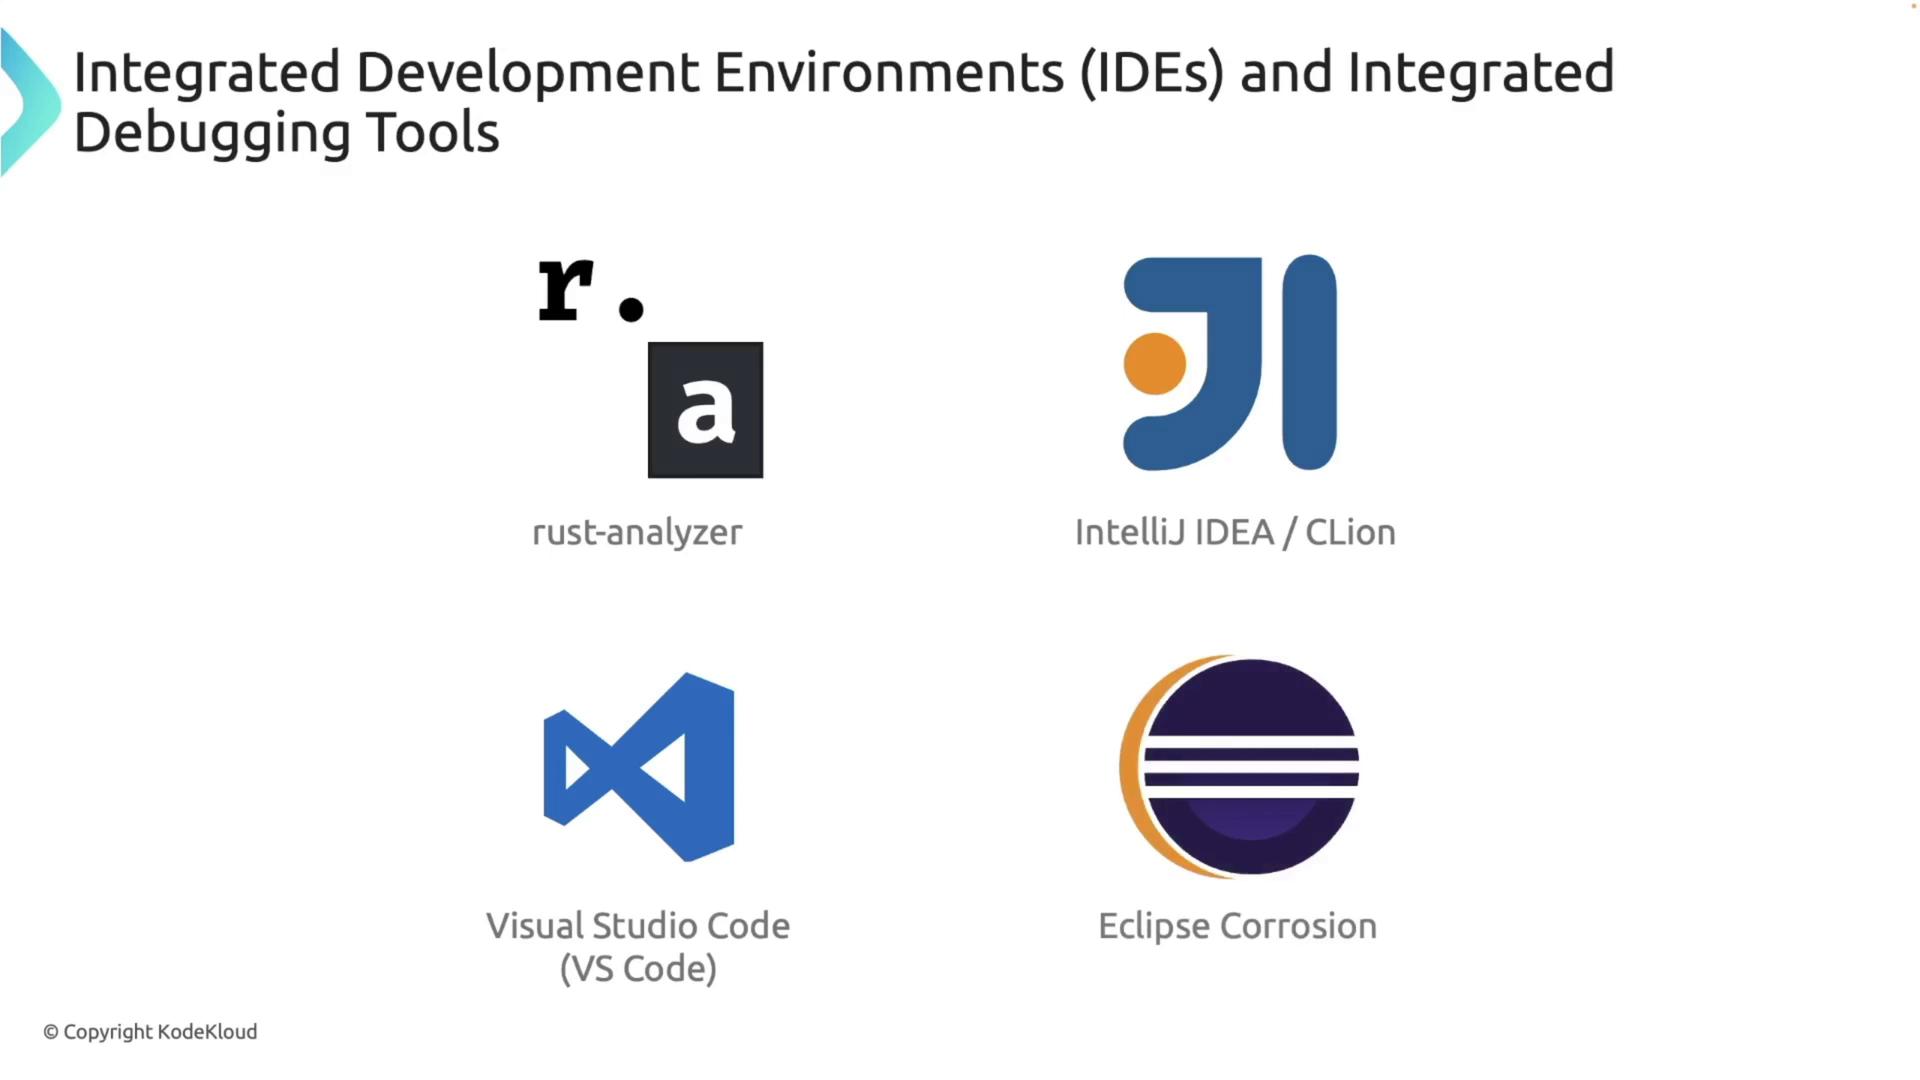
For beginners, IDEs with built-in debugging tools provide an accessible starting point. These environments offer graphical interfaces to set breakpoints, step through code, and inspect variables. Popular IDEs include:- Visual Studio Code: Leverage the Rust Analyzer extension and CodeLLDB for a seamless debugging experience.
- IntelliJ IDEA: Use the Rust plugin for robust debugging capabilities.
- Eclipse Corrosion: If you’re an Eclipse user, Corrosion offers excellent integration with the Eclipse ecosystem.
Debugging with VS Code
Here’s an example to get you started with debugging in VS Code. In this Rust code snippet, a main function declares three variables, prints their values, and calls a utility function.-
Set Breakpoints: Click the left margin next to the lines where you want execution to pause, for example on the lines printing
xandy. - Start the Debugger: Open the sidebar by clicking the “Run and Debug” icon. If a prompt appears stating the debugger cannot start, click “Yes” so VS Code can locate your Cargo.toml file.
-
Configure Debug Settings: You may need to set up a debug configuration. An example configuration for CodeLLDB in VS Code is shown below:
-
Step Through Code: When execution pauses at a breakpoint, hover over variables to inspect their values or use the dedicated variables panel. Use “Step Over” and “Step Into” commands to navigate through your code. Stepping into functions, like
util, will update the call stack accordingly.
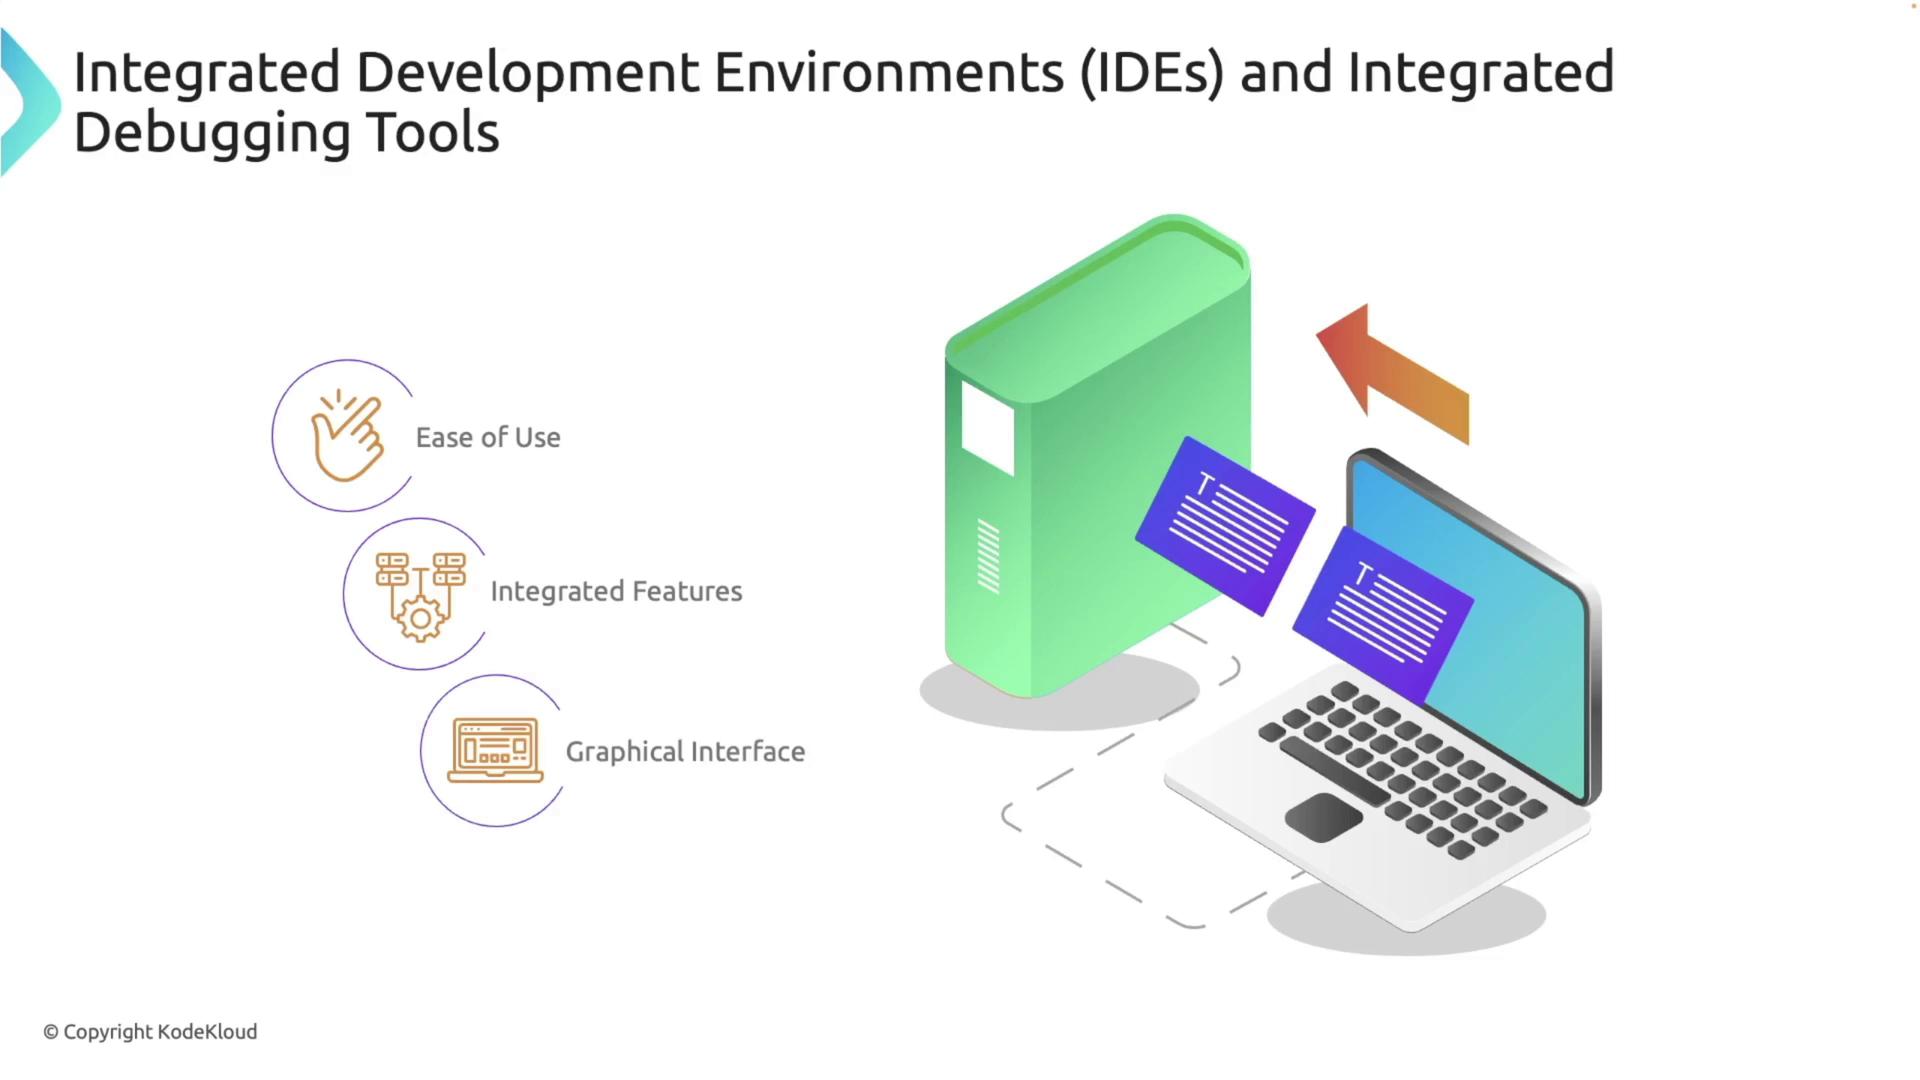
Key Features of IDE Debugging
Using an IDE for debugging offers several advantages:- Ease of Use: User-friendly interfaces simplify the process of setting up and managing debugging sessions.
- Integrated Tools: Benefit from features like syntax highlighting, error checking, and auto-completion.
- Graphical Interface: Visual tools such as breakpoints, the variables panel, and call stack navigation enhance code inspection capabilities.
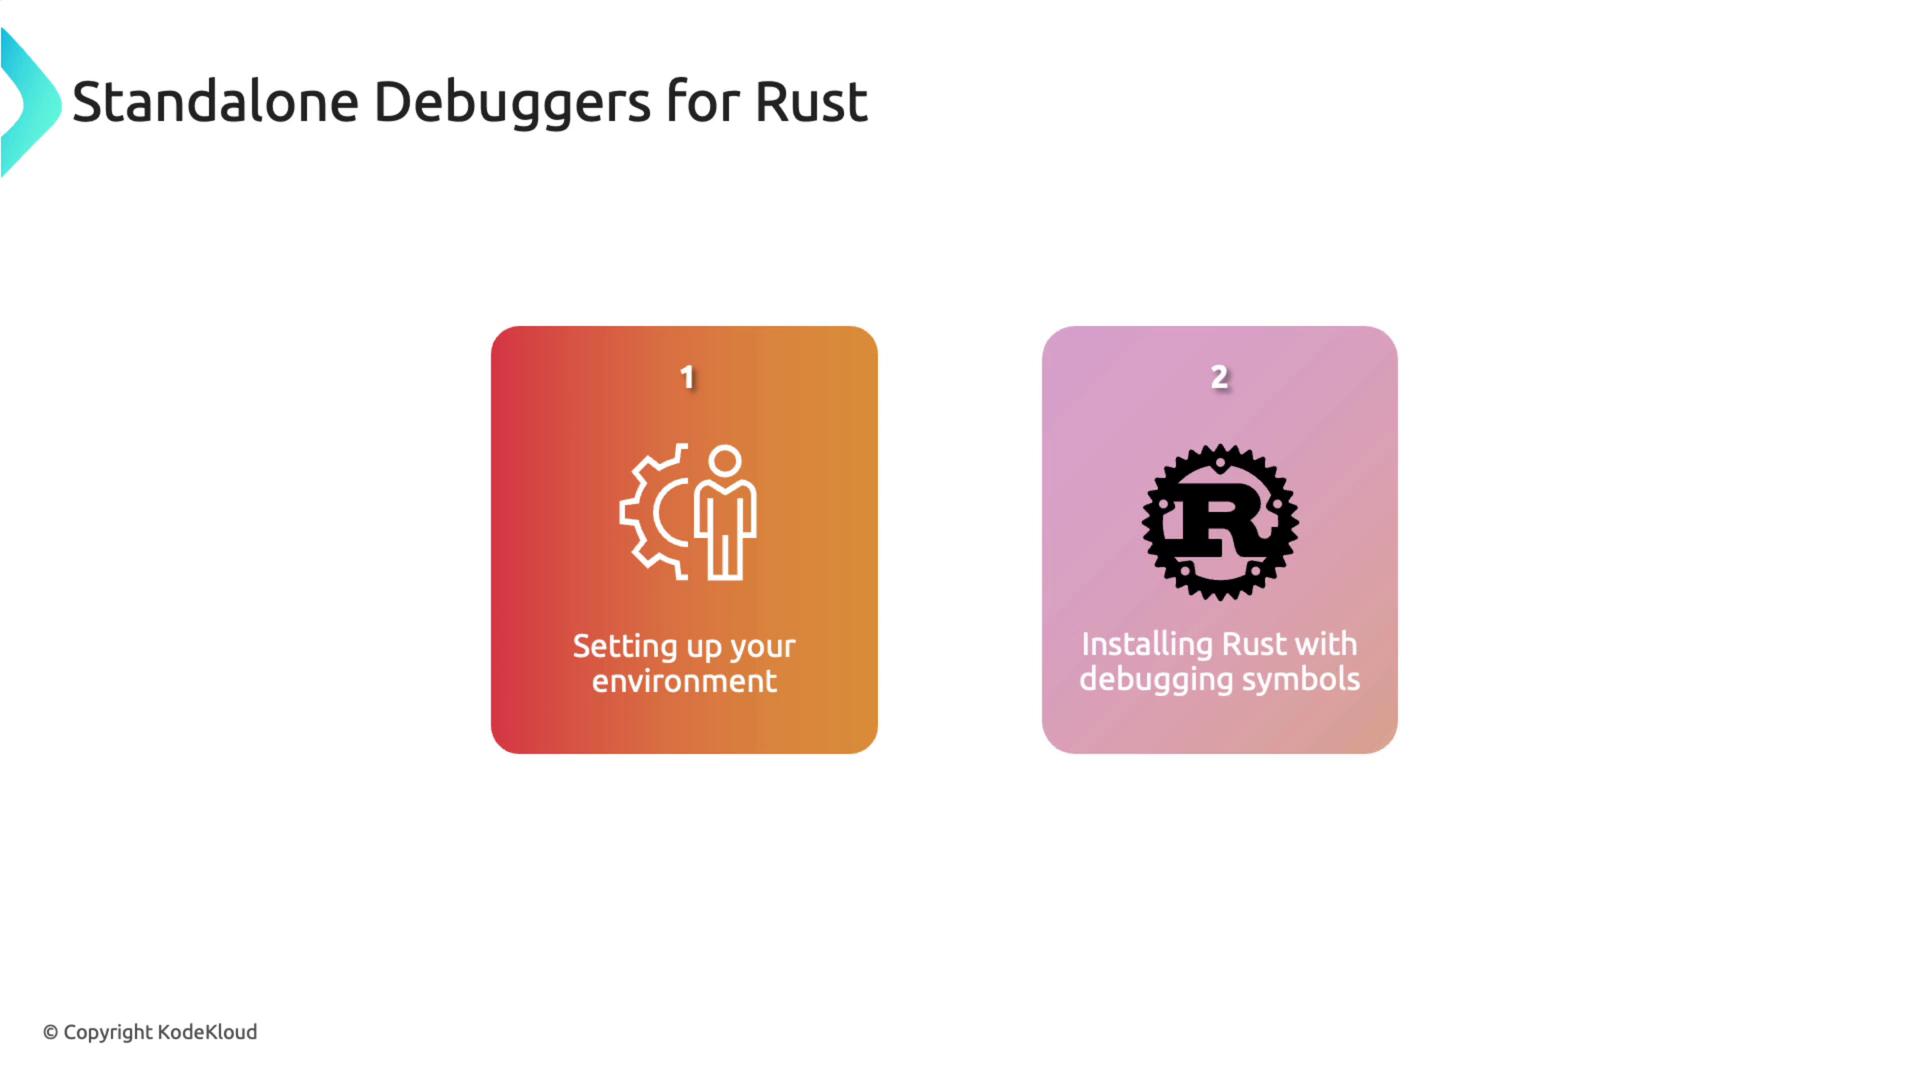
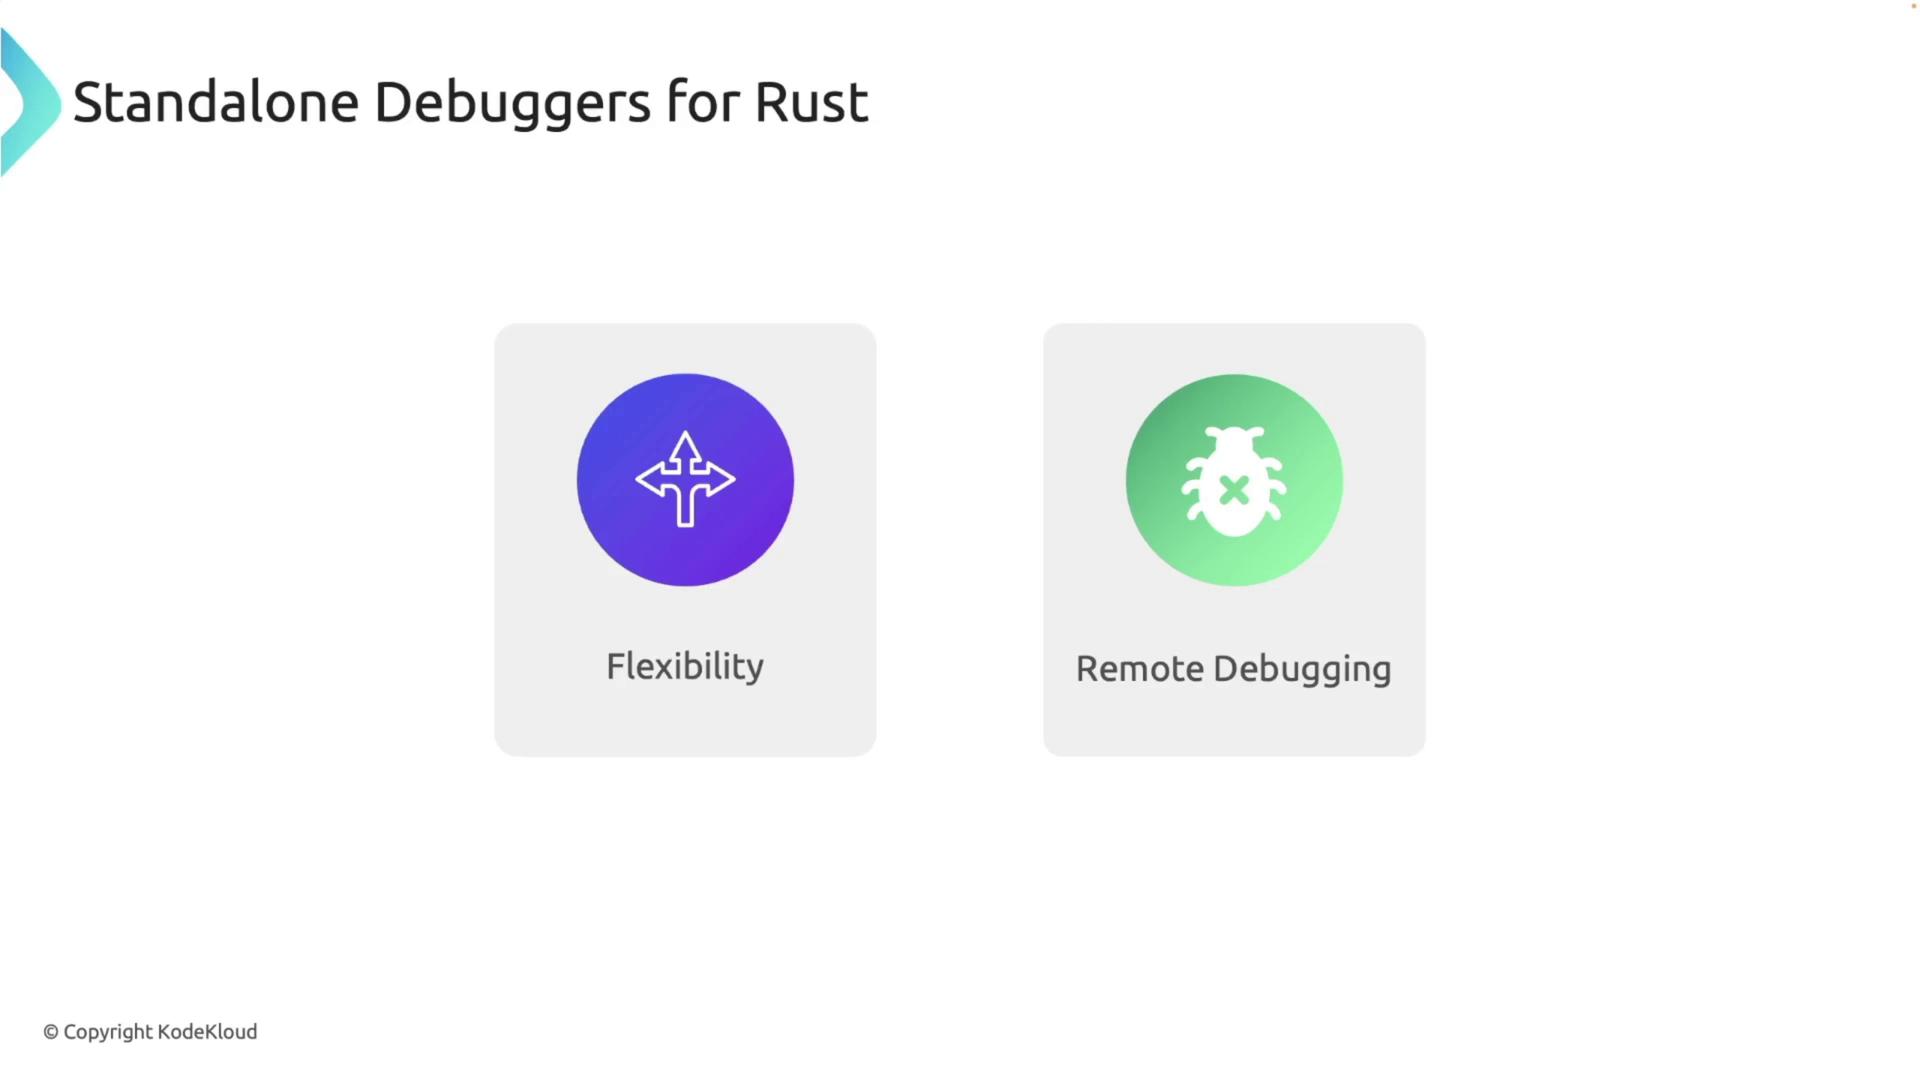
Standalone Debuggers and Cargo Commands
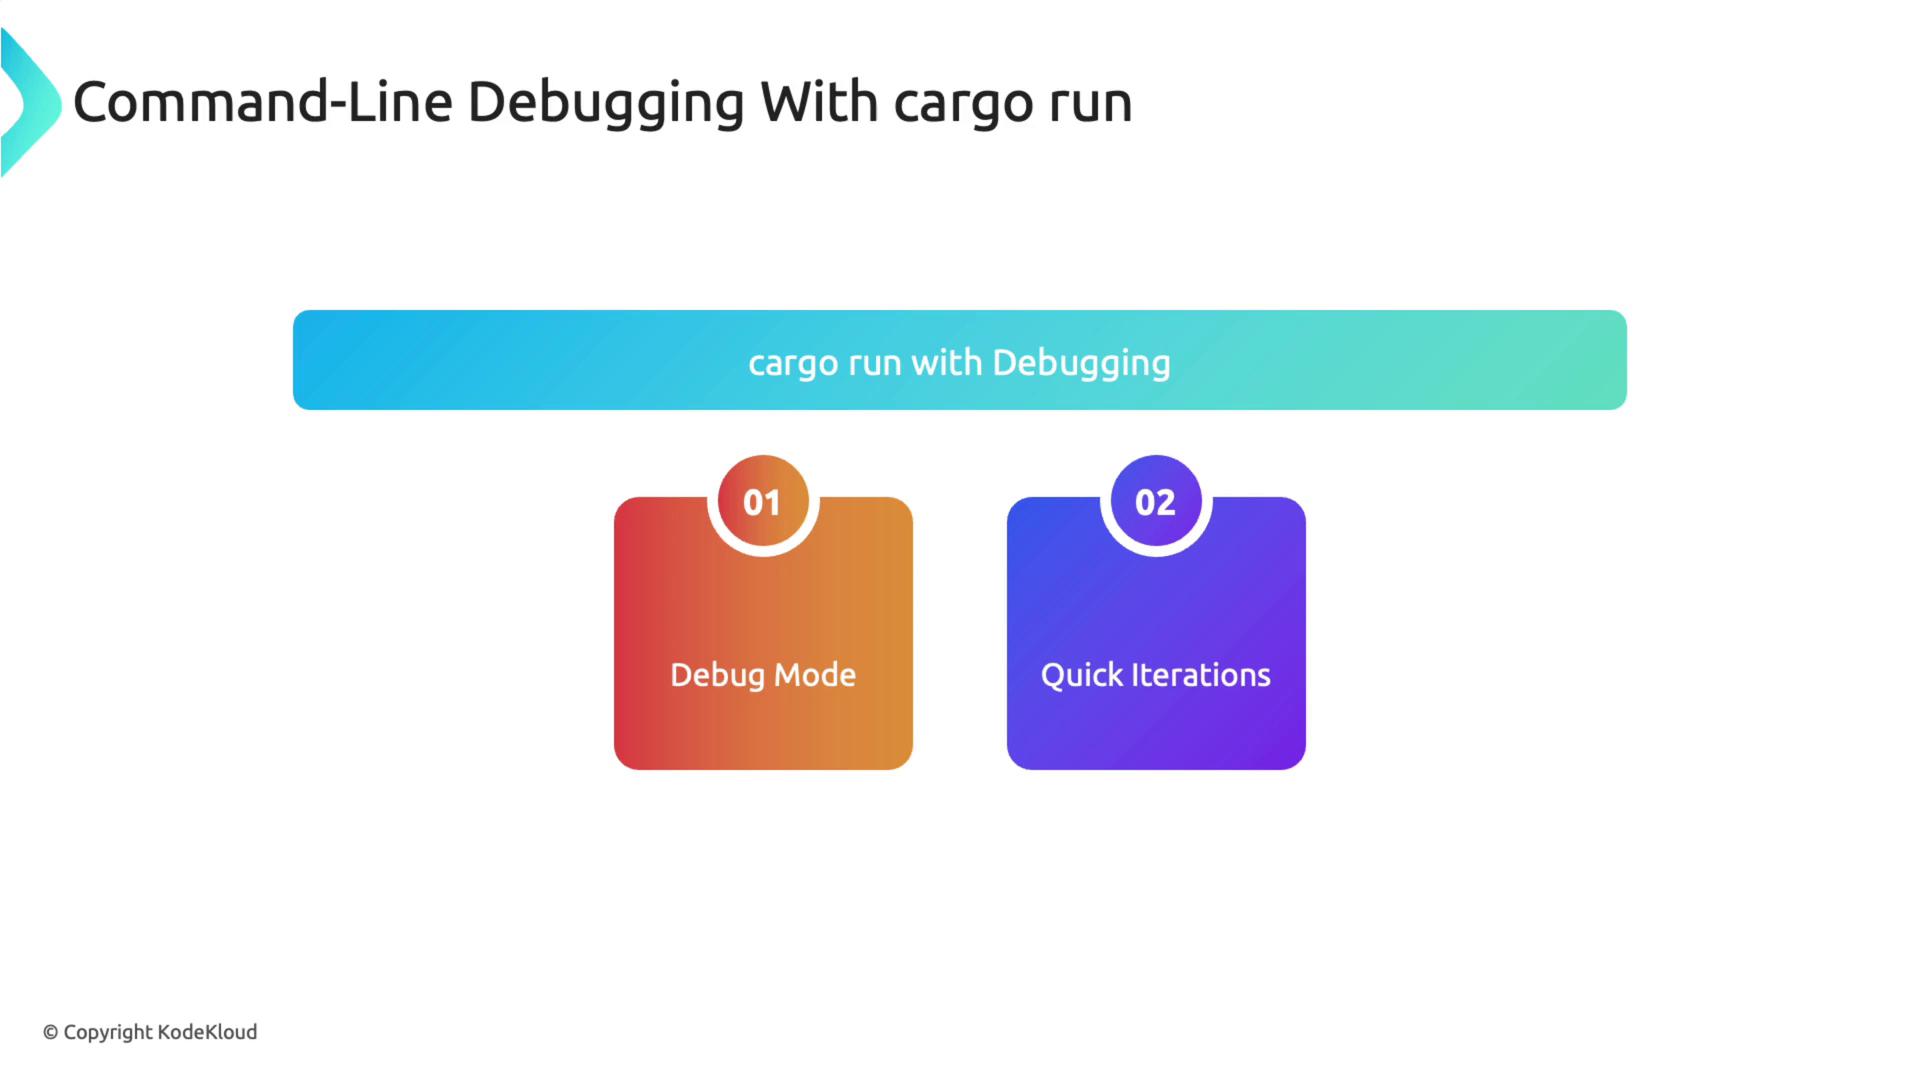
While IDEs simplify starting out, standalone debuggers like GDB and LLDB offer enhanced flexibility for complex tasks, including remote debugging for applications on different servers. For quick debugging tasks, Rust’s Cargo tool provides robust commands:- Using Cargo Run: Running
cargo runbuilds your project in debug mode, which automatically includes debugging symbols. - Using Cargo Test: Execute
cargo testto diagnose issues with tests. Using verbose mode can reveal output fromprintln!statements for deeper insight.
Conclusion
This guide has explored the diverse range of debugging tools available for Rust, from integrated IDE options such as VS Code, to standalone debuggers like GDB/LLDB, and powerful Cargo commands. Each method offers unique benefits to help diagnose and resolve issues in your code effectively. In our next article, we will delve into advanced debugging techniques usingprintln! and logging as part of your debugging toolkit.