> ## Documentation Index
> Fetch the complete documentation index at: https://notes.kodekloud.com/llms.txt
> Use this file to discover all available pages before exploring further.
# Back of Envelope Estimation
> Guide to performing back-of-envelope capacity estimations for scalable web systems, converting user activity into RPS, storage, and component sizing with assumptions and trade-offs
Interviewers often ask a simple but revealing question: How big does this system actually need to be?
* How many servers?
* How much storage?
* What bottlenecks should you plan for?
This is a back-of-envelope estimation — a quick, reasoned approximation that demonstrates your assumptions and how you think about scale. Don’t give a single number without showing the factors that led you to it. Break large numbers into smaller pieces and explain each assumption.
Start from users and activity patterns.
Example assumptions
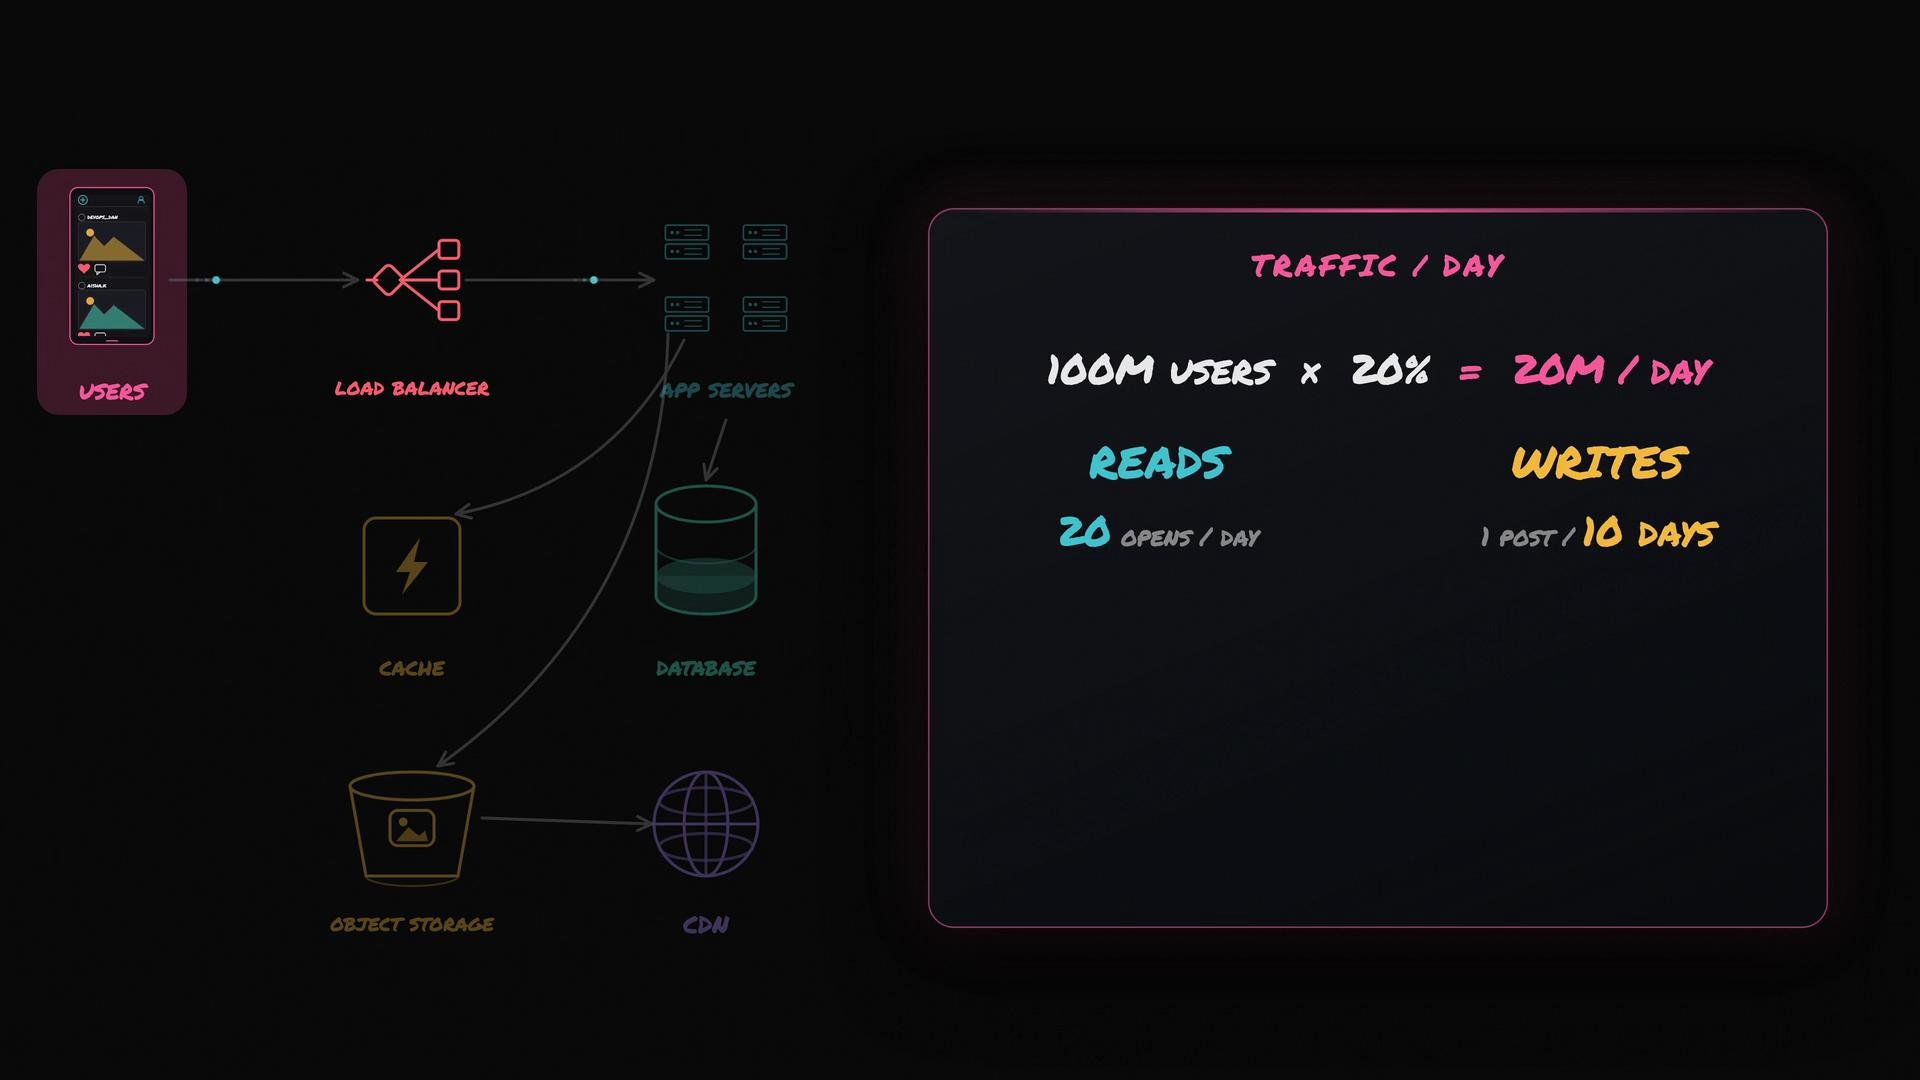
* Registered users: 100 million
* Daily active users (DAU): 20% → 20 million DAU
* App type: photo-sharing (reads dominate)
* Opens per active user per day: 20
* Posts per active user per day: 0.1 (one post every 10 days)
From those assumptions we compute daily totals:
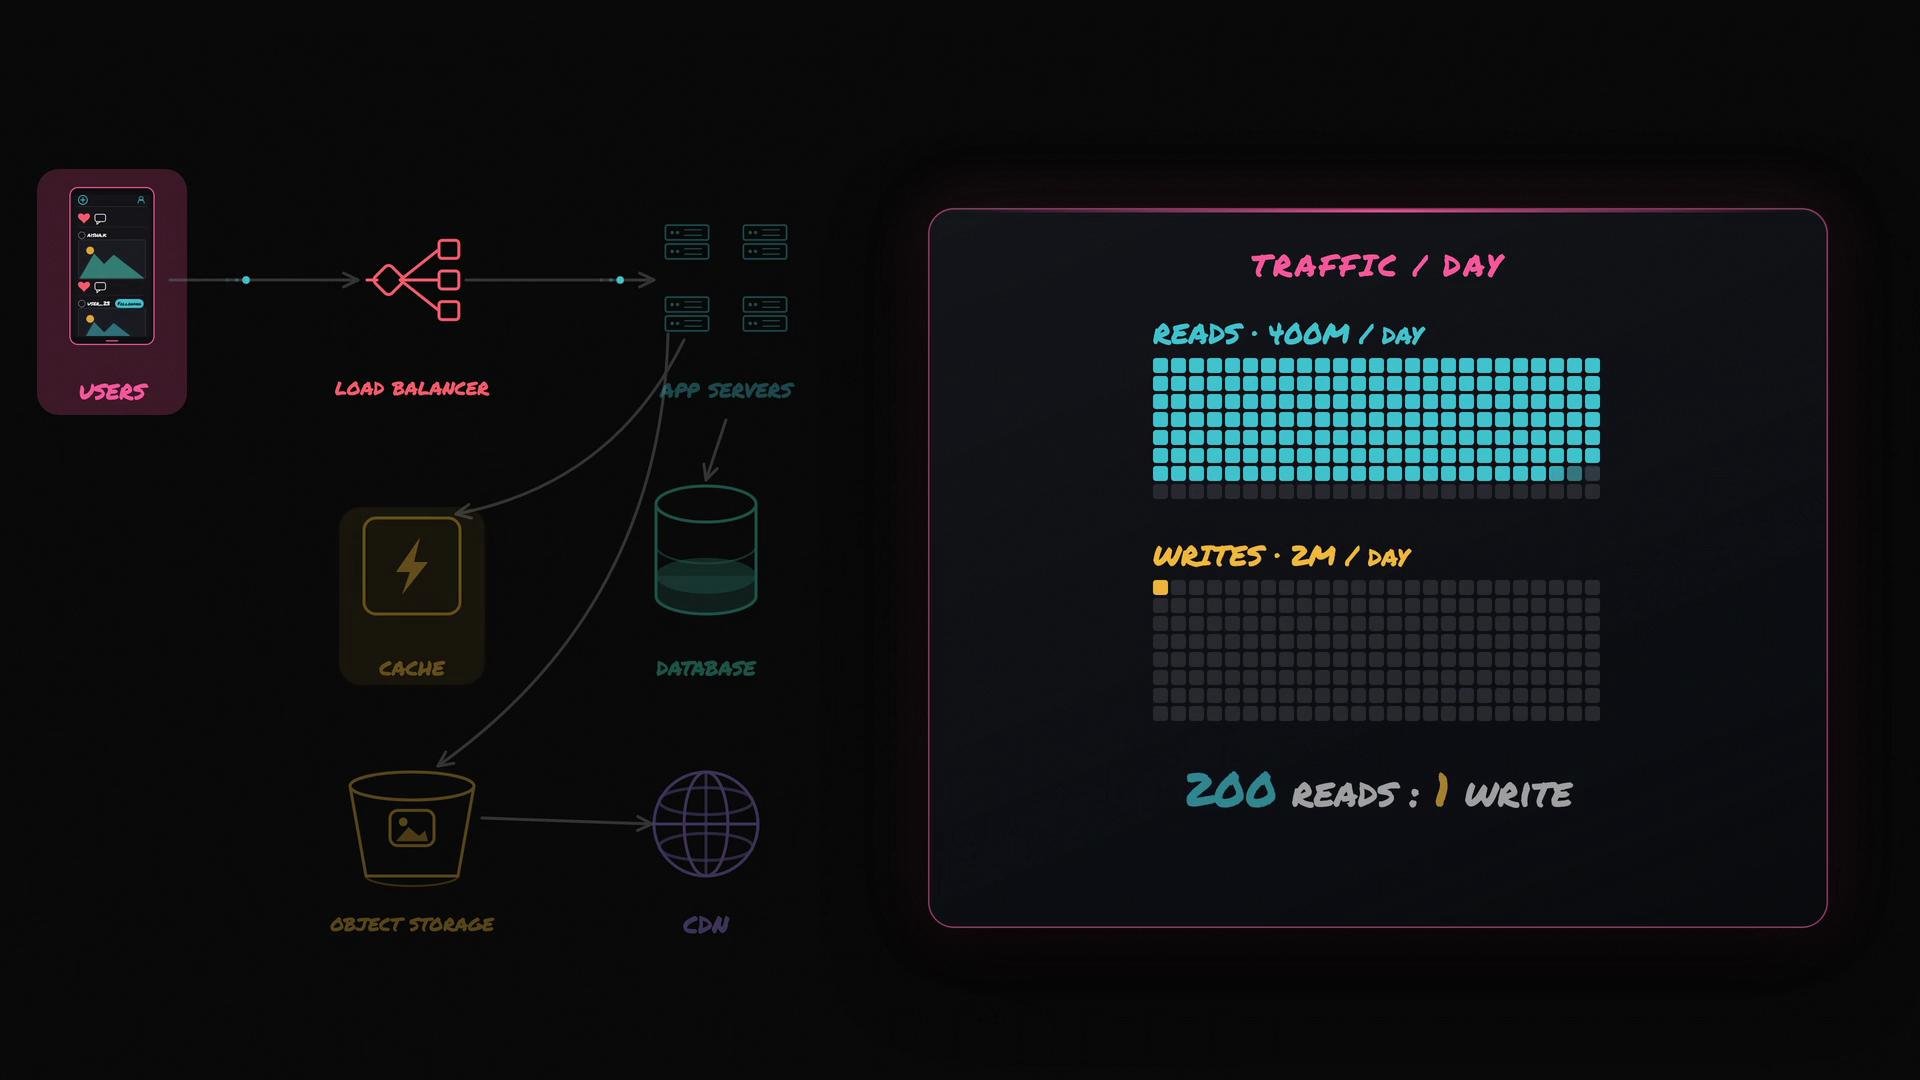
* Feed reads per day = 20,000,000 × 20 = 400,000,000 reads/day
* Uploads per day = 20,000,000 × 0.1 = 2,000,000 uploads/day
Reads therefore vastly outnumber writes (\~200:1), which immediately suggests using caches, read replicas, CDNs, and object storage.
 Convert daily numbers into per-second rates — server sizing is usually driven by requests-per-second (RPS).
A day has:
```text theme={null}
24 h × 60 m × 60 s = 86,400 s (≈ 100,000 s for easier rounding)
```
Per-second estimates (exact and rounded):
| Metric | Exact (per second) | Rounded (quick mental math) |
| ----------------- | -------------------------------: | --------------------------------: |
| Reads/day → r/s | 400,000,000 / 86,400 ≈ 4,630 r/s | 400,000,000 / 100,000 = 4,000 r/s |
| Uploads/day → u/s | 2,000,000 / 86,400 ≈ 23 u/s | 2,000,000 / 100,000 = 20 u/s |
Traffic is not uniform. Peak traffic (time-of-day effects, promotions, viral events) is typically 3–5× the daily average. Always design for peak, not average.
Using the rounded average of \~4,000 r/s:
* Peak (3–5×) ≈ 12,000–20,000 r/s
* For conservatism, use peak ≈ 15,000 r/s
Uploads:
* Average uploads/sec ≈ 23 u/s
* Peak uploads/sec (3–5×) ≈ 60–120 u/s
Uploads consume more resources per request: network bandwidth, storage writes, and CPU for image processing (resizing, thumbnails, transcoding).
Convert daily numbers into per-second rates — server sizing is usually driven by requests-per-second (RPS).
A day has:
```text theme={null}
24 h × 60 m × 60 s = 86,400 s (≈ 100,000 s for easier rounding)
```
Per-second estimates (exact and rounded):
| Metric | Exact (per second) | Rounded (quick mental math) |
| ----------------- | -------------------------------: | --------------------------------: |
| Reads/day → r/s | 400,000,000 / 86,400 ≈ 4,630 r/s | 400,000,000 / 100,000 = 4,000 r/s |
| Uploads/day → u/s | 2,000,000 / 86,400 ≈ 23 u/s | 2,000,000 / 100,000 = 20 u/s |
Traffic is not uniform. Peak traffic (time-of-day effects, promotions, viral events) is typically 3–5× the daily average. Always design for peak, not average.
Using the rounded average of \~4,000 r/s:
* Peak (3–5×) ≈ 12,000–20,000 r/s
* For conservatism, use peak ≈ 15,000 r/s
Uploads:
* Average uploads/sec ≈ 23 u/s
* Peak uploads/sec (3–5×) ≈ 60–120 u/s
Uploads consume more resources per request: network bandwidth, storage writes, and CPU for image processing (resizing, thumbnails, transcoding).
 Estimate storage needs.
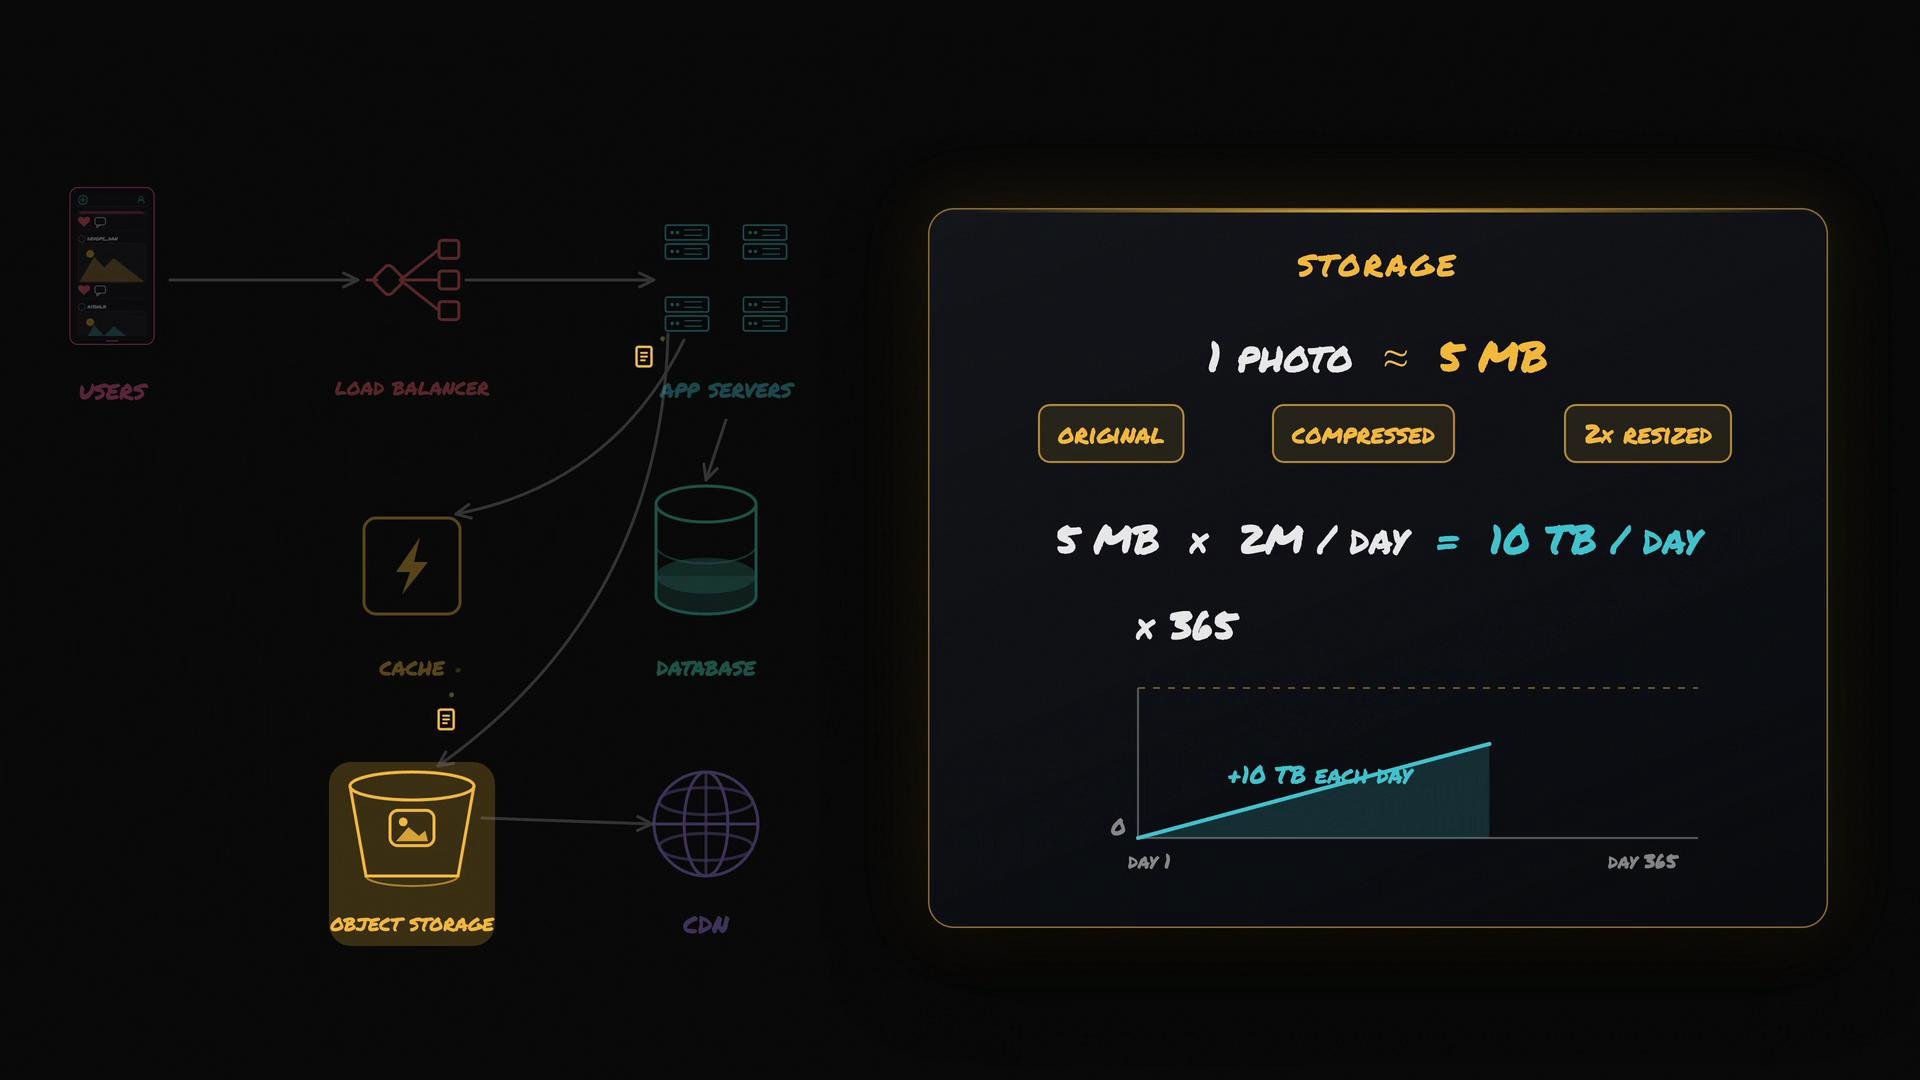
Assume each uploaded photo averages 5 MB when you count original + compressed + resized versions. Then:
* Daily object data ingested = 2,000,000 × 5 MB = 10,000,000 MB = 10,000 GB = 10 TB/day
* Annual growth ≈ 10 TB/day × 365 ≈ 3,650 TB ≈ 3.65 PB/year
This confirms two important design decisions:
* Store image binaries in a cheap, scalable object store (S3, GCS, Azure Blob), not in the primary relational database.
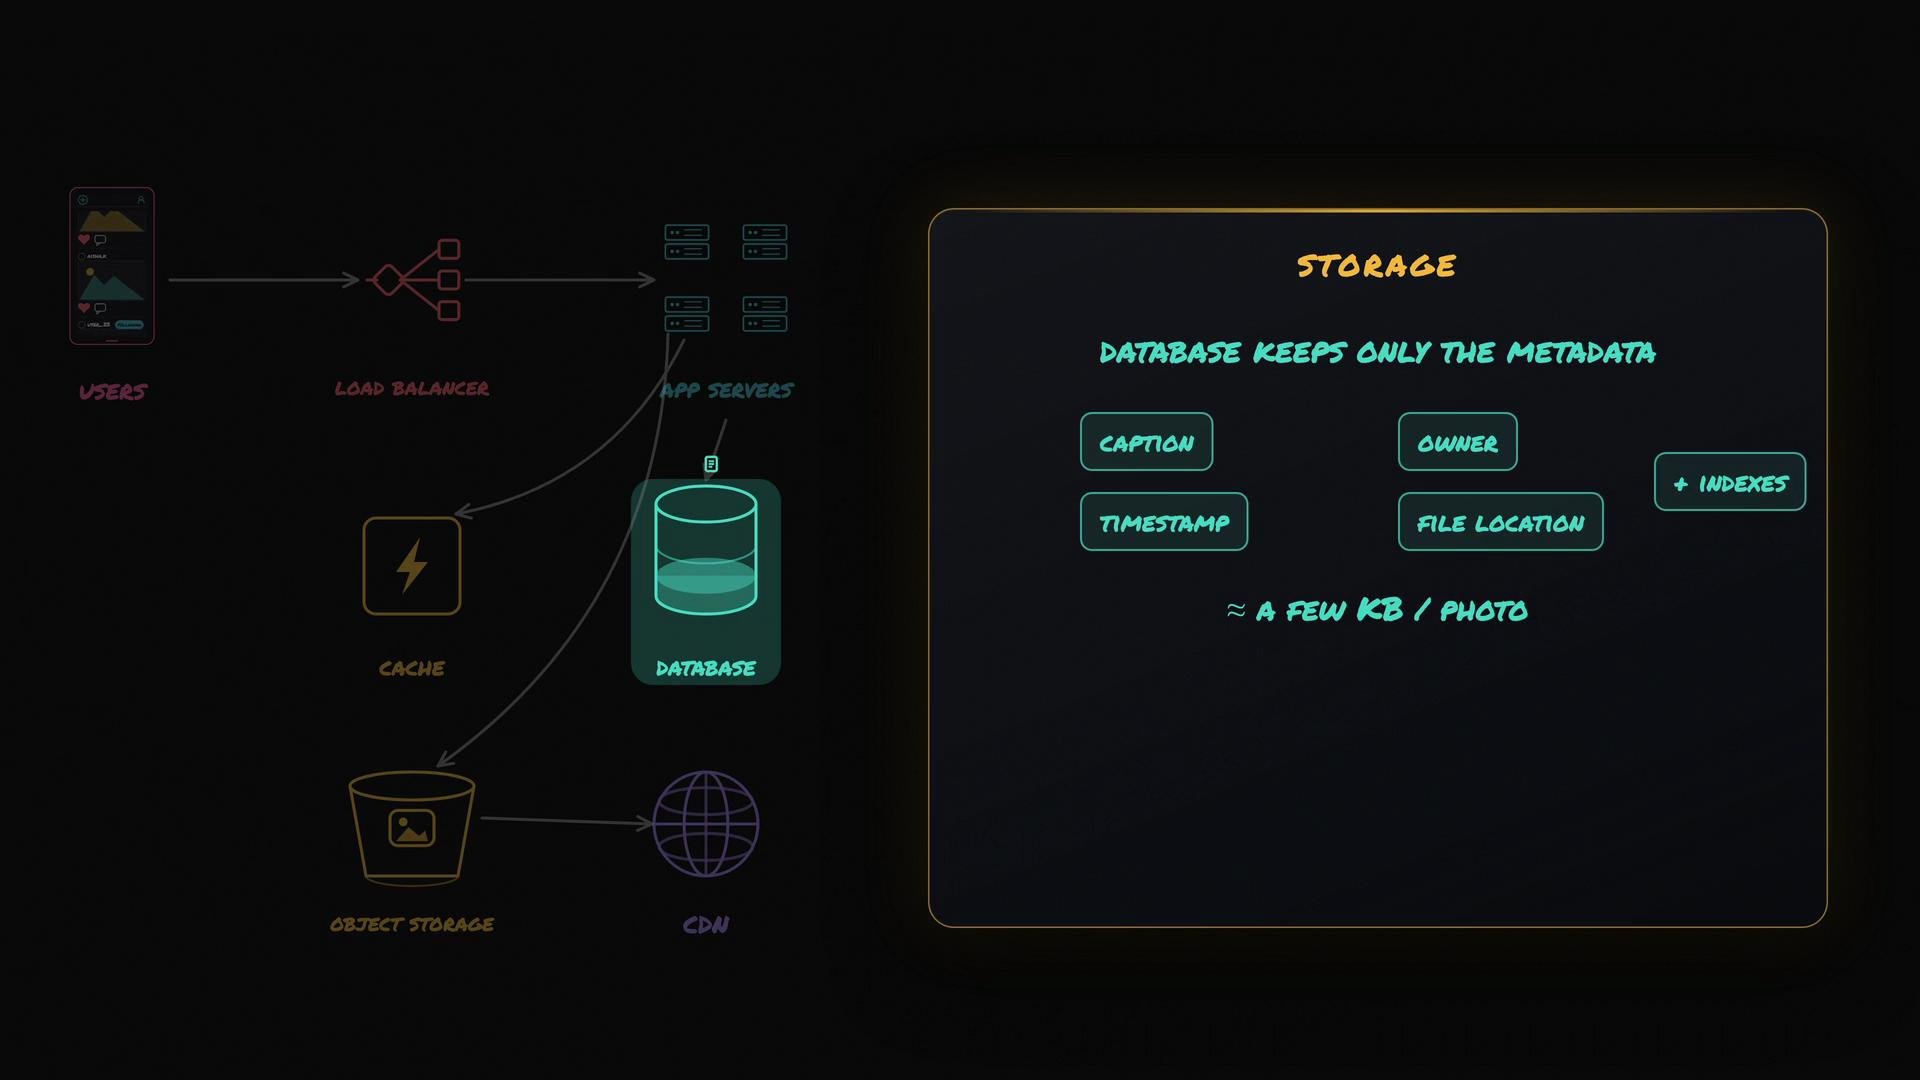
* Keep only metadata (caption, owner, timestamps, storage location, indexes) in the DB — a few KB per photo.
Estimate storage needs.
Assume each uploaded photo averages 5 MB when you count original + compressed + resized versions. Then:
* Daily object data ingested = 2,000,000 × 5 MB = 10,000,000 MB = 10,000 GB = 10 TB/day
* Annual growth ≈ 10 TB/day × 365 ≈ 3,650 TB ≈ 3.65 PB/year
This confirms two important design decisions:
* Store image binaries in a cheap, scalable object store (S3, GCS, Azure Blob), not in the primary relational database.
* Keep only metadata (caption, owner, timestamps, storage location, indexes) in the DB — a few KB per photo.
 Separate storage of binaries and metadata
 Component sizing — simple assumptions and results
Assume:
* One app server can handle \~500 feed reads/sec (when reads hit cache or are efficiently served).
* Peak reads to serve = 15,000 r/s
Compute servers required:
* App servers = 15,000 / 500 = 30
* Add headroom and redundancy → plan for ≈ 40 app servers
Other sizing and considerations:
| Component | Sizing/Need | Notes |
| ----------------------- | ---------------------------------- | ------------------------------------------------------------- |
| App servers | \~30–40 (based on 500 r/s each) | Add autoscaling, redundancy across AZs/regions |
| Object storage | \~10 TB/day → \~3.65 PB/year | Use lifecycle policies (e.g., archive older images) |
| CDN | Essential | Offload repeated downloads; reduces origin egress and latency |
| Cache (Redis/Memcached) | Required | Reduce hits to DB and object store for feeds |
| Read replicas | Required | Scale reads on relational DB for metadata |
| Image processing | Worker pool scaled to peak uploads | Consider asynchronous processing and queues |
Component sizing — simple assumptions and results
Assume:
* One app server can handle \~500 feed reads/sec (when reads hit cache or are efficiently served).
* Peak reads to serve = 15,000 r/s
Compute servers required:
* App servers = 15,000 / 500 = 30
* Add headroom and redundancy → plan for ≈ 40 app servers
Other sizing and considerations:
| Component | Sizing/Need | Notes |
| ----------------------- | ---------------------------------- | ------------------------------------------------------------- |
| App servers | \~30–40 (based on 500 r/s each) | Add autoscaling, redundancy across AZs/regions |
| Object storage | \~10 TB/day → \~3.65 PB/year | Use lifecycle policies (e.g., archive older images) |
| CDN | Essential | Offload repeated downloads; reduces origin egress and latency |
| Cache (Redis/Memcached) | Required | Reduce hits to DB and object store for feeds |
| Read replicas | Required | Scale reads on relational DB for metadata |
| Image processing | Worker pool scaled to peak uploads | Consider asynchronous processing and queues |
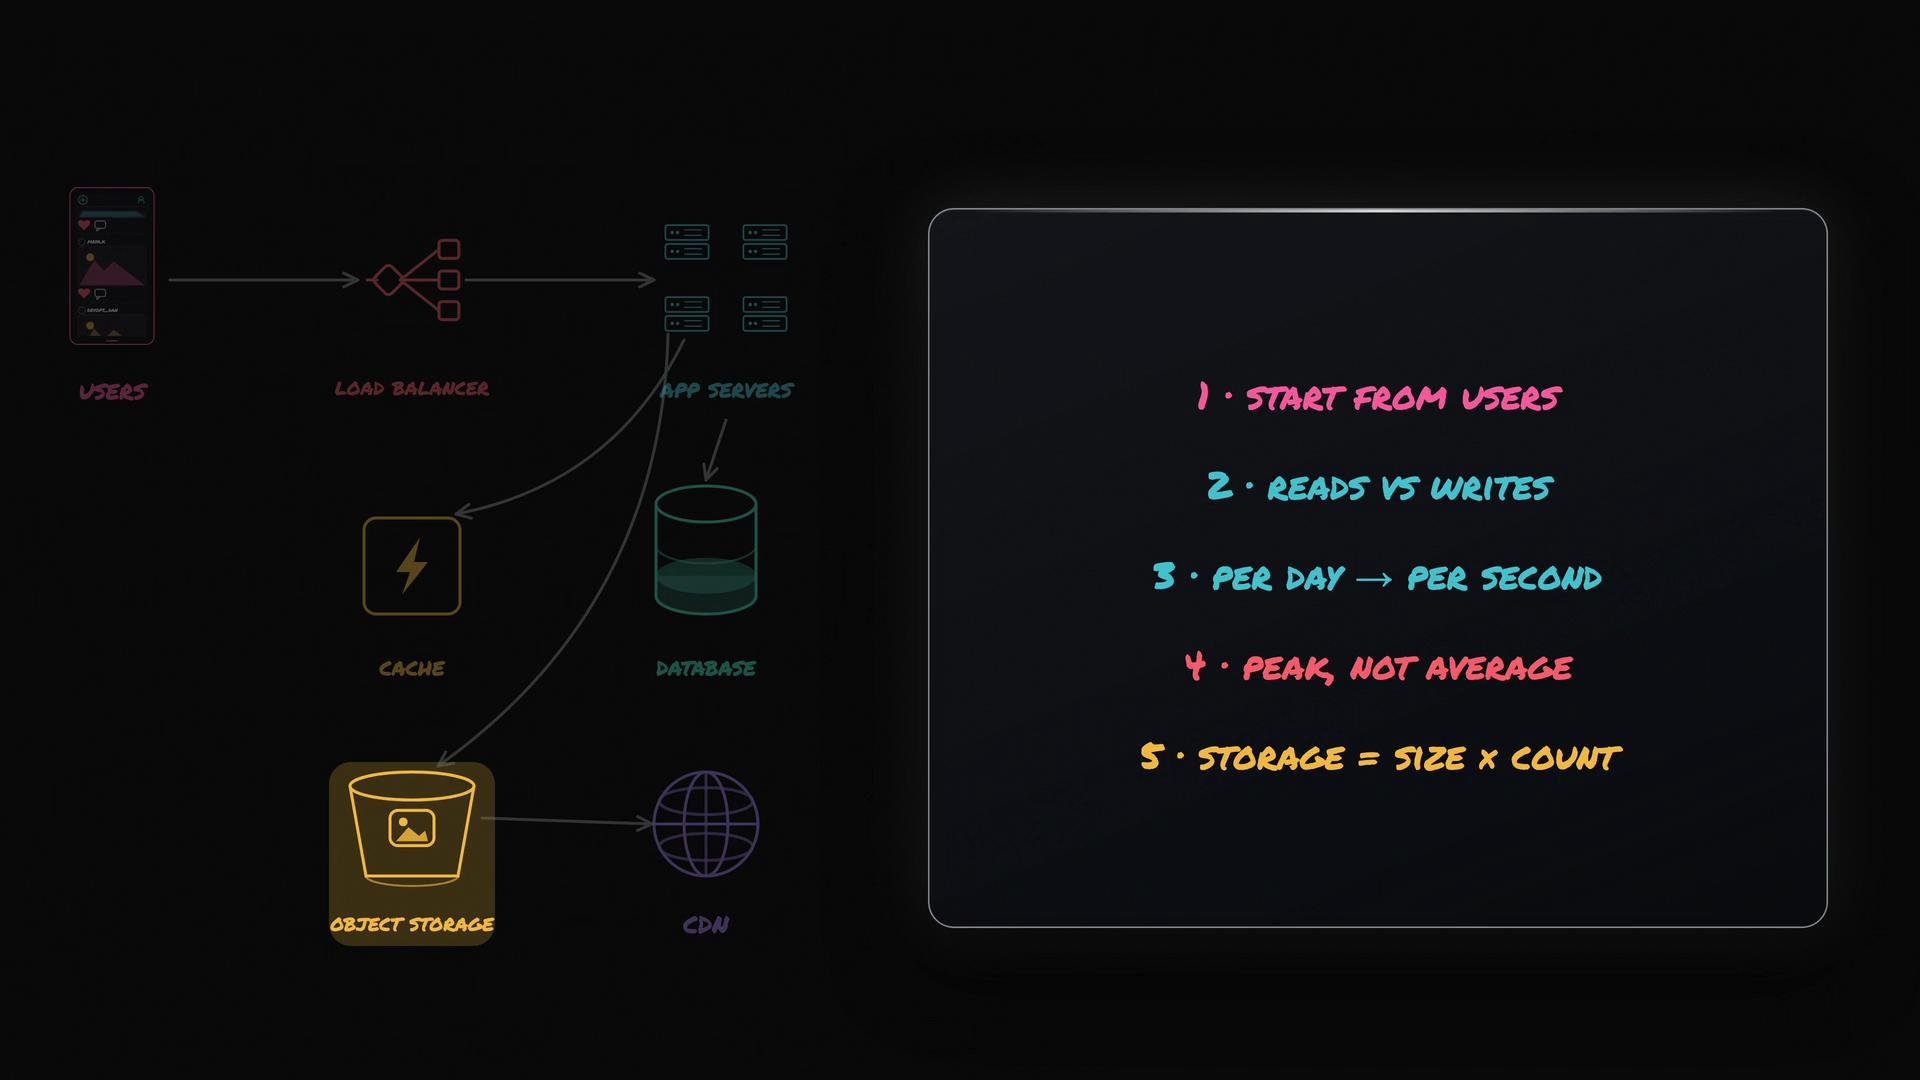 Checklist: How to approach any back-of-envelope sizing question
1. Start from user counts and activity assumptions (DAU, opens/day, posts/day).
2. Separate reads from writes and compute daily totals.
3. Convert daily totals to per-second averages and then estimate peak (typically 3–5×).
4. Size compute by dividing peak RPS by throughput per server and add redundancy.
5. Size storage by item size × items/day × retention window.
6. Use caches, CDNs, read replicas, and object storage where appropriate — these are often required to meet performance and cost goals.
7. State assumptions and round aggressively in interview settings. Discuss trade-offs and system bottlenecks.
Useful references
* [Kubernetes Basics](https://kubernetes.io/docs/concepts/overview/what-is-kubernetes/)
* [Amazon S3 (object storage)](https://aws.amazon.com/s3/)
* [Content Delivery Networks (CDN) overview](https://en.wikipedia.org/wiki/Content_delivery_network)
Round numbers and state your assumptions clearly. Interviewers are evaluating your approach and trade-offs more than any single exact number.
Checklist: How to approach any back-of-envelope sizing question
1. Start from user counts and activity assumptions (DAU, opens/day, posts/day).
2. Separate reads from writes and compute daily totals.
3. Convert daily totals to per-second averages and then estimate peak (typically 3–5×).
4. Size compute by dividing peak RPS by throughput per server and add redundancy.
5. Size storage by item size × items/day × retention window.
6. Use caches, CDNs, read replicas, and object storage where appropriate — these are often required to meet performance and cost goals.
7. State assumptions and round aggressively in interview settings. Discuss trade-offs and system bottlenecks.
Useful references
* [Kubernetes Basics](https://kubernetes.io/docs/concepts/overview/what-is-kubernetes/)
* [Amazon S3 (object storage)](https://aws.amazon.com/s3/)
* [Content Delivery Networks (CDN) overview](https://en.wikipedia.org/wiki/Content_delivery_network)
Round numbers and state your assumptions clearly. Interviewers are evaluating your approach and trade-offs more than any single exact number.