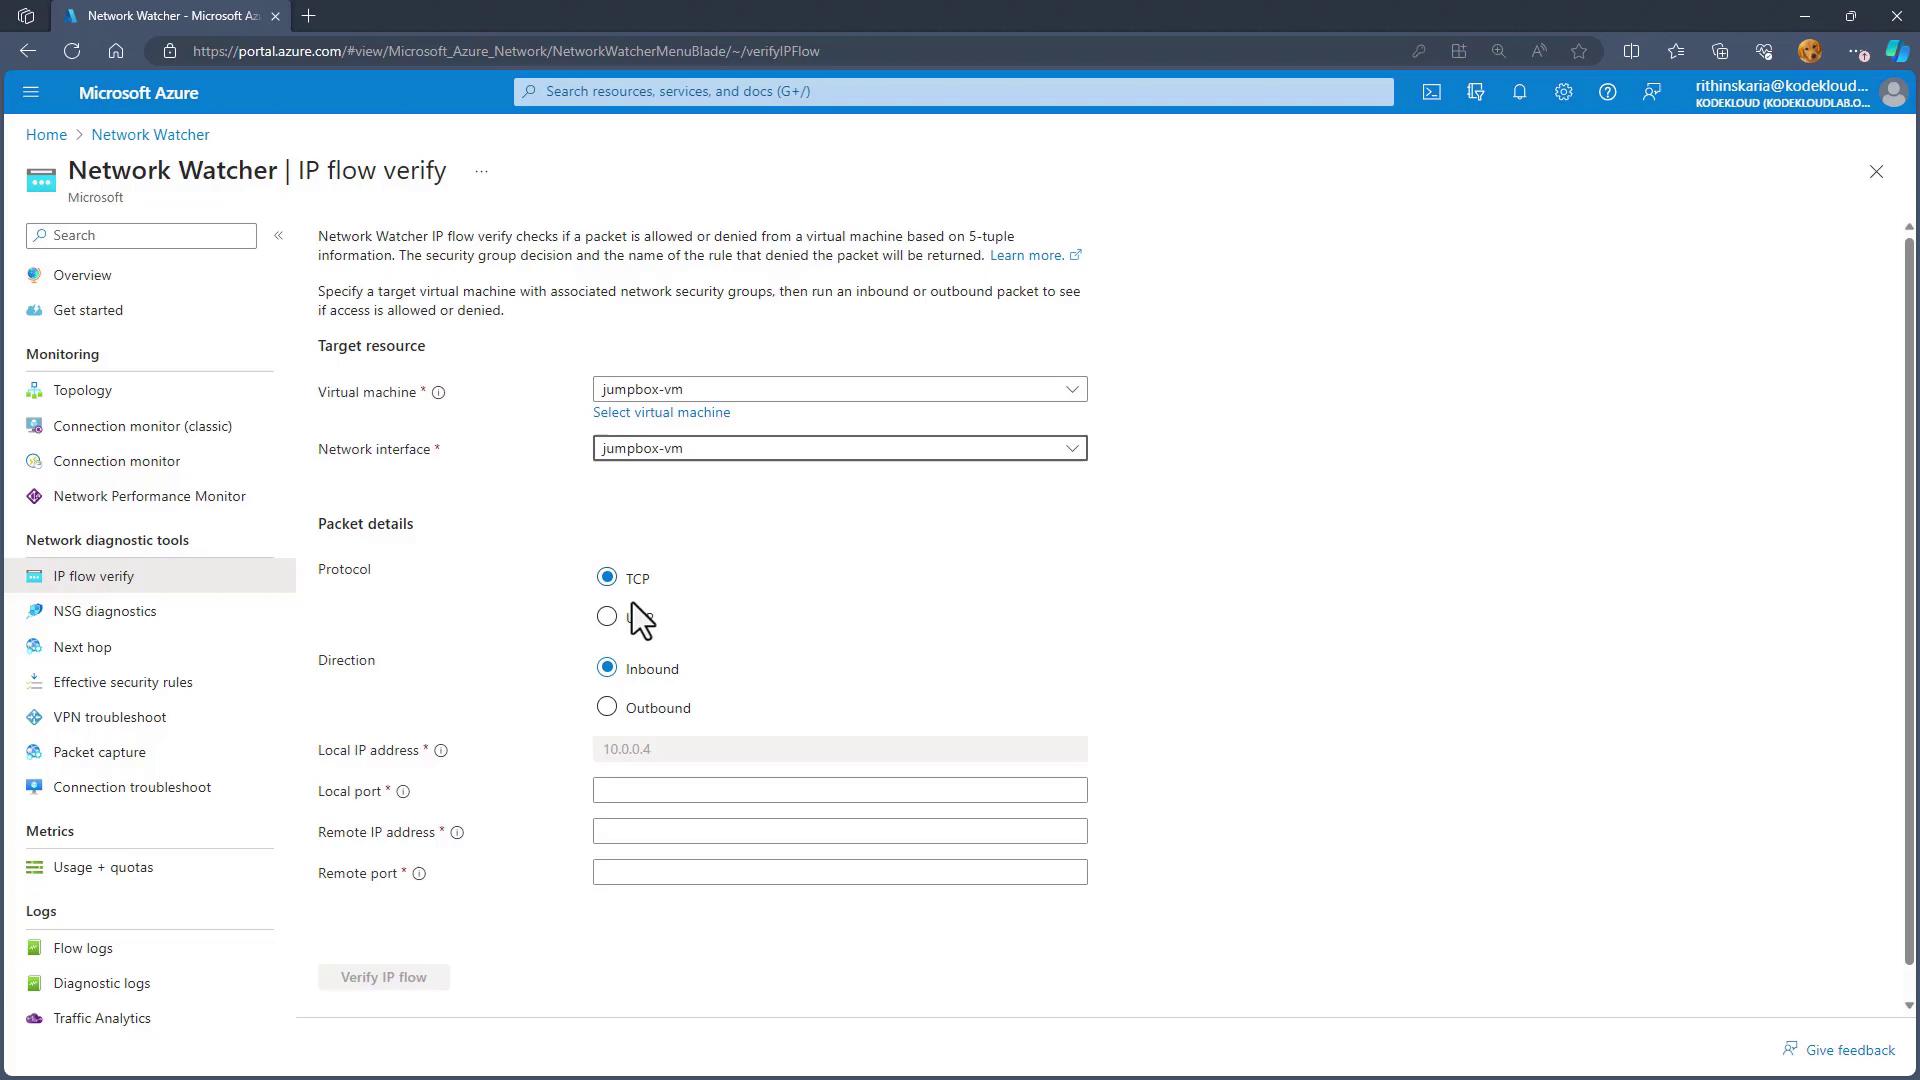
- IP Flow Verify IP Flow Verify determines if a packet is allowed or denied based on the current Network Security Group (NSG) rules. It is especially useful when you suspect that a particular port is being blocked. For example, you can simulate traffic to confirm whether the NSG is inadvertently preventing connectivity.
- Next Hop The Next Hop tool helps you trace the path a packet takes within your Azure Virtual Network. This is beneficial when troubleshooting routing issues. If you have configured a route table to forward traffic to a firewall but cannot see the traffic at the firewall, Next Hop can reveal whether the traffic is correctly directed.
- VPN Diagnostics VPN Diagnostics enables you to assess the health of your VPN Gateways and connections, ensuring that secure connectivity to your on-premises infrastructure is maintained. Diagnostic data is stored in a designated storage account, which can be reviewed later to troubleshoot connectivity problems.
- NSG Flow Logs NSG Flow Logs capture detailed information about ingress and egress IP traffic as it flows through your NSGs. These logs are crucial for auditing and analyzing network security policies. Once the logs are collected, they are stored in a storage account for further analysis.
- Connection Troubleshoot Connection Troubleshoot provides insights into the connectivity between two endpoints. It displays information like travel time, intermediate hops, and any issues that may be blocking the connection, thus simplifying the troubleshooting process.
- Topology The Topology feature offers a visual map of the components within your Virtual Network. It displays the arrangement of resources such as virtual machines, subnets, and network interfaces, helping you understand the overall architectural layout of your solution.
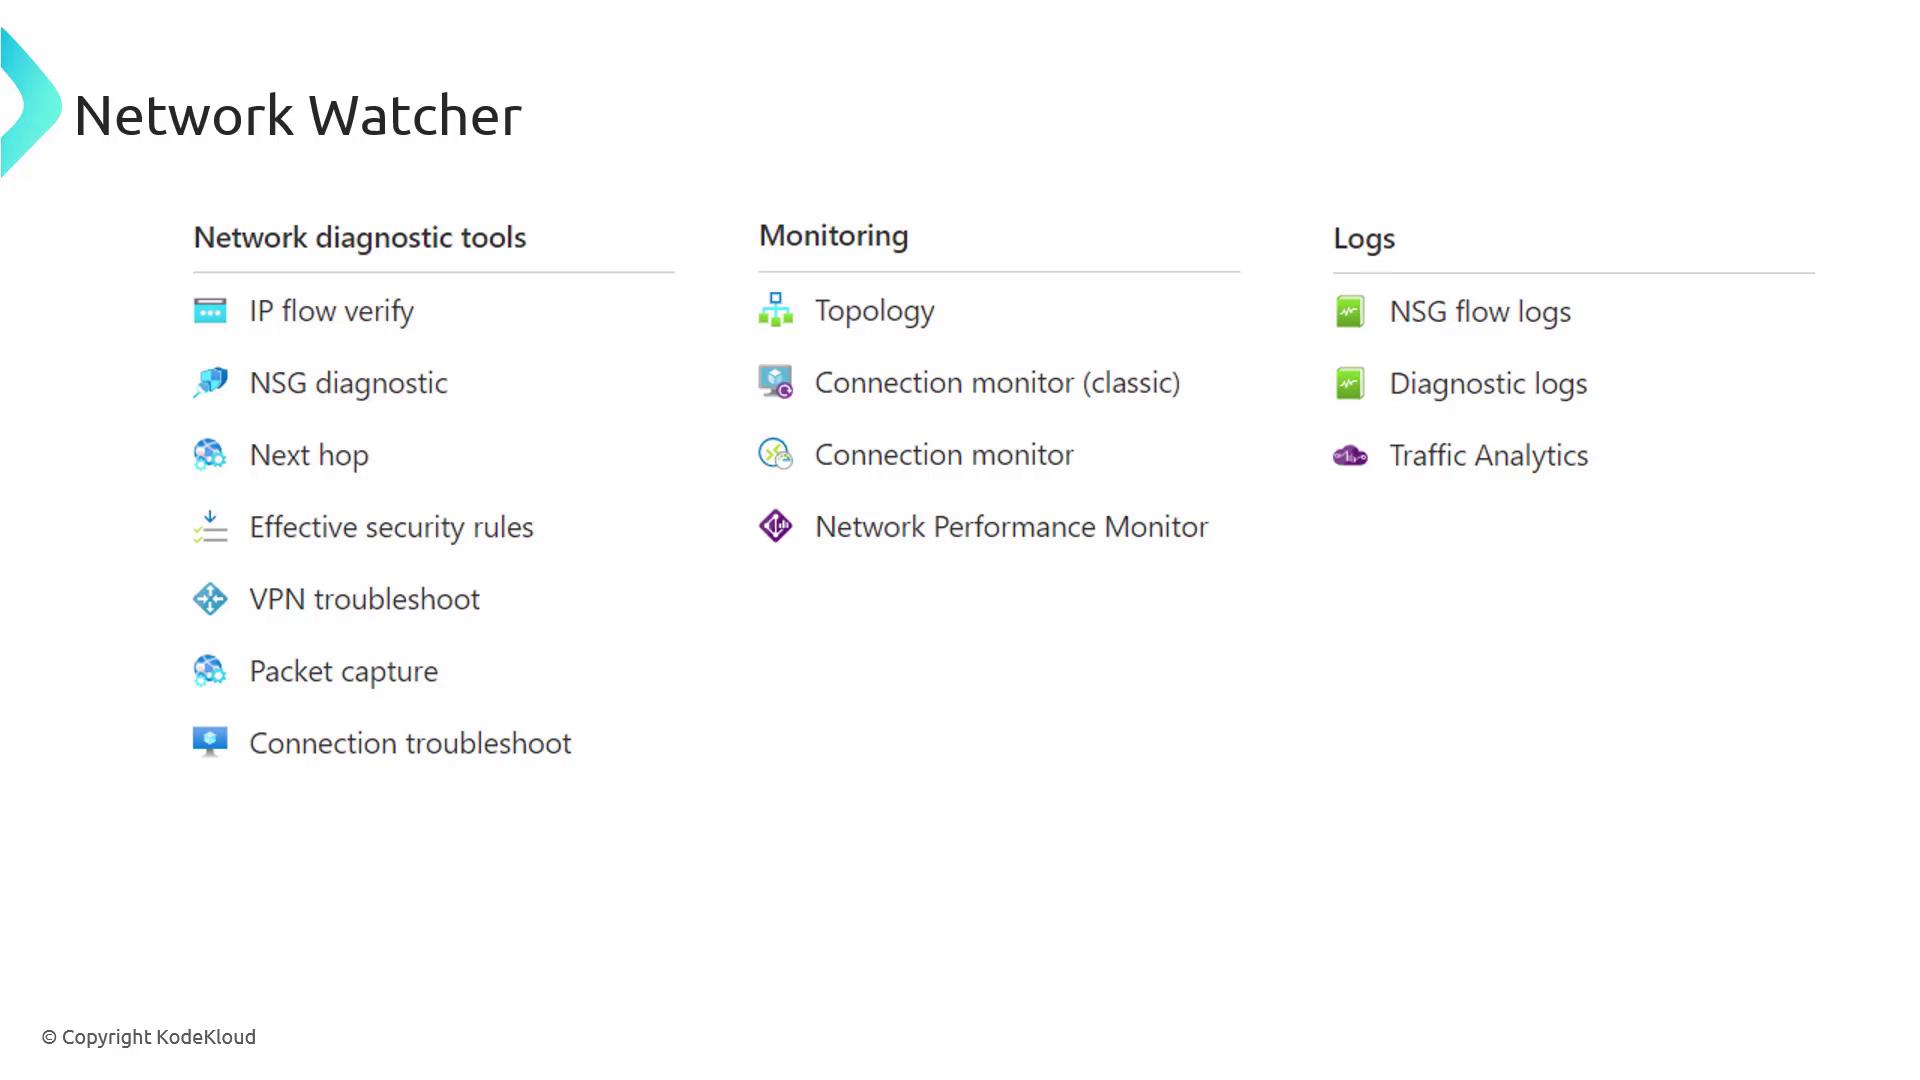
Each tool within Network Watcher plays a vital role in ensuring clear visibility into your network’s operation and security. This guide will walk you through how each feature functions within the Azure Portal.
Exploring Network Watcher in the Azure Portal
To get started, log into the Azure Portal and search for “Network Watcher.” Once you access the service, you’ll see a list of available tools to diagnose and monitor your network.IP Flow Verify
To diagnose traffic connectivity issues for a virtual machine:- Navigate to IP Flow Verify.
- Select a virtual machine (e.g., the Gembox VM) and choose its network interface.
- Set the protocol to TCP and the direction to inbound.
- Specify the local IP address and port (for example, local port 3389) and then provide the remote IP address along with its corresponding port (e.g., 3389).
NSG Diagnostics
NSG Diagnostics collects logs from your NSGs and sends them to a storage account for further analysis. These logs help you review traffic patterns and evaluate the impact of your security rules.Next Hop
The Next Hop tool determines the subsequent route for network packets. For instance, if two virtual machines within the same Virtual Network are involved, the expected next hop is typically “vnet local.” The test will indicate if the system’s default route or a user-defined route (UDR) is in effect. If an external internet destination is involved or a virtual appliance with a UDR is used, the tool will display “internet” or “virtual appliance” along with the corresponding IP address and details.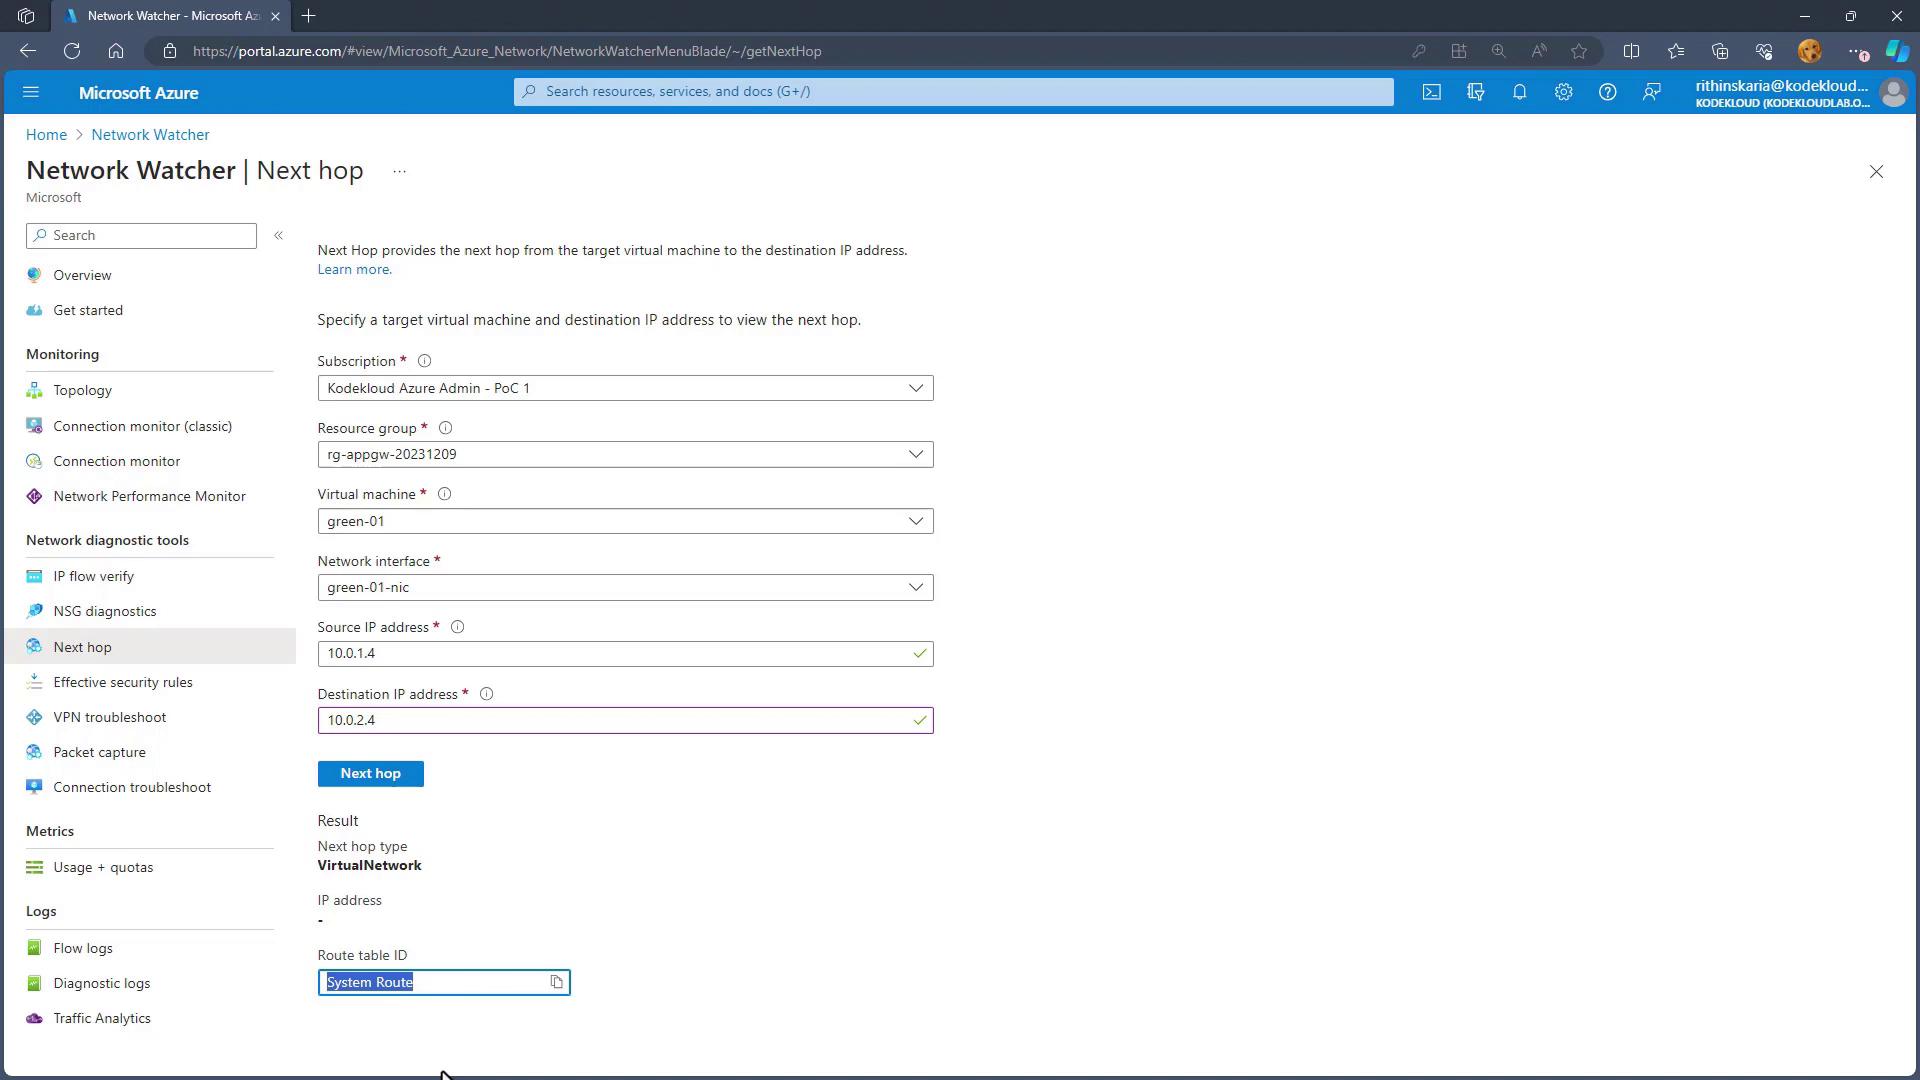
Effective Security Rules
This feature aggregates and displays all effective NSG rules when multiple NSGs are applied (such as at both the subnet and network interface levels). It consolidates these rules, allowing you to easily understand the overall security posture impacting your resources.VPN Troubleshoot
VPN Troubleshoot allows you to diagnose issues with your VPN Gateway and its connections. By selecting an appropriate storage account, you can capture diagnostic metrics like bandwidth and throughput, which help identify potential issues such as packet drops.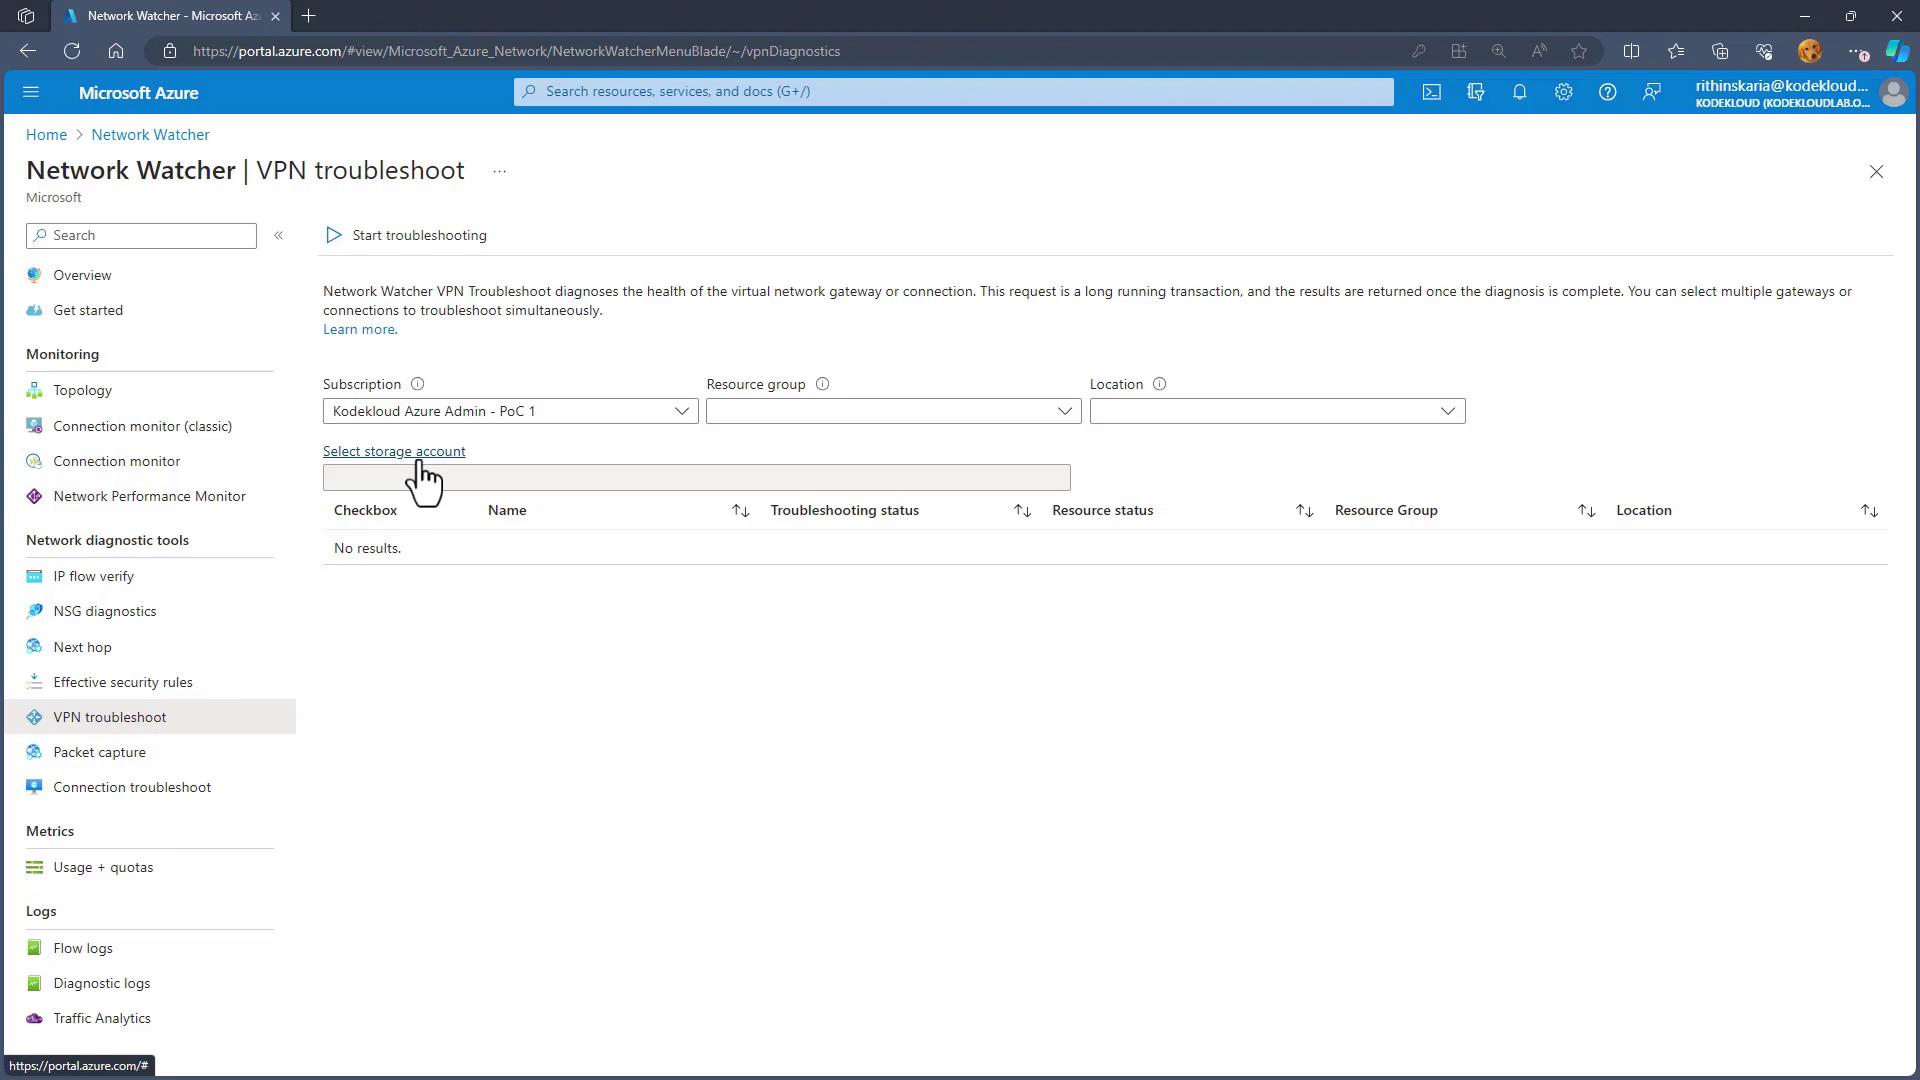
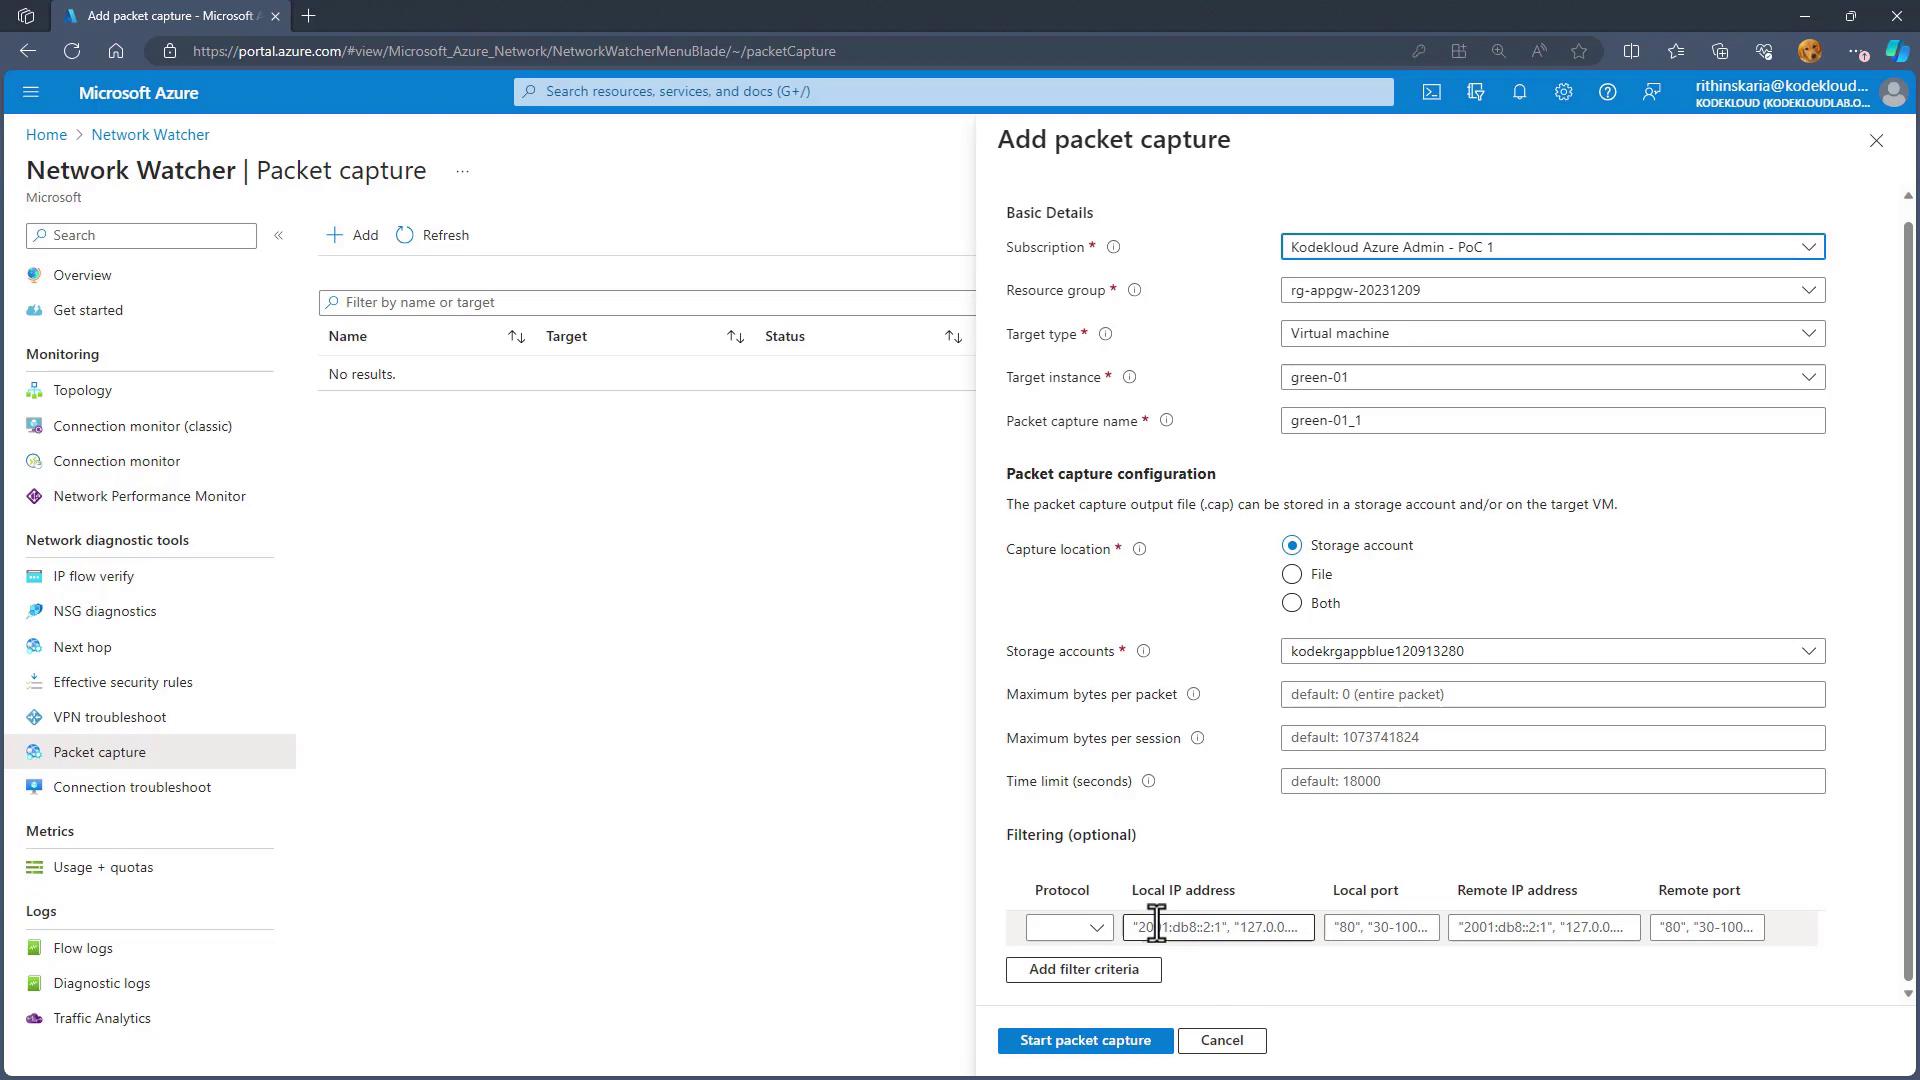
Packet Capture
Packet Capture eliminates the need to install separate tools like Wireshark or TCPdump on your virtual machine. Instead, you can initiate a packet capture session directly from the Azure Portal by:- Selecting the target virtual machine.
- Specifying the storage account for saving the capture file.
- Applying filters, such as capturing traffic on a specific port (e.g., port 53).
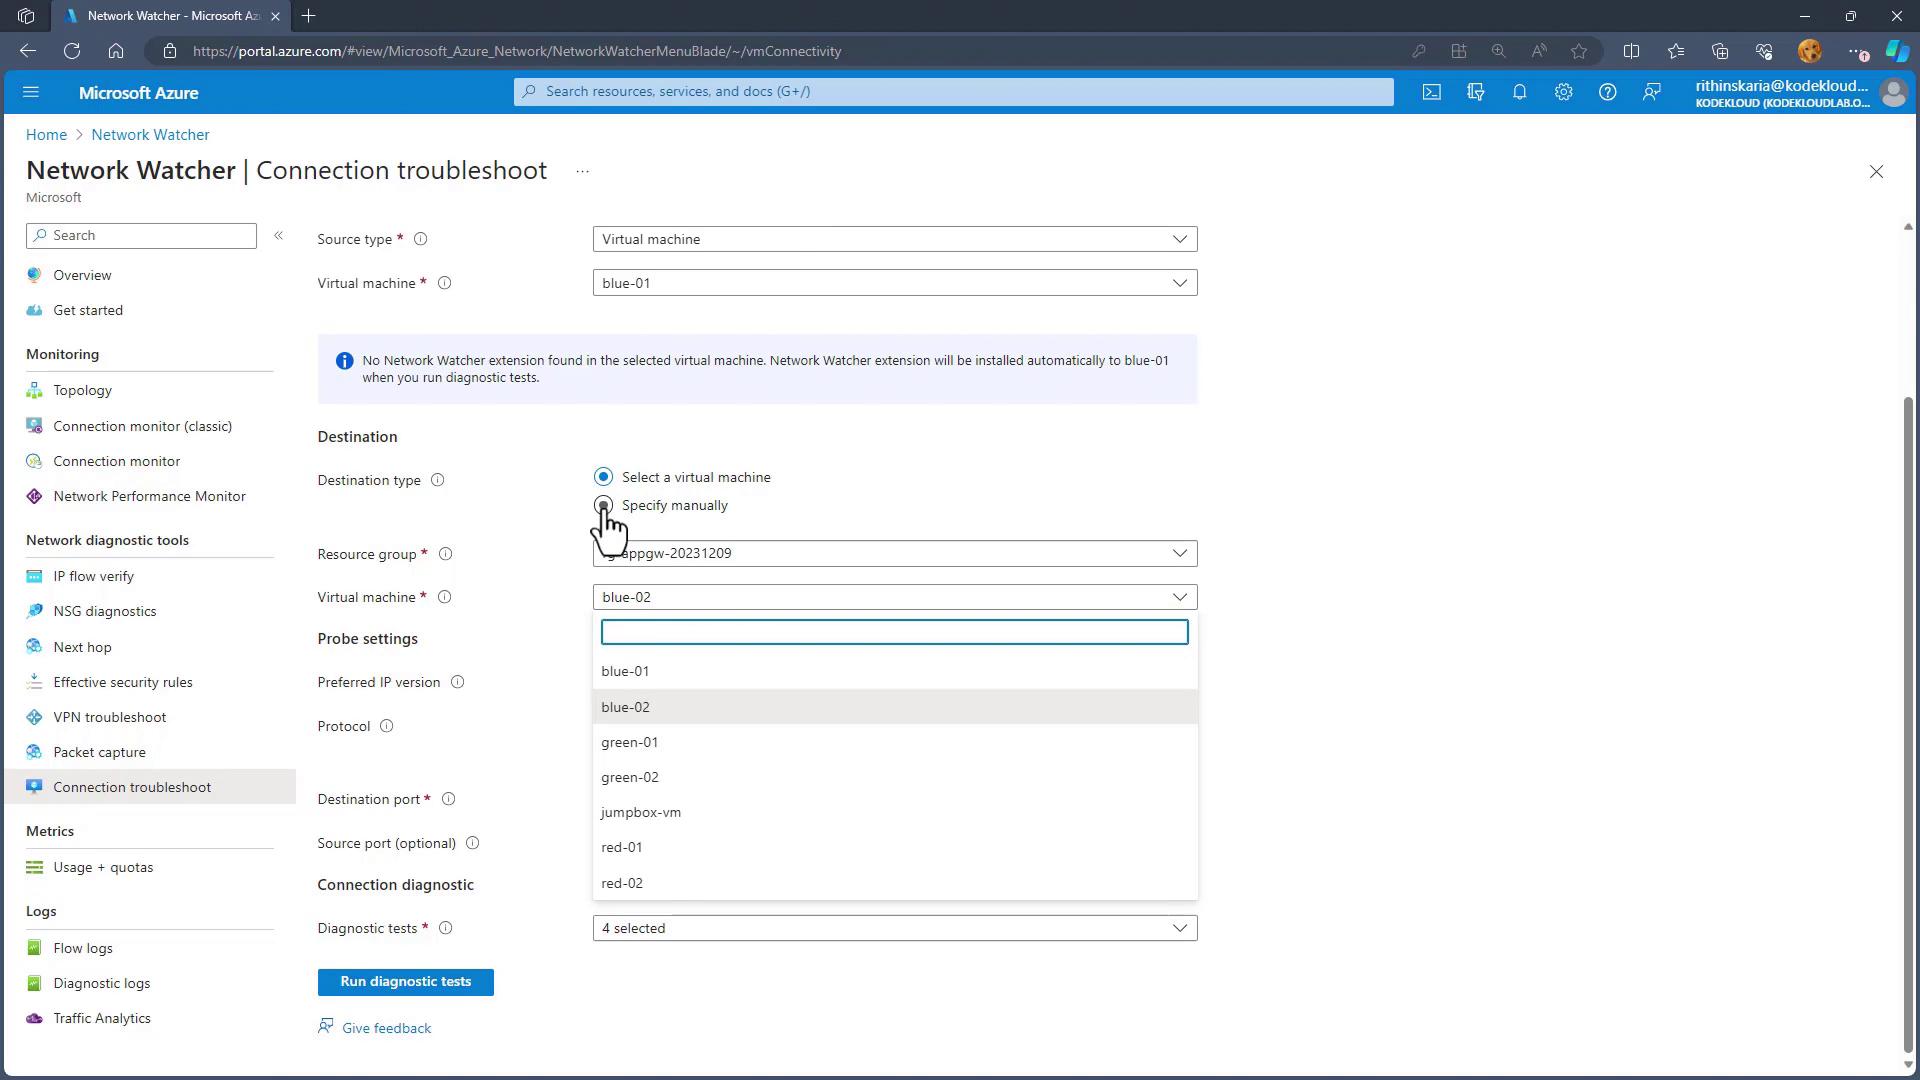
Connection Troubleshoot
Connection Troubleshoot helps verify connectivity between two endpoints. For example, to test connectivity between the Gembox VM and another virtual machine (e.g., a blue VM):- Choose IPv4.
- Select the desired protocol (such as TCP) and specify the destination port (e.g., 22).
- Run the diagnostic test to collect data on next hop details, round trip times, effective NSG rules, and port accessibility.
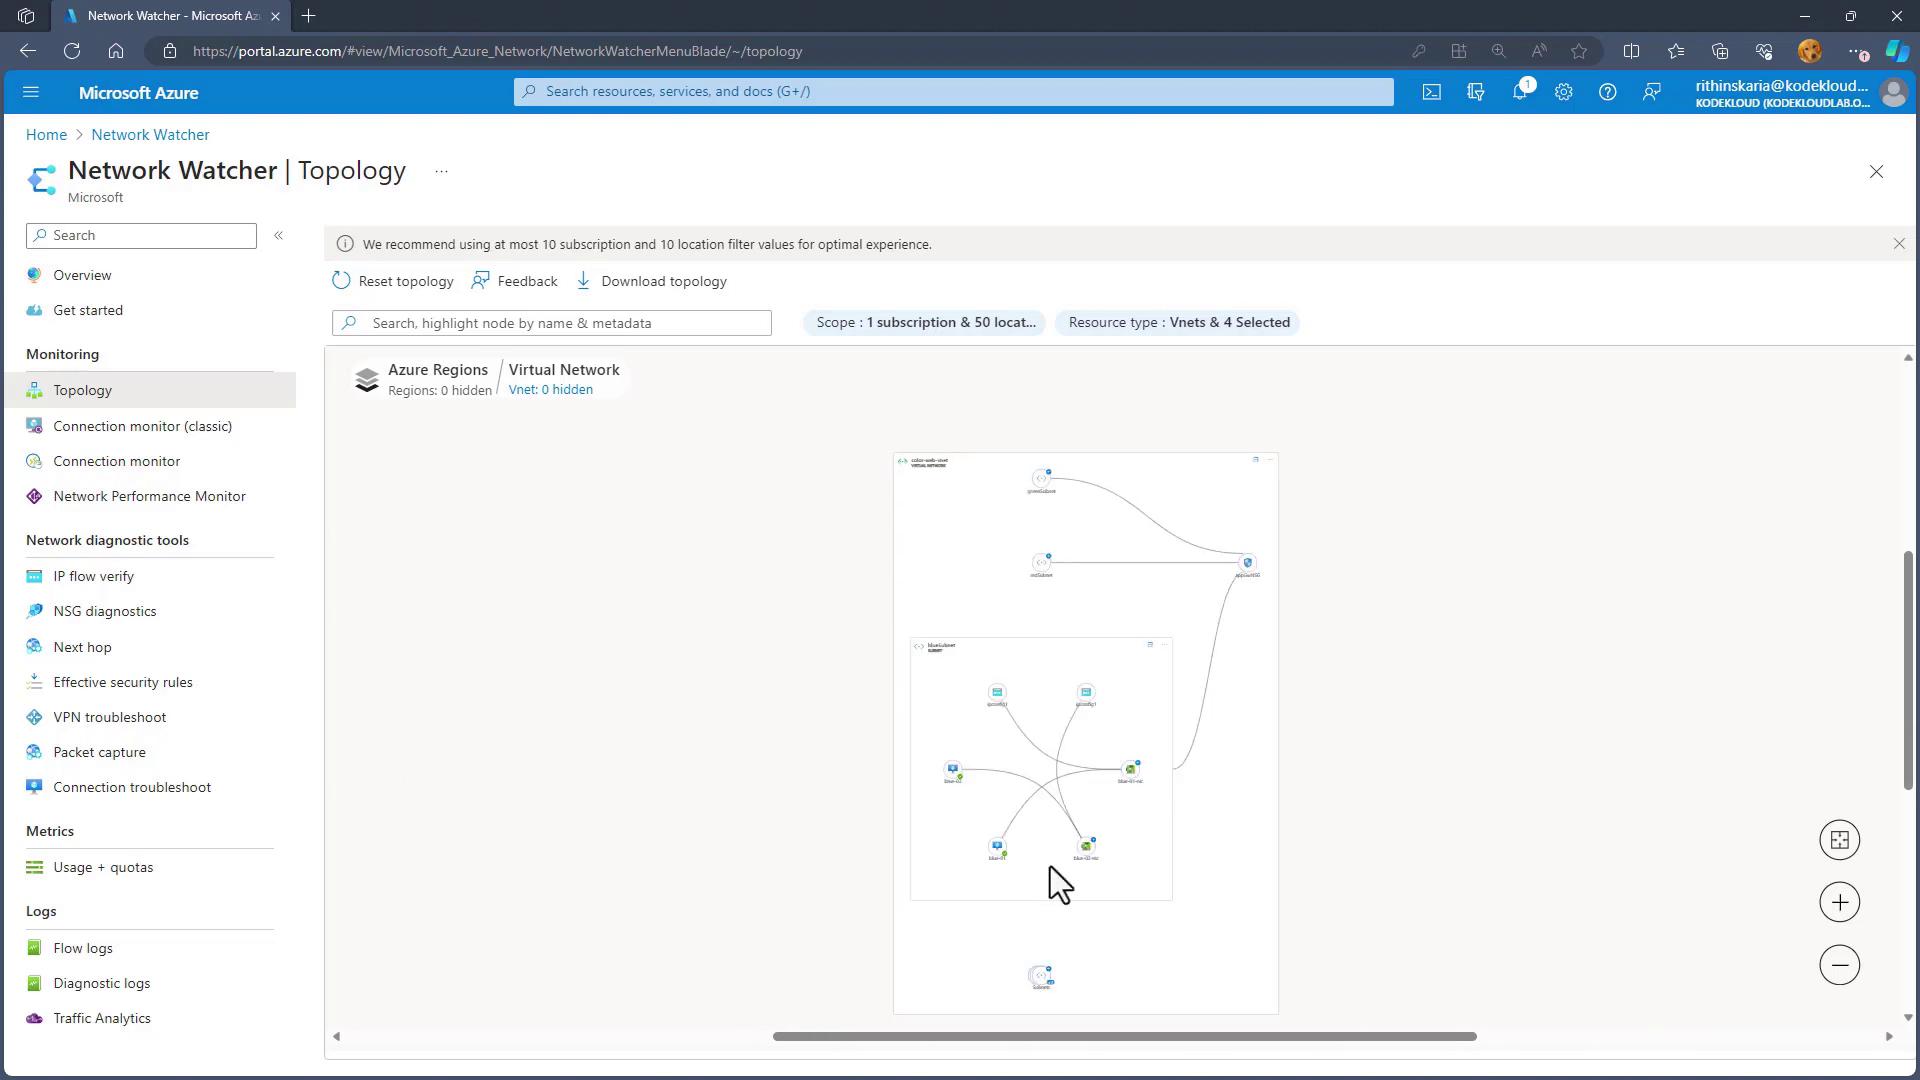
Topology
The Topology tool provides a visual layout of your Virtual Network. By selecting a particular virtual network, you can view its topology, which includes resources such as virtual machines, network interfaces, and subnets. For example, you might see a diagram displaying components such as a gateway NSG, blue subnet, and red subnet. Expanding a subnet (like the blue subnet) allows you to view the underlying resources, including each virtual machine and its associated network interface.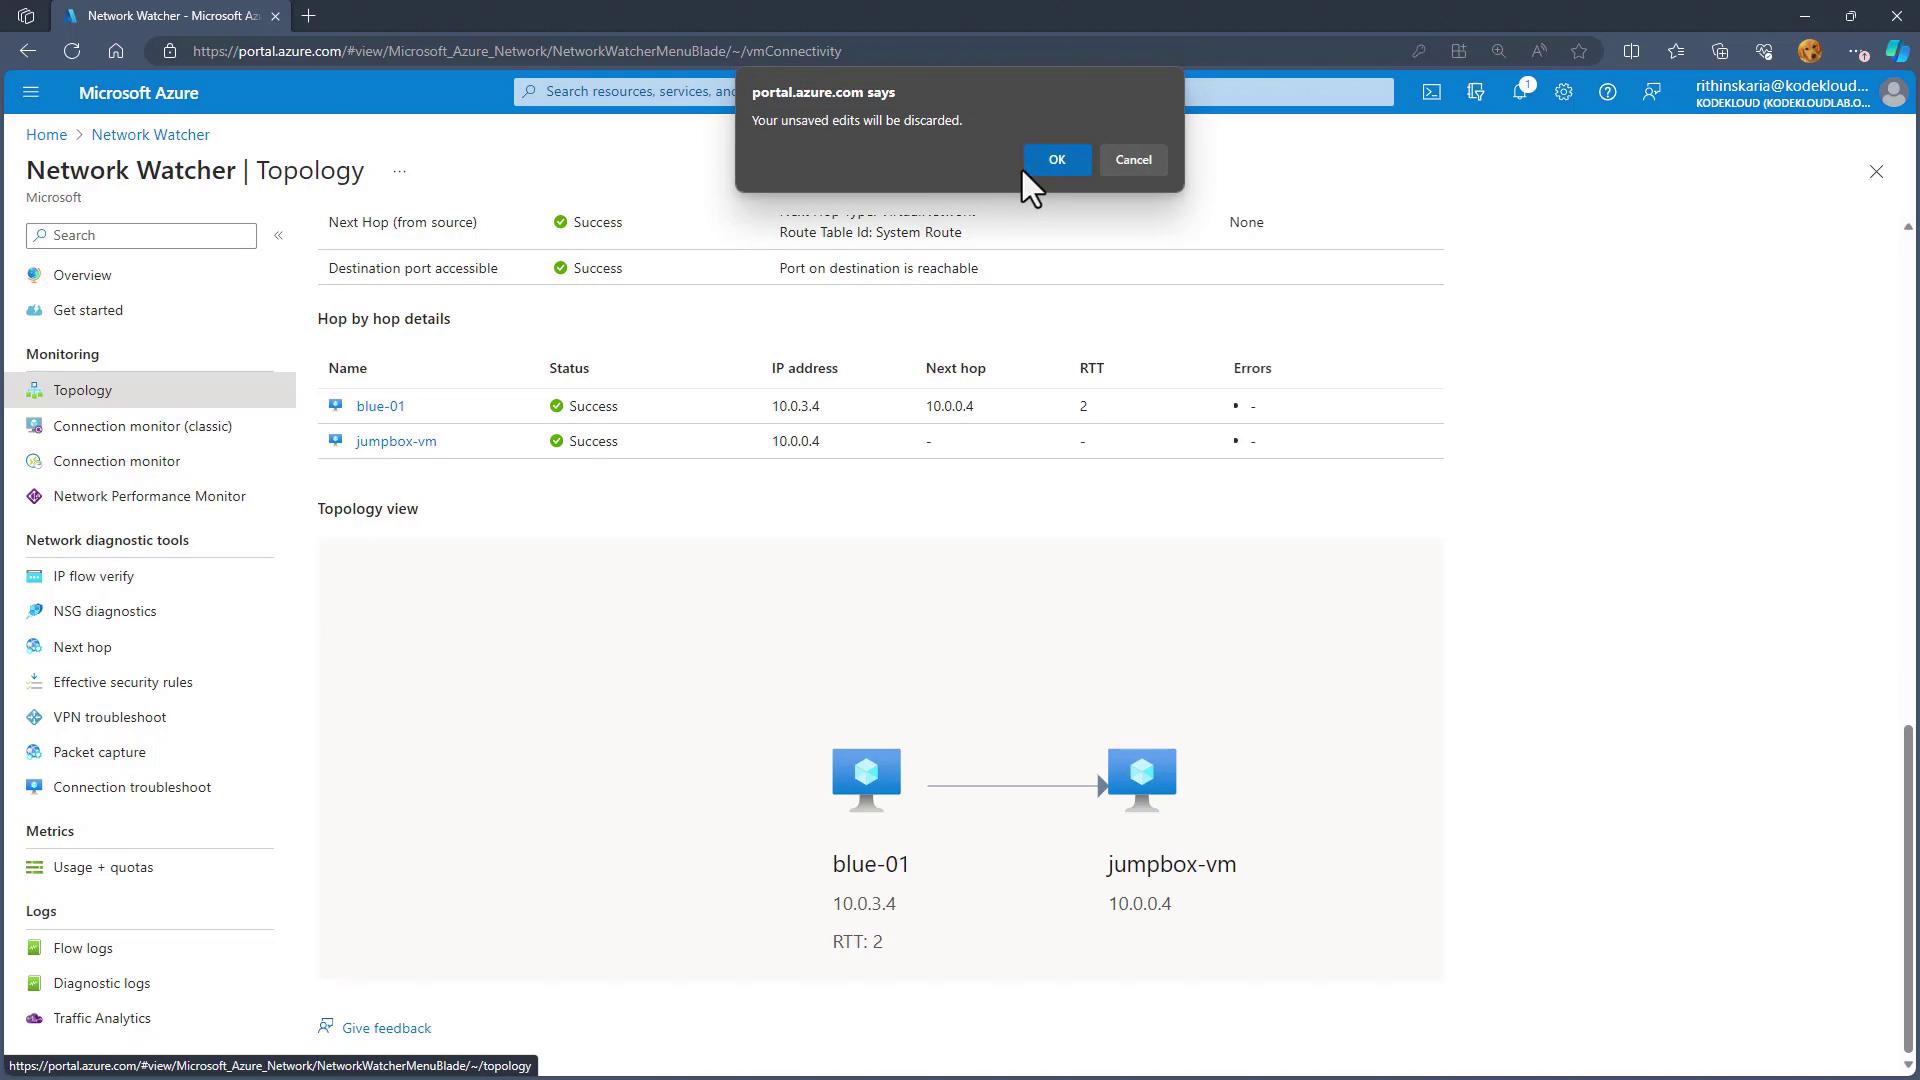
That concludes our in-depth overview of Azure Network Watcher. With these powerful tools at your disposal, managing and troubleshooting your Azure network has never been easier.
In the next section, we will dive into best practices for administering Azure Storage. Stay tuned to expand your Azure knowledge!