> ## Documentation Index
> Fetch the complete documentation index at: https://notes.kodekloud.com/llms.txt
> Use this file to discover all available pages before exploring further.
# Demo Query a New Fruit Across 3 Searches
> Demonstrates querying a mango vector against fruit embeddings using three similarity metrics and visualizations
Welcome back. This tutorial assumes you already have LanceDB set up with vectors for several fruits and that a mango query vector is defined. We'll:
* Reload the stored fruit vectors from LanceDB,
* Visualize vectors in 3D and 2D (Red vs Yellow) color-space,
* Run three similarity/distance searches (Cosine similarity, Euclidean distance, Dot product),
* Compare rankings and visualize metric differences.
If you're following along in a fresh notebook, run each code block sequentially so variables (like `fruit_vectors` and `mango_query`) are available for plotting and metric computation.
## 1) Reload LanceDB and fruit vectors
Run this in a fresh notebook cell to ensure data is present:
```python theme={null}
import numpy as np
import lancedb
from pathlib import Path
DB_PATH = Path("fruits_lancedb")
TABLE_NAME = "fruit_vectors"
db = lancedb.connect(str(DB_PATH))
table = db.open_table(TABLE_NAME)
stored = table.to_pandas()
fruit_vectors = {row.name: np.array(row.vector) for row in stored.itertuples()}
mango_query = np.array([0.9, 0.34, 0.08])
print(f"🔄 Reloaded {len(fruit_vectors)} fruits from LanceDB")
print(f"🍑 Mango query vector: {mango_query}")
```
This confirms the dataset is available and shows the query vector we will search with.
Verify the loaded fruits and their vectors:
```python theme={null}
print(f"Reloaded {len(fruit_vectors)} fruits from LanceDB")
print(f"Mango query vector: {mango_query}")
print("\nStored fruits:")
for name, vec in fruit_vectors.items():
print(f"{name:9} -> {vec}")
```
Example console output:
```text theme={null}
Reloaded 8 fruits from LanceDB
Mango query vector: [0.9 0.34 0.08]
Stored fruits:
papaya -> [0.80 0.35 0.05]
peach -> [0.82 0.41 0.38]
pear -> [0.89 0.42 0.54]
pineapple -> [0.75 0.64 0.45]
apple -> [0.44 0.52 0.36]
apricot -> [0.41 0.47 0.52]
guava -> [0.39 0.58 0.31]
nectarine -> [0.48 0.72 0.68]
```
## 2) Visualize the vectors (3D and 2D projection)
Plot the fruit vectors in 3D color-space plus a 2D top-down projection (Red vs Yellow). This helps reason about which fruits should be nearest the mango query by color.
```python theme={null}
import matplotlib.pyplot as plt
from mpl_toolkits.mplot3d import Axes3D # noqa: F401 (needed for 3D projection)
# Prepare data for plotting
names = list(fruit_vectors.keys())
vectors = np.array(list(fruit_vectors.values()))
fig = plt.figure(figsize=(12, 5))
# Plot 1: 3D scatter plot
ax1 = fig.add_subplot(121, projection='3d')
ax1.scatter(vectors[:, 0], vectors[:, 1], vectors[:, 2], s=100, alpha=0.6, label='Fruits', c='blue')
ax1.scatter(mango_query[0], mango_query[1], mango_query[2], c='red', s=200, marker='*', label='Mango Query')
for i, name in enumerate(names):
ax1.text(vectors[i, 0], vectors[i, 1], vectors[i, 2], name, fontsize=8)
ax1.set_xlabel('Red')
ax1.set_ylabel('Yellow')
ax1.set_zlabel('Green')
ax1.set_title('Fruit Vectors in 3D Color Space')
ax1.legend()
# Plot 2: 2D projection (Red vs Yellow)
ax2 = fig.add_subplot(122)
ax2.scatter(vectors[:, 0], vectors[:, 1], c='blue', s=100, alpha=0.6, label='Fruits')
ax2.scatter(mango_query[0], mango_query[1], c='red', s=200, marker='*', label='Mango Query')
for i, name in enumerate(names):
ax2.annotate(name, (vectors[i, 0], vectors[i, 1]), fontsize=8)
ax2.set_xlabel('Red Intensity')
ax2.set_ylabel('Yellow Intensity')
ax2.set_title('Red vs Yellow (Top View)')
ax2.legend()
ax2.grid(True, alpha=0.3)
plt.tight_layout()
plt.show()
print("\nNotice how fruits with similar colors cluster together!")
print("Papaya, nectarine, peach, and apricot are in the high-red corner (top-right).")
```
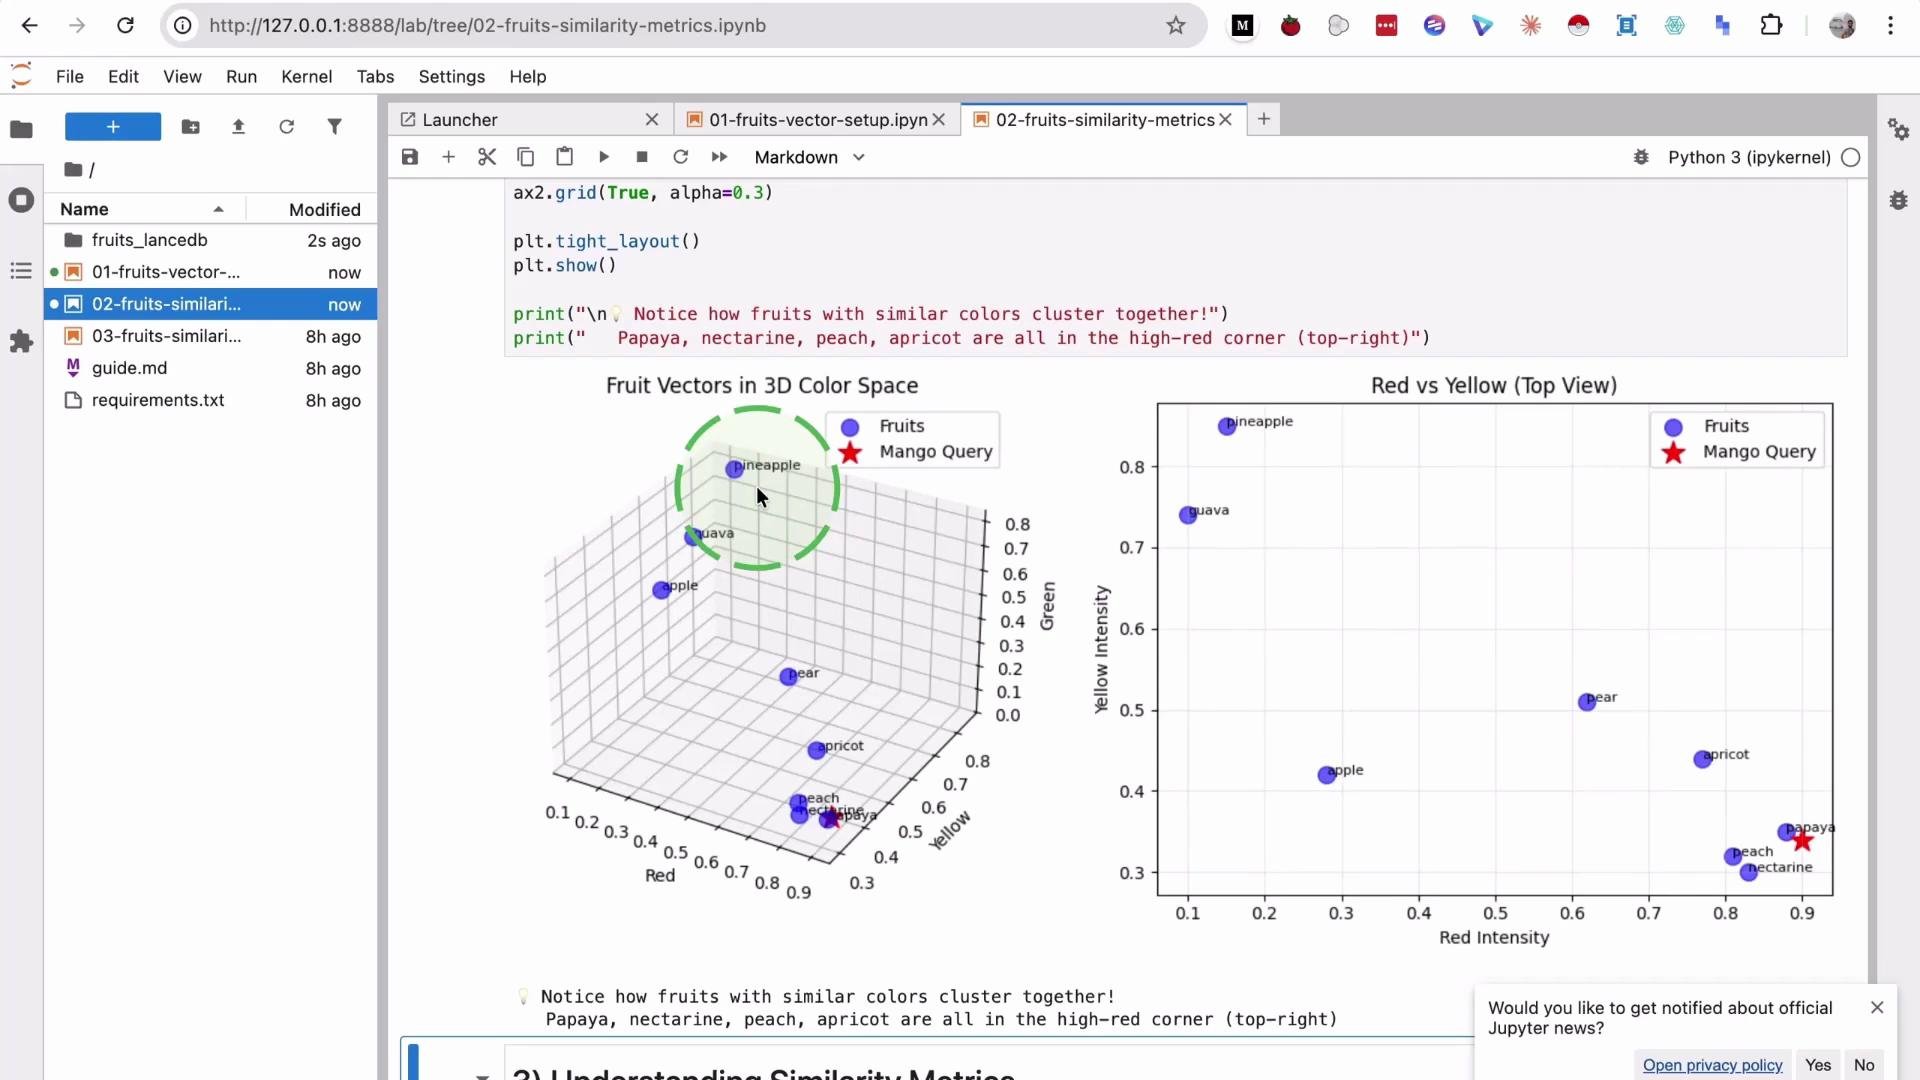 This visualization should make it intuitive which fruits are likely nearest the mango query (for example: papaya, peach, nectarine).
## 3) Define and compute three similarity/distance metrics
We will compare three commonly used metrics:
| Metric | What it measures | Matching rule |
| ------------------ | ------------------------------------------------------------ | ---------------------------------------------------- |
| Cosine similarity | Angle between vectors (direction), normalized for magnitude | Higher = more similar |
| Euclidean distance | Straight-line distance in vector space (magnitude-sensitive) | Lower = more similar |
| Dot product | Unnormalized projection combining direction and magnitude | Higher = more similar (if magnitudes are meaningful) |
Compute each metric and produce sorted rankings:
```python theme={null}
import numpy as np
from typing import Dict, List, Tuple
def cosine_similarity(a: np.ndarray, b: np.ndarray) -> float:
"""Cosine similarity (higher = more similar)."""
return float(np.dot(a, b) / (np.linalg.norm(a) * np.linalg.norm(b)))
def euclidean_distance(a: np.ndarray, b: np.ndarray) -> float:
"""Euclidean distance (lower = more similar)."""
return float(np.linalg.norm(a - b))
def dot_product(a: np.ndarray, b: np.ndarray) -> float:
"""Dot product (higher = more similar if magnitudes are meaningful)."""
return float(np.dot(a, b))
# Compute rankings for each metric
metrics_results: Dict[str, List[Tuple[str, float]]] = {
"Cosine Similarity (higher = more similar)": sorted(
[(name, cosine_similarity(vec, mango_query)) for name, vec in fruit_vectors.items()],
key=lambda x: x[1],
reverse=True
),
"Euclidean Distance (lower = more similar)": sorted(
[(name, euclidean_distance(vec, mango_query)) for name, vec in fruit_vectors.items()],
key=lambda x: x[1]
),
"Dot Product (higher = more similar)": sorted(
[(name, dot_product(vec, mango_query)) for name, vec in fruit_vectors.items()],
key=lambda x: x[1],
reverse=True
),
}
```
Print a formatted comparison of rankings:
```python theme={null}
print("=" * 60)
print("|| SIMILARITY RANKINGS COMPARISON ||")
print("=" * 60)
for metric_name, ranking in metrics_results.items():
print(f"\n{metric_name}:")
for rank, (name, value) in enumerate(ranking, start=1):
print(f" {rank}. {name:12} {value:.4f}")
```
Observed ordering (example from these vectors):
* Cosine top 3: papaya, peach, pear
* Euclidean top 3: papaya, peach, pear
* Dot product top 3: pear, pineapple, peach
To extract the top-k results for quick comparison:
```python theme={null}
# Get top 5 for each metric
top_cosine = [x[0] for x in metrics_results["Cosine Similarity (higher = more similar)"][:5]]
top_euclidean = [x[0] for x in metrics_results["Euclidean Distance (lower = more similar)"][:5]]
top_dot = [x[0] for x in metrics_results["Dot Product (higher = more similar)"][:5]]
print("🏆 Top 5 Fruits by Each Metric:")
print("-" * 50)
print(f"Cosine: {top_cosine} | Euclidean: {top_euclidean} | Dot Product: {top_dot}")
```
Note: all three metrics can often agree on which items are closest (e.g., papaya is near the top for cosine and Euclidean), but they can disagree on exact ordering because they emphasize different vector properties (direction vs magnitude).
## 4) Visualize metric scores
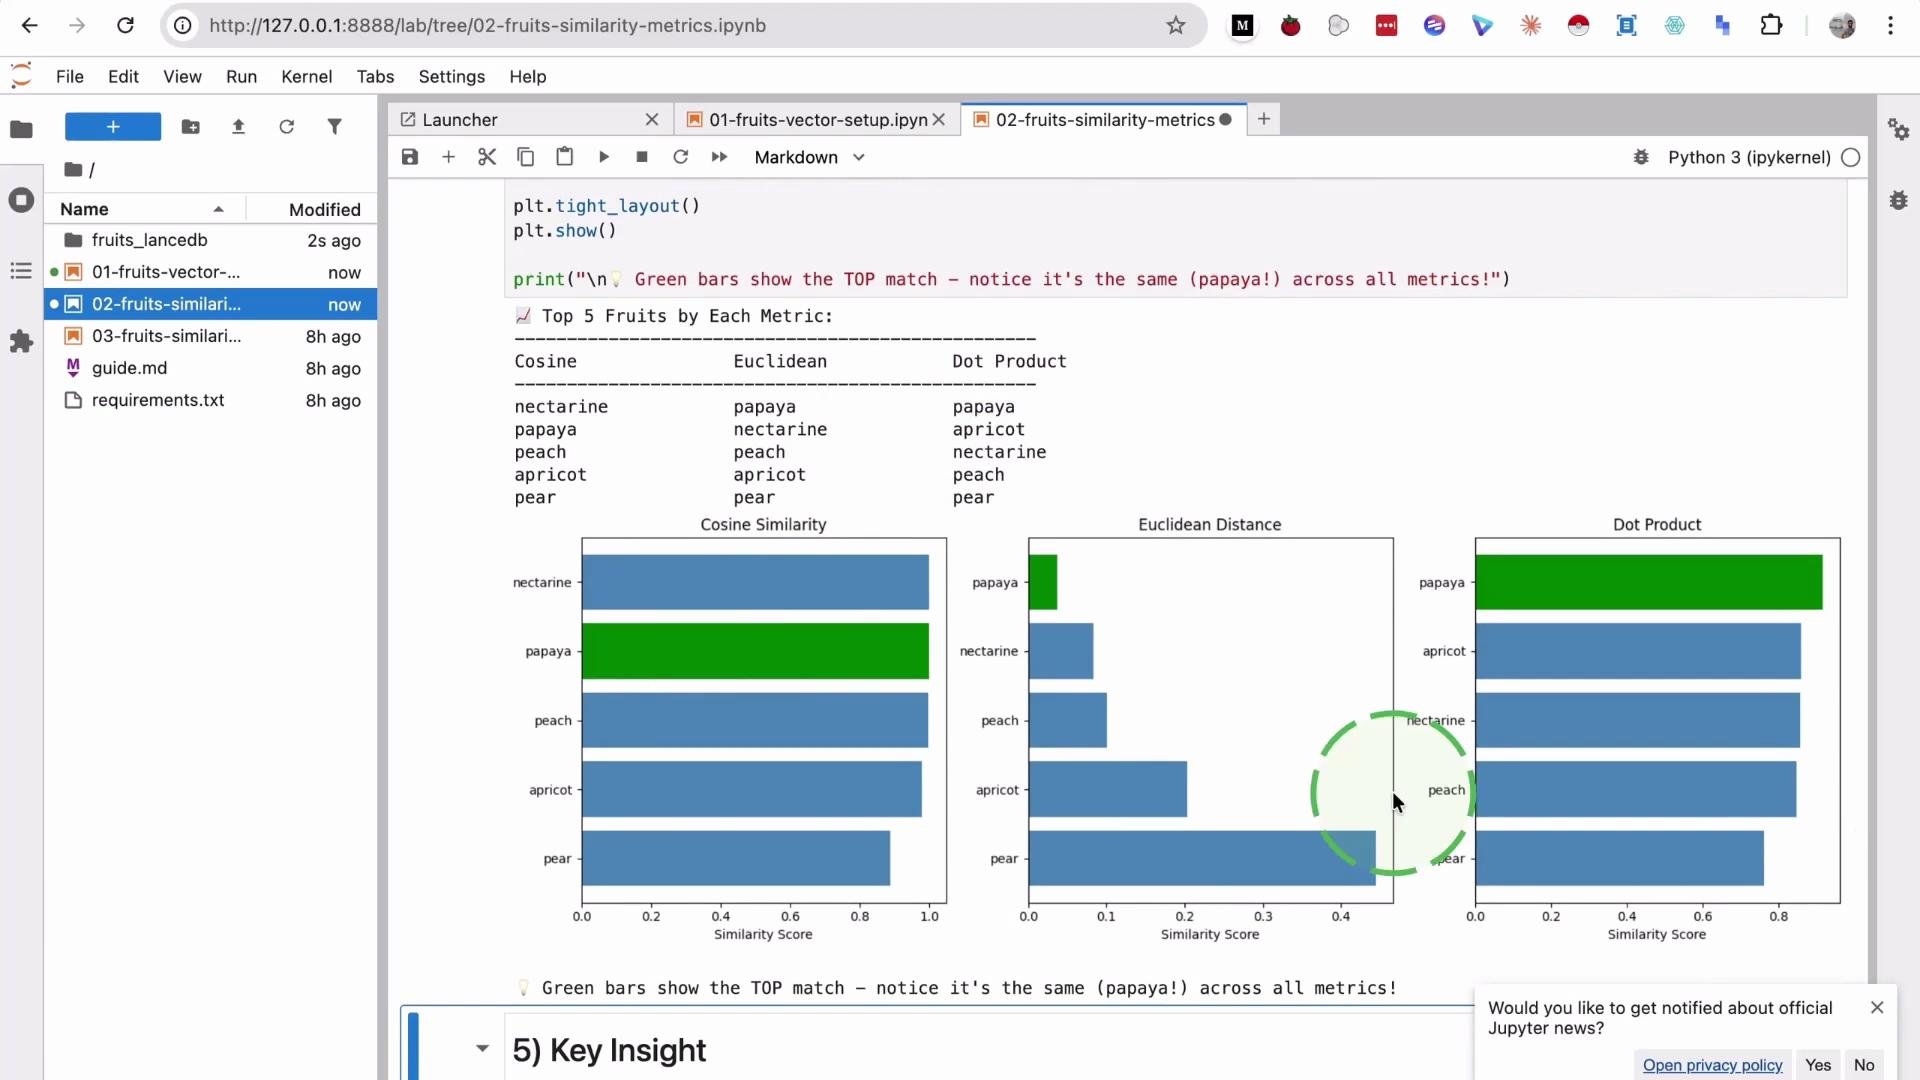
A bar chart or grouped bar plot makes it easier to compare scores across metrics and highlight how one metric (e.g., dot product) can favor high-magnitude vectors like `pear`.
This visualization should make it intuitive which fruits are likely nearest the mango query (for example: papaya, peach, nectarine).
## 3) Define and compute three similarity/distance metrics
We will compare three commonly used metrics:
| Metric | What it measures | Matching rule |
| ------------------ | ------------------------------------------------------------ | ---------------------------------------------------- |
| Cosine similarity | Angle between vectors (direction), normalized for magnitude | Higher = more similar |
| Euclidean distance | Straight-line distance in vector space (magnitude-sensitive) | Lower = more similar |
| Dot product | Unnormalized projection combining direction and magnitude | Higher = more similar (if magnitudes are meaningful) |
Compute each metric and produce sorted rankings:
```python theme={null}
import numpy as np
from typing import Dict, List, Tuple
def cosine_similarity(a: np.ndarray, b: np.ndarray) -> float:
"""Cosine similarity (higher = more similar)."""
return float(np.dot(a, b) / (np.linalg.norm(a) * np.linalg.norm(b)))
def euclidean_distance(a: np.ndarray, b: np.ndarray) -> float:
"""Euclidean distance (lower = more similar)."""
return float(np.linalg.norm(a - b))
def dot_product(a: np.ndarray, b: np.ndarray) -> float:
"""Dot product (higher = more similar if magnitudes are meaningful)."""
return float(np.dot(a, b))
# Compute rankings for each metric
metrics_results: Dict[str, List[Tuple[str, float]]] = {
"Cosine Similarity (higher = more similar)": sorted(
[(name, cosine_similarity(vec, mango_query)) for name, vec in fruit_vectors.items()],
key=lambda x: x[1],
reverse=True
),
"Euclidean Distance (lower = more similar)": sorted(
[(name, euclidean_distance(vec, mango_query)) for name, vec in fruit_vectors.items()],
key=lambda x: x[1]
),
"Dot Product (higher = more similar)": sorted(
[(name, dot_product(vec, mango_query)) for name, vec in fruit_vectors.items()],
key=lambda x: x[1],
reverse=True
),
}
```
Print a formatted comparison of rankings:
```python theme={null}
print("=" * 60)
print("|| SIMILARITY RANKINGS COMPARISON ||")
print("=" * 60)
for metric_name, ranking in metrics_results.items():
print(f"\n{metric_name}:")
for rank, (name, value) in enumerate(ranking, start=1):
print(f" {rank}. {name:12} {value:.4f}")
```
Observed ordering (example from these vectors):
* Cosine top 3: papaya, peach, pear
* Euclidean top 3: papaya, peach, pear
* Dot product top 3: pear, pineapple, peach
To extract the top-k results for quick comparison:
```python theme={null}
# Get top 5 for each metric
top_cosine = [x[0] for x in metrics_results["Cosine Similarity (higher = more similar)"][:5]]
top_euclidean = [x[0] for x in metrics_results["Euclidean Distance (lower = more similar)"][:5]]
top_dot = [x[0] for x in metrics_results["Dot Product (higher = more similar)"][:5]]
print("🏆 Top 5 Fruits by Each Metric:")
print("-" * 50)
print(f"Cosine: {top_cosine} | Euclidean: {top_euclidean} | Dot Product: {top_dot}")
```
Note: all three metrics can often agree on which items are closest (e.g., papaya is near the top for cosine and Euclidean), but they can disagree on exact ordering because they emphasize different vector properties (direction vs magnitude).
## 4) Visualize metric scores
A bar chart or grouped bar plot makes it easier to compare scores across metrics and highlight how one metric (e.g., dot product) can favor high-magnitude vectors like `pear`.
 ## Summary and next steps
```python theme={null}
print("=" * 60)
print("🔴 Stage 2 COMPLETE!")
print("=" * 60)
print("\n📝 What you learned:")
print(" 1. Visualized fruit vectors in 3D color space")
print(" 2. Compared 3 different similarity metrics (cosine, euclidean, dot product)")
print(" 3. Saw how rankings can differ while the top result may still agree")
print("\n👉 Next steps:")
print(" - Try changing the mango_query vector and observe how results change.")
print(" - In real applications, you'd use embedding models (e.g., sentence-transformers: https://www.sbert.net/)")
print(" to create vectors from text; search logic is the same.")
```
Similarity search powers recommendation engines and RAG (retrieval-augmented generation). In recommendations it matches queries to products and user embeddings (purchase history); in RAG it retrieves documents that ground generation, making ranking quality critical to final output quality.
Practical tips:
* In recommendation systems, a short query like `shoe` combined with a user embedding quickly improves relevance (sports vs formal vs ski).
* In RAG, better similarity ranking yields more useful supporting documents and better generated answers.
References:
* LanceDB: [https://github.com/lancedb/lance](https://github.com/lancedb/lance)
* Sentence-Transformers (for real-world text embeddings): [https://www.sbert.net/](https://www.sbert.net/)
## Summary and next steps
```python theme={null}
print("=" * 60)
print("🔴 Stage 2 COMPLETE!")
print("=" * 60)
print("\n📝 What you learned:")
print(" 1. Visualized fruit vectors in 3D color space")
print(" 2. Compared 3 different similarity metrics (cosine, euclidean, dot product)")
print(" 3. Saw how rankings can differ while the top result may still agree")
print("\n👉 Next steps:")
print(" - Try changing the mango_query vector and observe how results change.")
print(" - In real applications, you'd use embedding models (e.g., sentence-transformers: https://www.sbert.net/)")
print(" to create vectors from text; search logic is the same.")
```
Similarity search powers recommendation engines and RAG (retrieval-augmented generation). In recommendations it matches queries to products and user embeddings (purchase history); in RAG it retrieves documents that ground generation, making ranking quality critical to final output quality.
Practical tips:
* In recommendation systems, a short query like `shoe` combined with a user embedding quickly improves relevance (sports vs formal vs ski).
* In RAG, better similarity ranking yields more useful supporting documents and better generated answers.
References:
* LanceDB: [https://github.com/lancedb/lance](https://github.com/lancedb/lance)
* Sentence-Transformers (for real-world text embeddings): [https://www.sbert.net/](https://www.sbert.net/)