CloudWatch
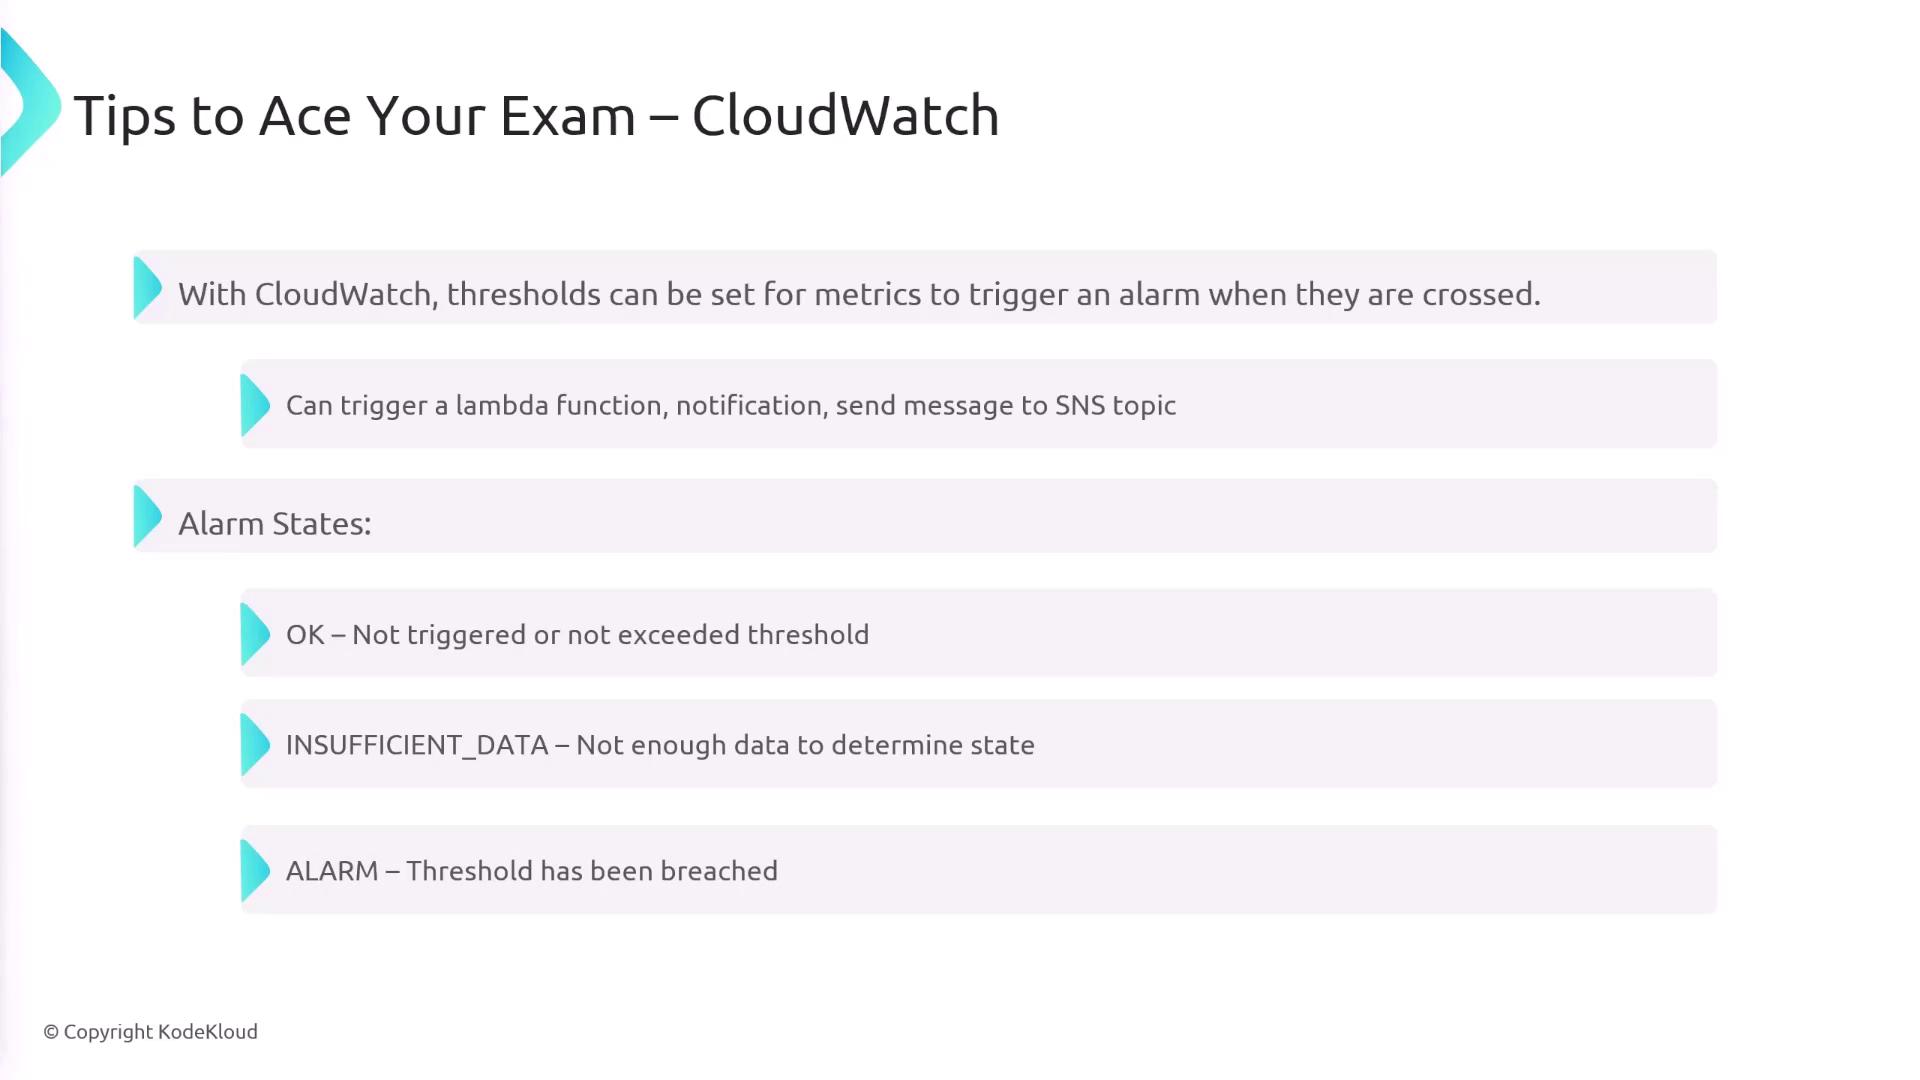
Amazon CloudWatch enables you to collect, monitor, and analyze metrics and logs for your AWS resources and applications. Both AWS services and custom applications can push metrics and logs to CloudWatch. You can configure CloudWatch alarms to monitor metrics and automatically trigger actions—such as sending notifications, invoking Lambda functions, or publishing to SNS topics—when predefined thresholds are crossed.Key Concepts in CloudWatch
-
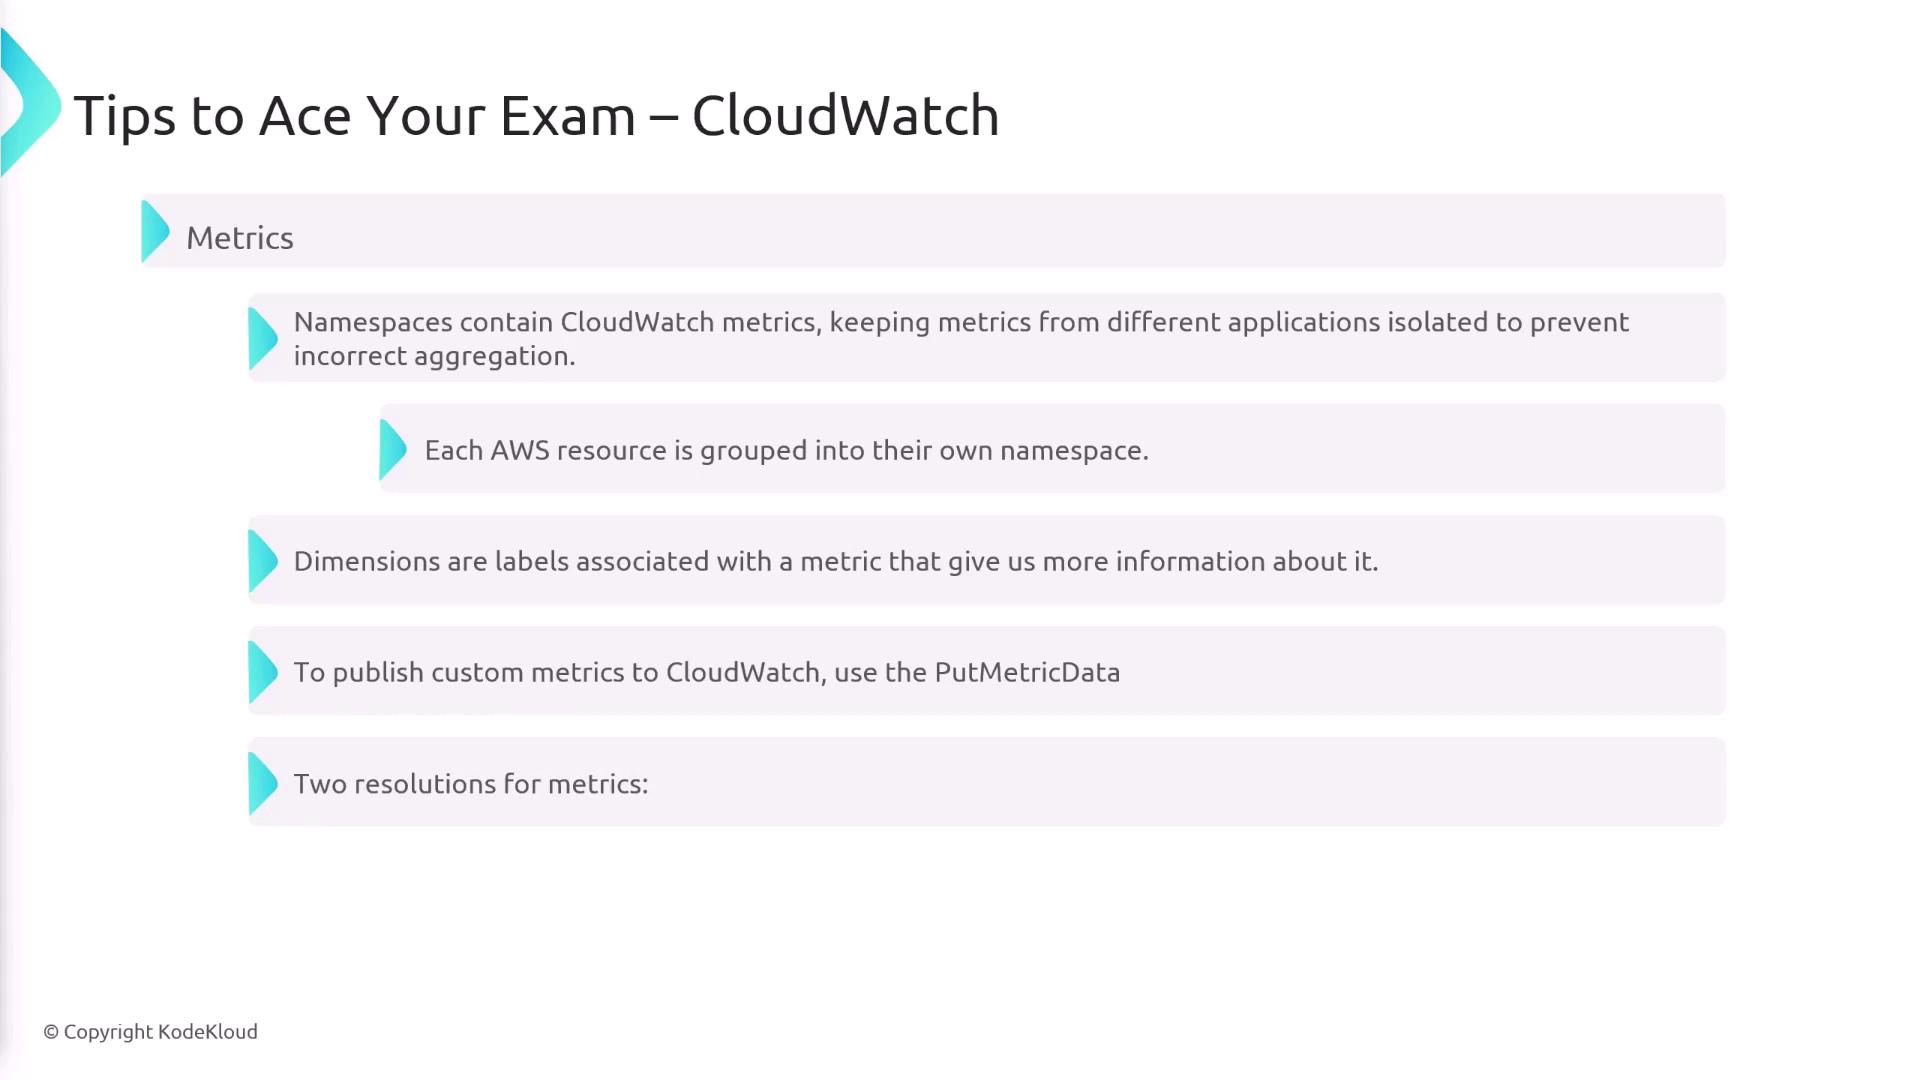
Namespaces:
Namespaces isolate metrics to prevent misaggregation. Each AWS resource typically has its own namespace. -
Dimensions:
Labels that add context to a metric. For example, when monitoring network traffic, you might use a dimension to identify the specific EC2 interface receiving packets. -
Custom Metrics:
Publish your own metrics using thePutMetricDataAPI. CloudWatch supports two resolutions:- Standard Resolution: Provides one-minute granularity.
- High Resolution: Offers one-second granularity.

Logs in CloudWatch
When leveraging CloudWatch for log management, note the following definitions:-
Log Group:
A collection of log streams sharing identical retention, monitoring, and access control settings. -
Log Stream:
A sequence of log events from a specific source. For example, each EC2 instance in a distributed application might send its logs to its own log stream even though they all belong to the same log group.
For EC2 instances, make sure to install the CloudWatch agent to enable log forwarding. The legacy CloudWatch logs agent handles only logs, whereas the unified agent supports both logs and metrics.
CloudWatch Logs Insights and Alarms
CloudWatch Logs Insights is a powerful tool that allows you to query your logs to find complex patterns and gain actionable insights. When setting up alarms, remember that each alarm can be in one of three states:- OK: The metric is within its threshold.
- INSUFFICIENT_DATA: There is not enough data to determine a state.
- ALARM: The metric has crossed its threshold.
CloudTrail
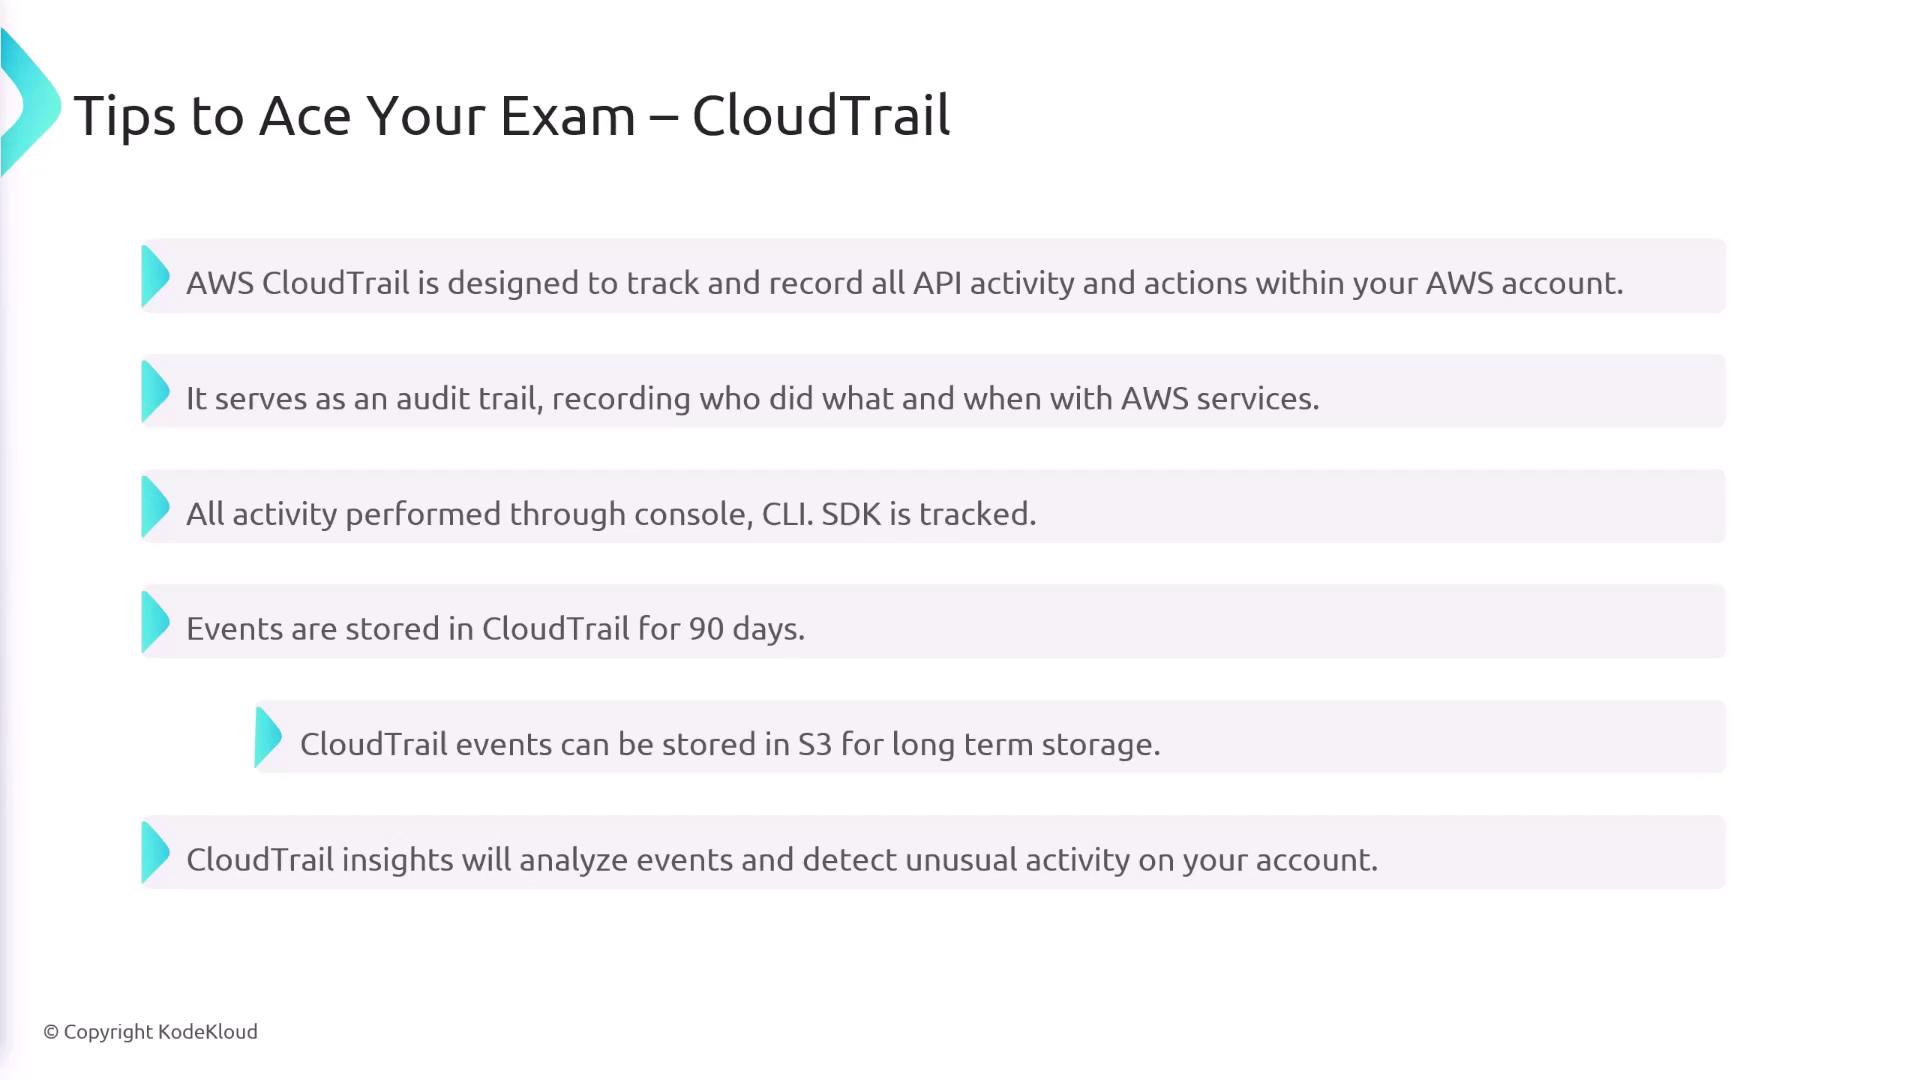
AWS CloudTrail records all API activity and actions in your AWS account, offering a comprehensive audit trail across AWS services. Whether the actions are performed through the AWS Management Console, CLI, or SDK, CloudTrail captures the details—including who initiated the action and when it occurred.Essential CloudTrail Features
-
Audit Trail:
CloudTrail logs act as an audit trail to help track every API call made in your AWS environment. -
Event Storage:
By default, CloudTrail stores events for 90 days. However, you can configure long-term archival in Amazon S3. -
CloudTrail Insights:
Use CloudTrail Insights to detect unusual activity and automatically identify unexpected changes in your AWS environment.
X-Ray
AWS X-Ray is a powerful tool designed to help you analyze and debug distributed applications, particularly those built using microservices architectures. It provides an end-to-end view of requests as they traverse through your application, making it easier to identify bottlenecks and performance issues.Core Components of X-Ray
-
Segments and Subsegments:
A segment contains detailed information about a request, including data on resource usage and performance. Each segment may be divided into subsegments that detail downstream calls. -
Traces:
A trace aggregates segments to represent the full journey of a single request through your application. -
Annotations and Metadata:
Annotations are key-value pairs that help filter and query traces, while metadata provides additional context without being indexed.
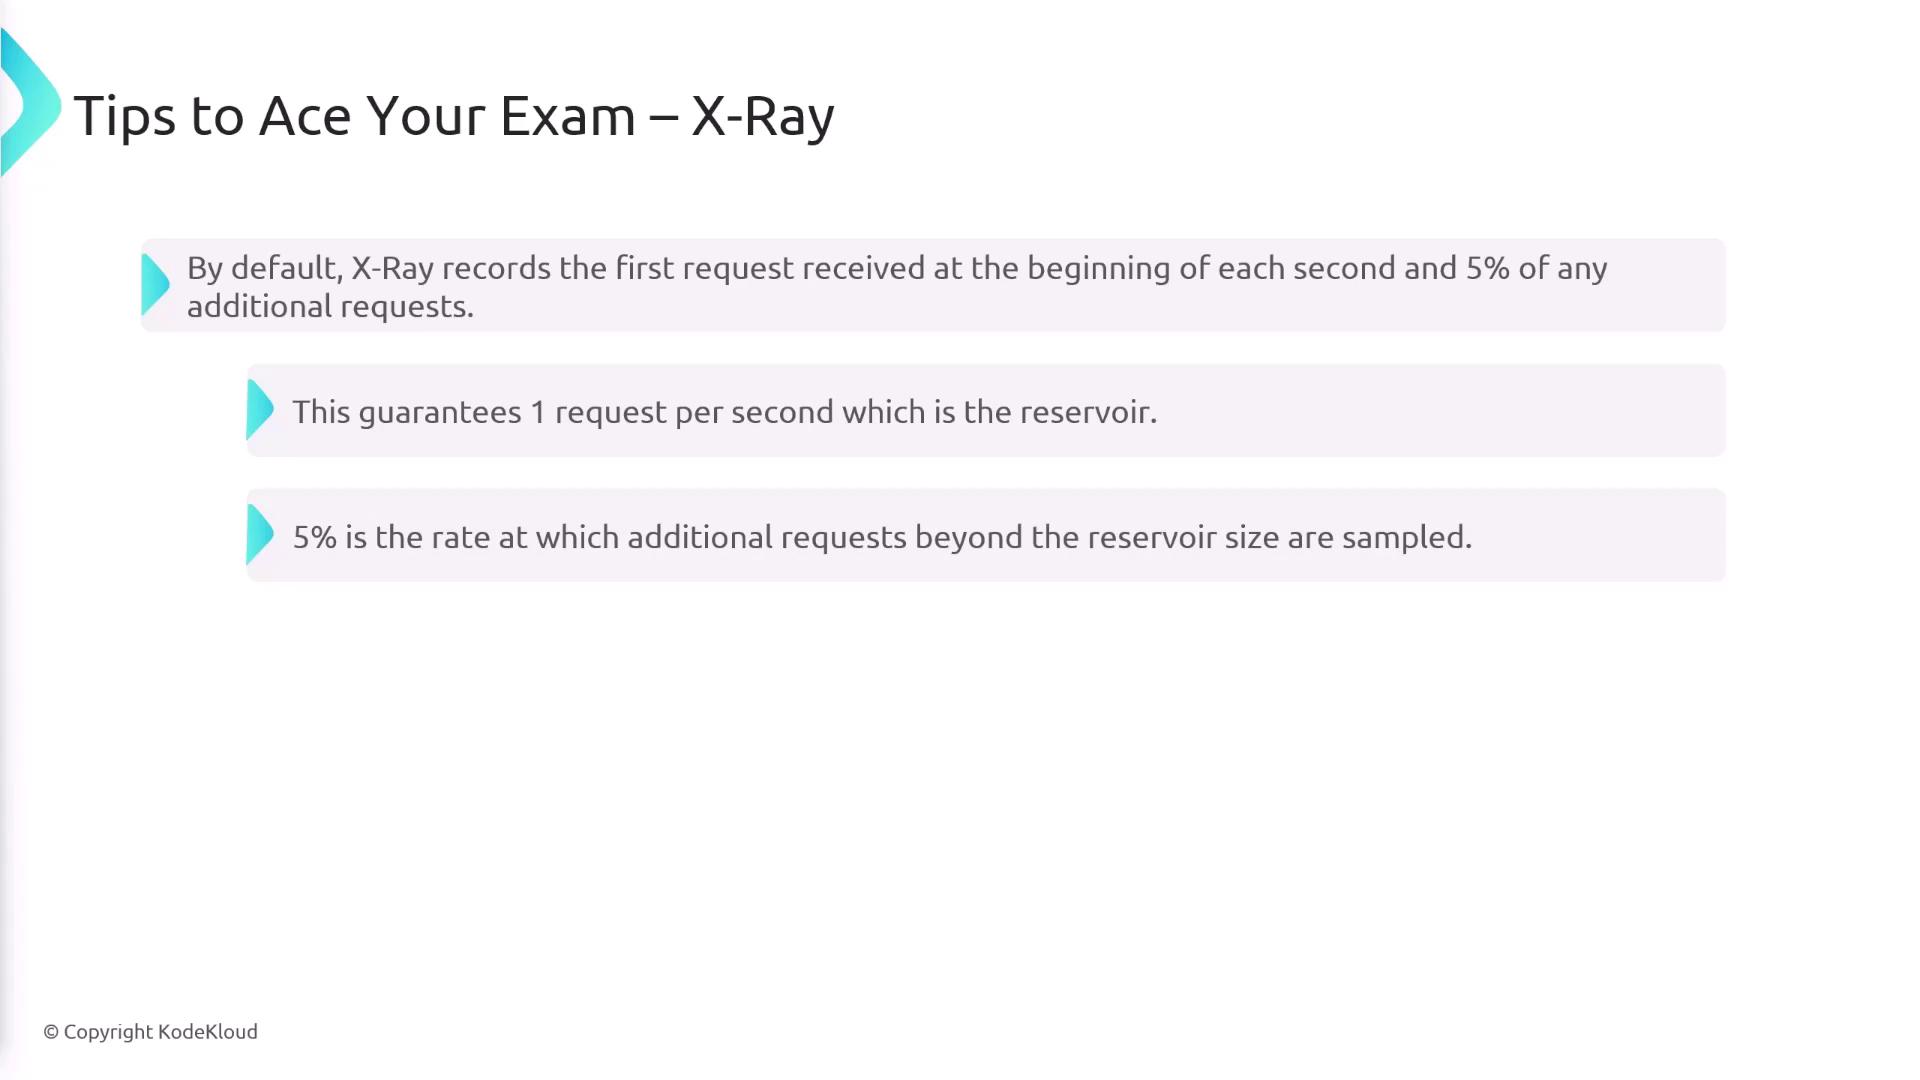
Sampling
By default, X-Ray records the first request at the start of each second—forming a reservoir—and additionally samples 5% of subsequent requests. This sampling strategy helps control the amount of data collected without compromising visibility into application performance. To integrate X-Ray into your application, import the X-Ray SDK and configure a trace collector. Options for trace collectors include:- AWS Distro for OpenTelemetry Collector
- CloudWatch Agent
- X-Ray Daemon (automatically enabled for AWS Lambda and select other AWS services)
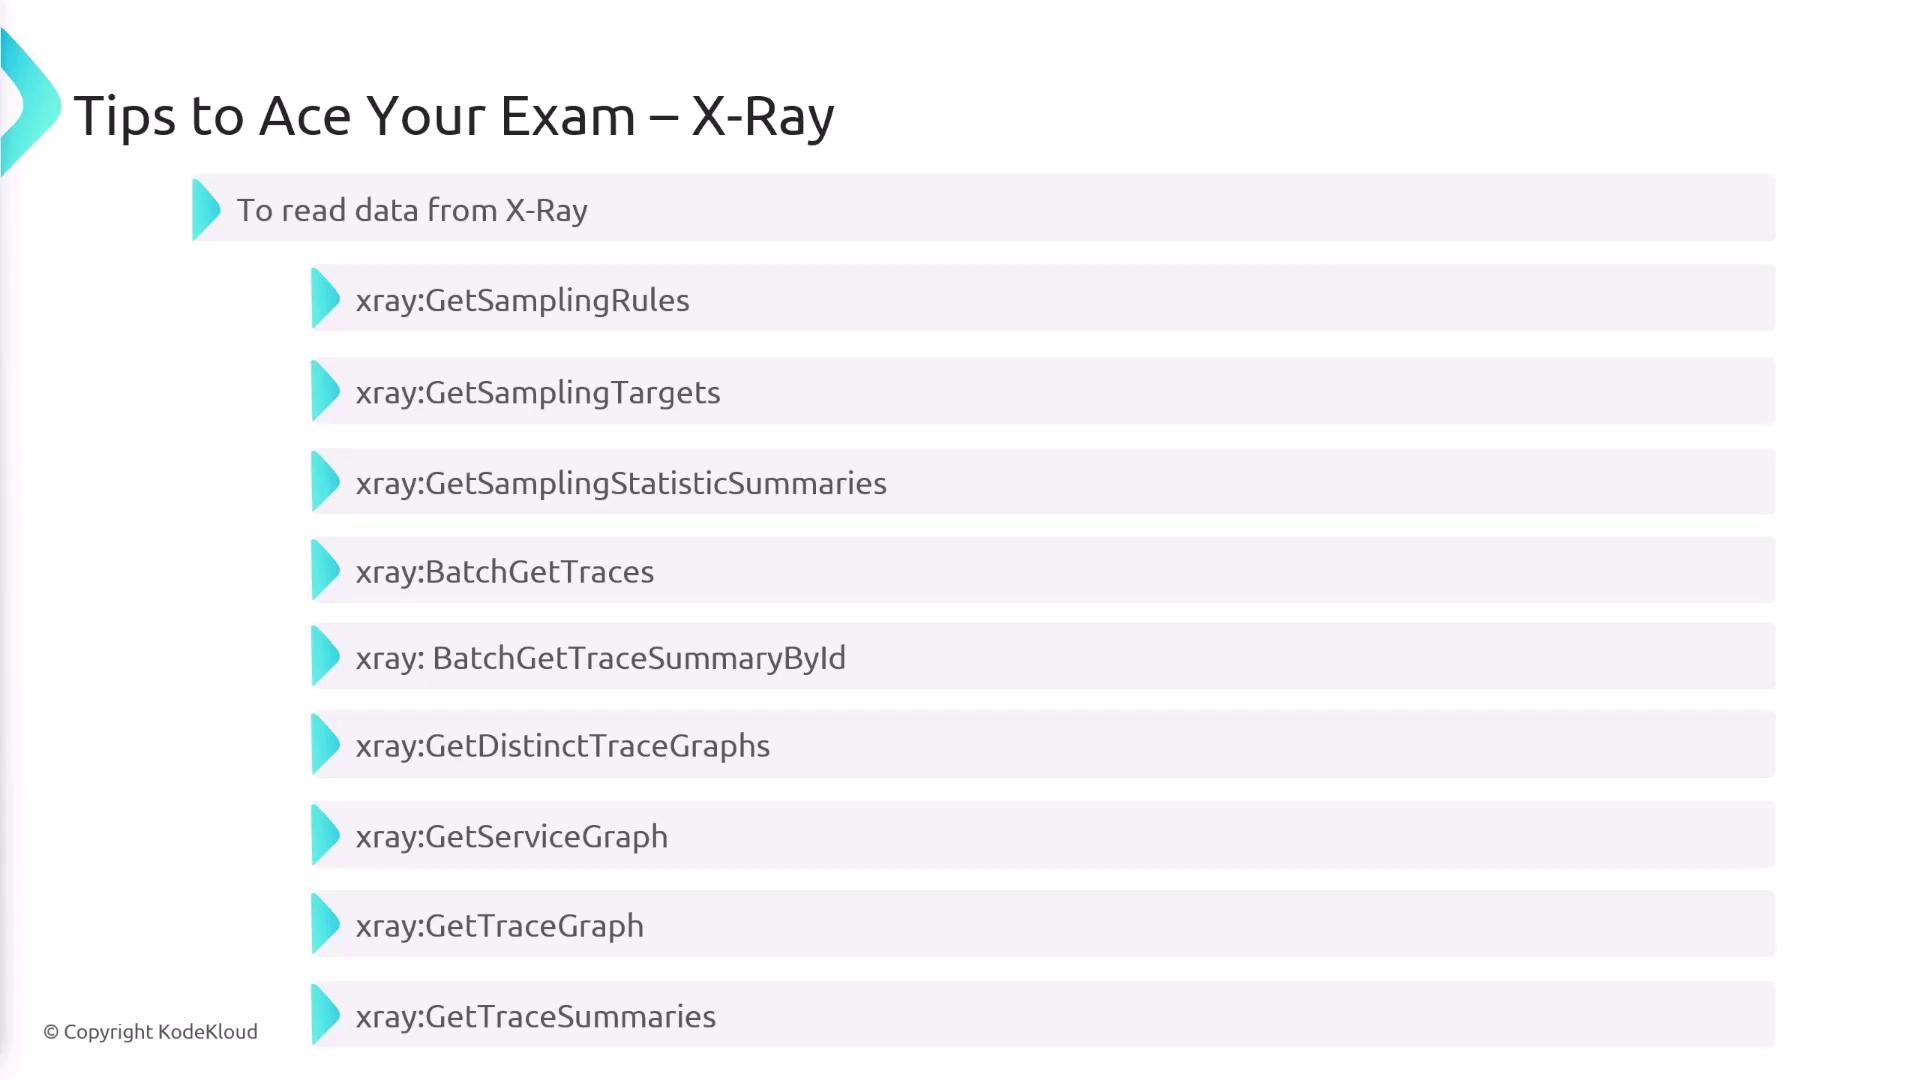
Ensure that your X-Ray daemon and client have the necessary permissions (such as
xray:GetSamplingRules and xray:GetTraceSummaries) to successfully send and retrieve trace data.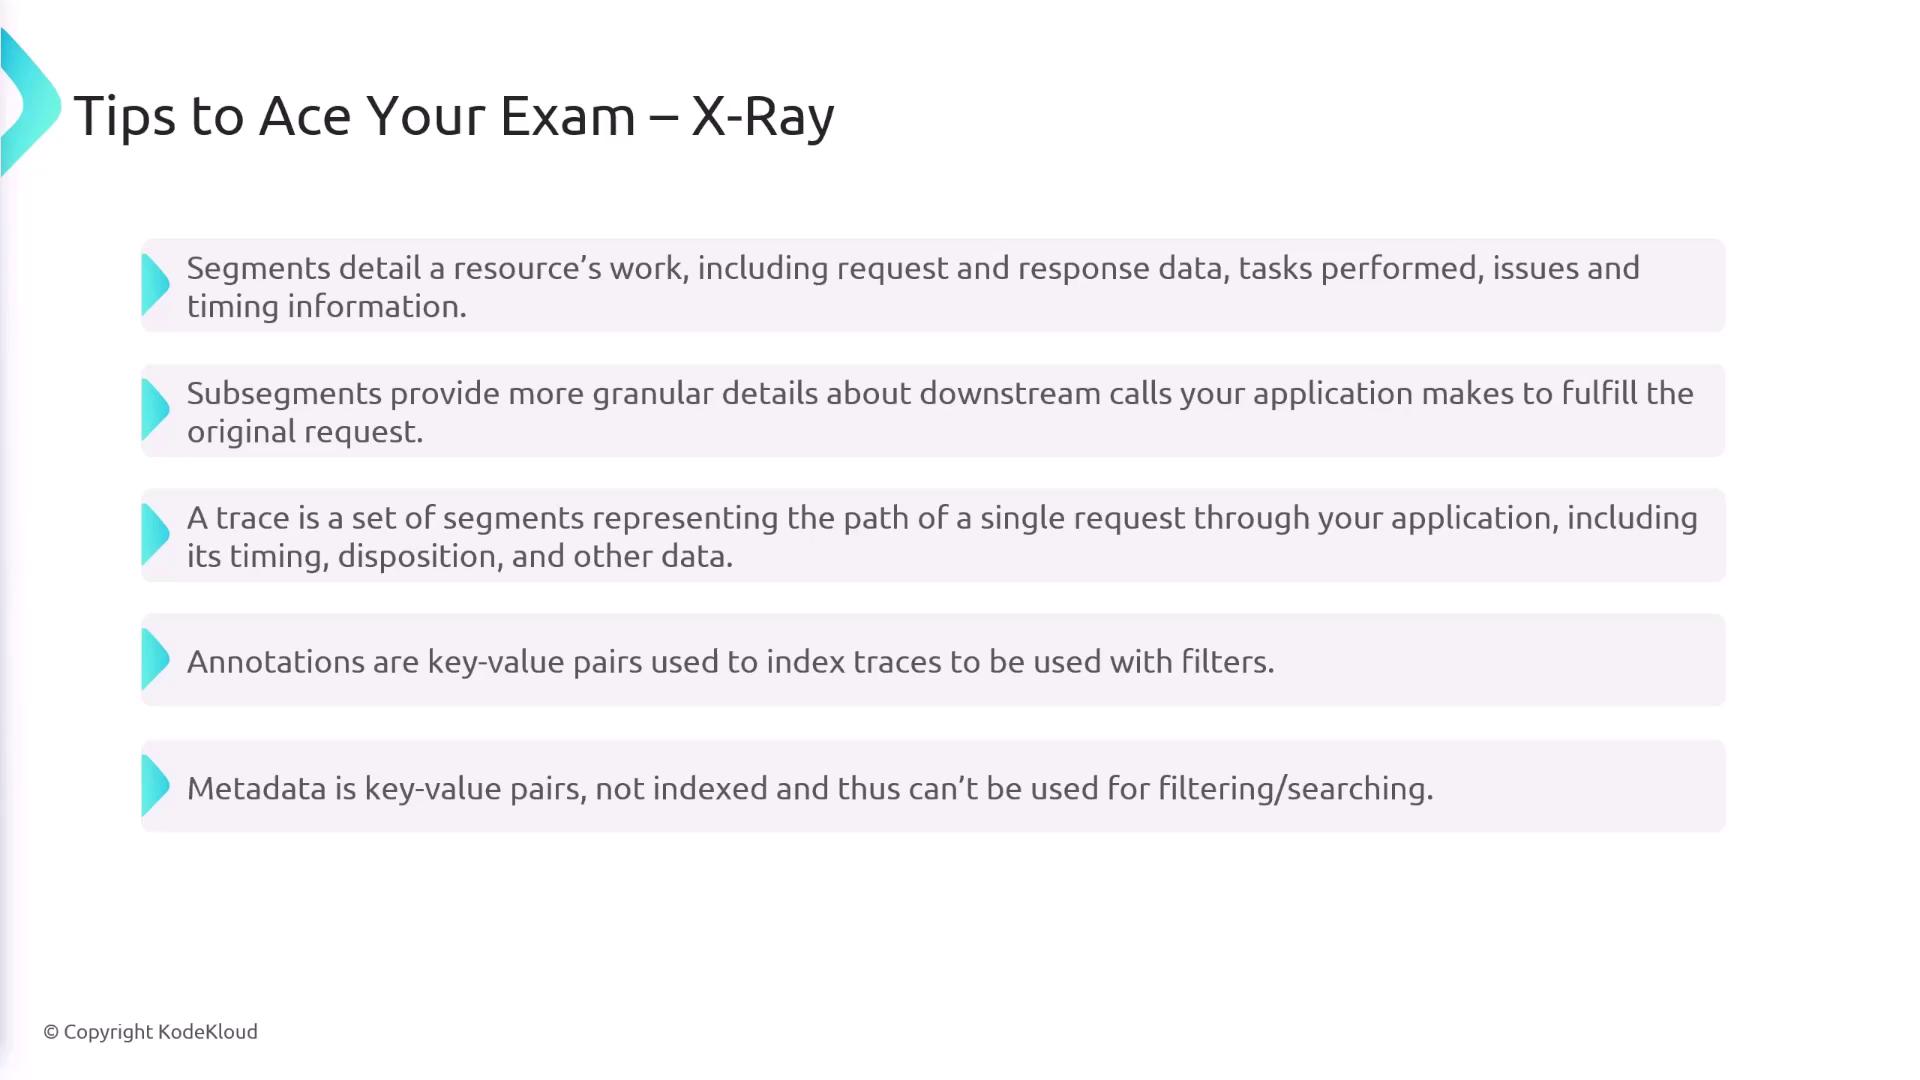
X-Ray Integration on Different AWS Services
For services like Elastic Beanstalk, X-Ray is available out of the box—you can enable it via the AWS Management Console or through configuration files (such as.ebextensions). For EC2 instances, make sure the instance has an appropriate IAM role or specific instance profile to allow sending data to X-Ray.
This concludes the overview of exam tips for AWS CloudWatch, CloudTrail, and X-Ray. Review these concepts thoroughly to ensure you are fully prepared for exam questions related to these fundamental AWS services. For further reading, consider exploring related resources and official documentation provided by AWS.