AWS Certified Developer - Associate
AWS Monitoring
Xray Demo
In this guide, we'll demonstrate how to work with AWS X-Ray to gain insights into your application's performance. In this demo, an already deployed application is instrumented with X-Ray libraries to collect and send traces to AWS X-Ray. Although instrumenting the application is beyond the scope of this guide, our focus lies in interpreting the traces displayed in the X-Ray console and understanding the segments that compose each trace.
Navigating the X-Ray Service
Begin by searching for X-Ray in the AWS Management Console. This action navigates you directly to the X-Ray service page within CloudWatch. Here, you'll find sections dedicated to both the X-Ray service map and traces.
The Service Map
The service map provides a diagrammatic view of all the components within your application. For instance, consider the following flow:
- A client (user or frontend application) sends a request to the scorekeeping application deployed on an ECS container.
- The ECS container interacts with multiple components, including a scorekeep notification SNS topic and several DynamoDB tables (handling state, session, each move, and game representation).
This diagram helps to visualize the interactions between components via X-Ray traces. At the top of the service map, you have the option to choose the timeframe for the traces (e.g., the last 5 minutes or 15 minutes). By clicking on any node in the diagram, you can view all traces associated with that component.
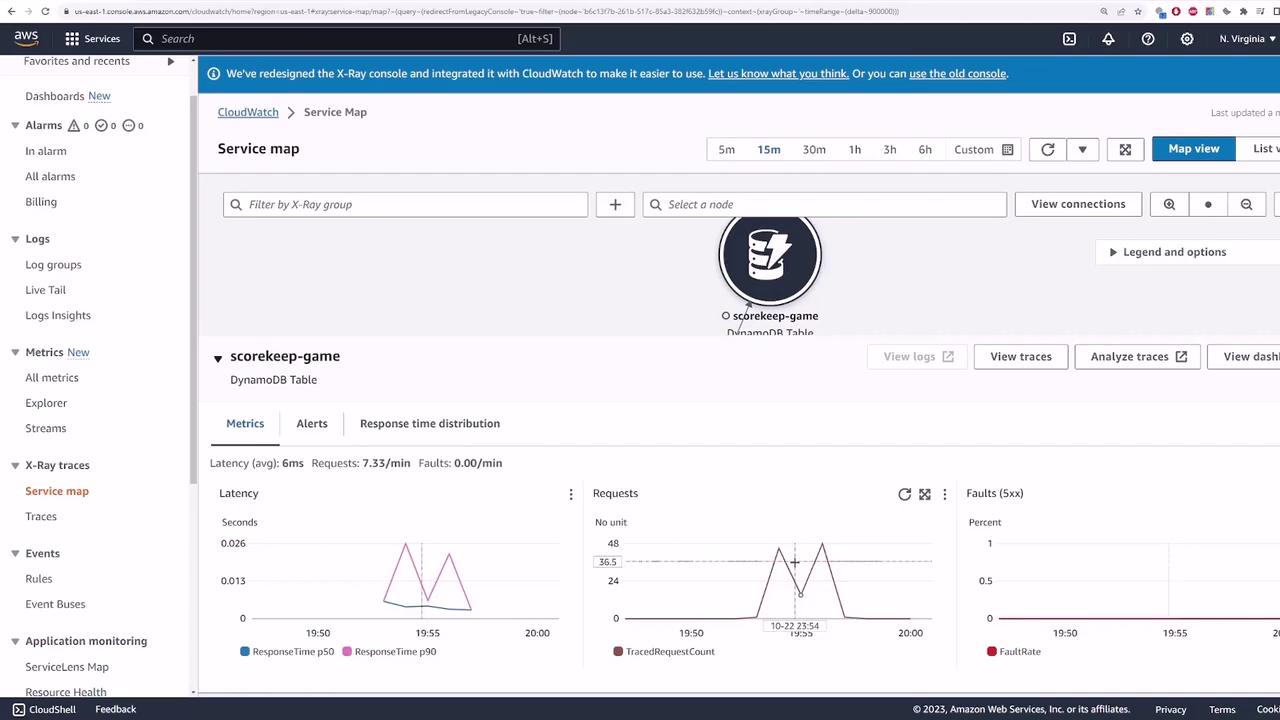
Tracing a Node
By selecting a node, you will see key metrics for that component, which include:
- Latency
- Number of requests
- Total faults (e.g., 500 status codes)
- Alerts and response time distributions
To access detailed traces for a specific node, click on "View traces." This action automatically filters the displayed traces to those relevant to the selected node. For example, you might observe traces indicating failures alongside normal operations.
Analyzing Trace Details
When you select an individual trace, the console displays all the segments making up that trace. For example, a simple trace might reveal that:
- The trace reaches the ECS container.
- The container sends a request to the scorekeep game table.
- A "get item" operation is performed on the DynamoDB table.
The timeline in the trace details outlines the duration of each operation. In more complex traces, you may observe multiple operations, such as:
- Several "get item" requests to various DynamoDB tables.
- An SNS notification operation.
- Other actions that cumulatively define the overall request processing time.
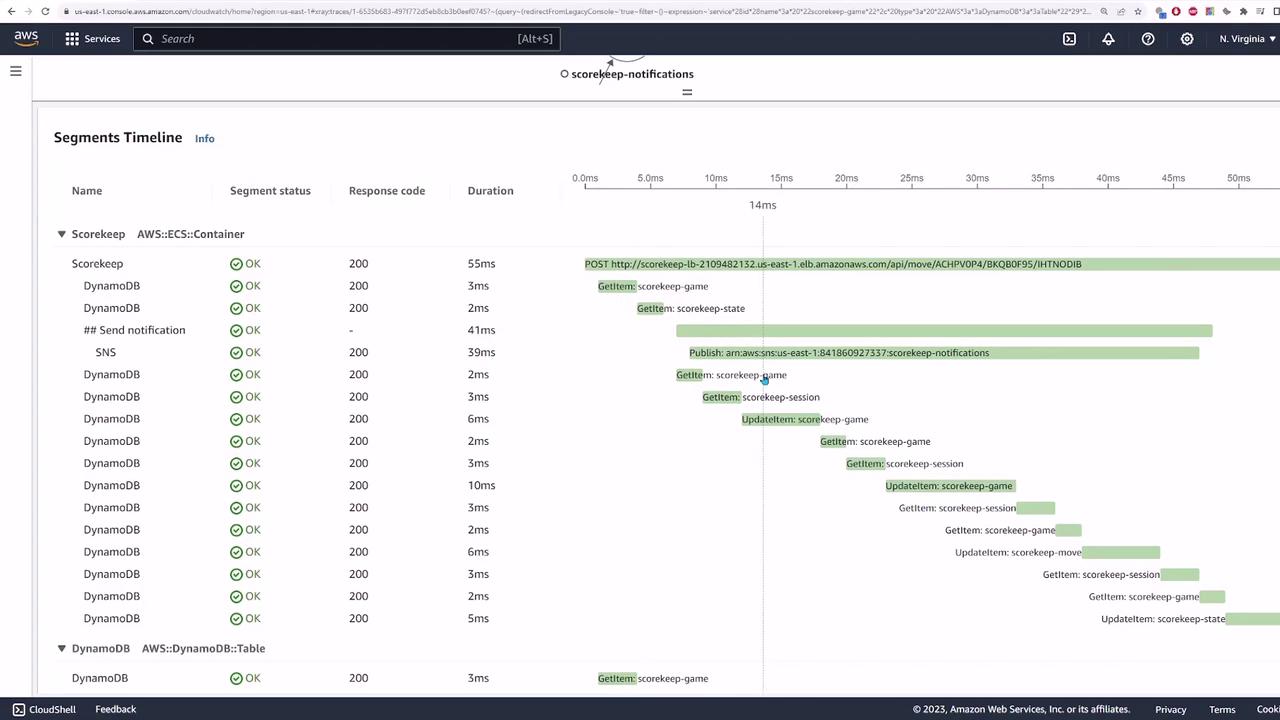
By examining the duration of each segment, you can identify bottlenecks in your application. For instance, increased latency on a specific operation or a failure response (like a 500 error) can help pinpoint the source of the issue.
Tip
Always compare the duration of segments to quickly identify operations that may be slowing down your application.
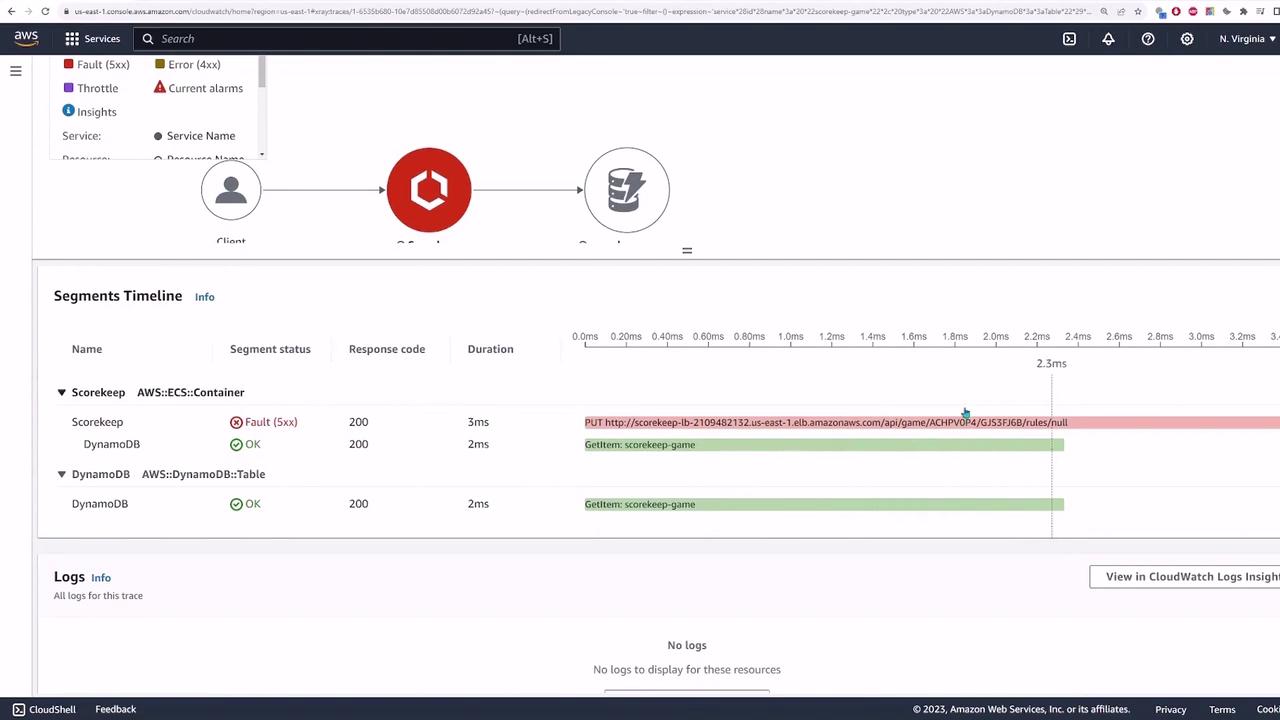
Identifying Failures
If you encounter a fault, such as a 500 error, inspect the related segment to diagnose the issue. The error might be linked to a specific operation within the ECS container when processing a request. By drilling down into the trace, you can view details such as response codes and time spent in that segment, helping you determine the precise cause of the error.
If necessary, you can remove the query filter and execute a broad query to view every trace recorded within the specified timeframe. This comprehensive view lets you review metrics such as response codes and the duration of each operation.
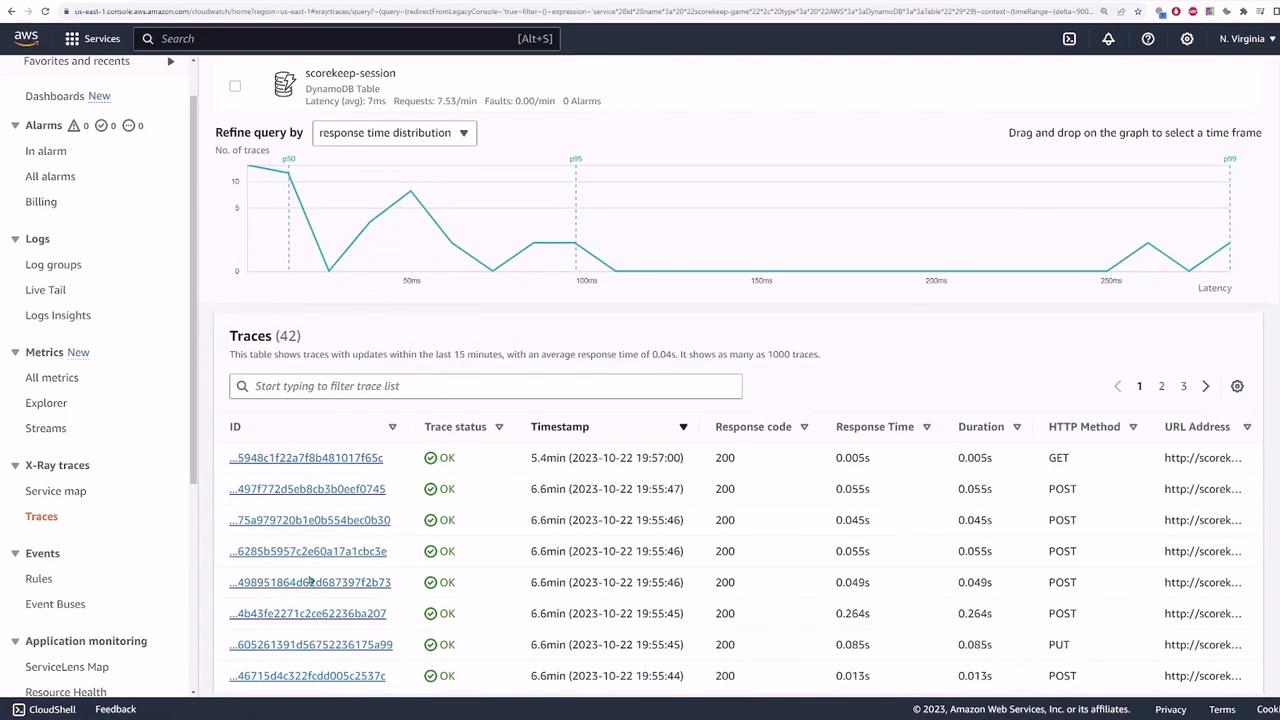
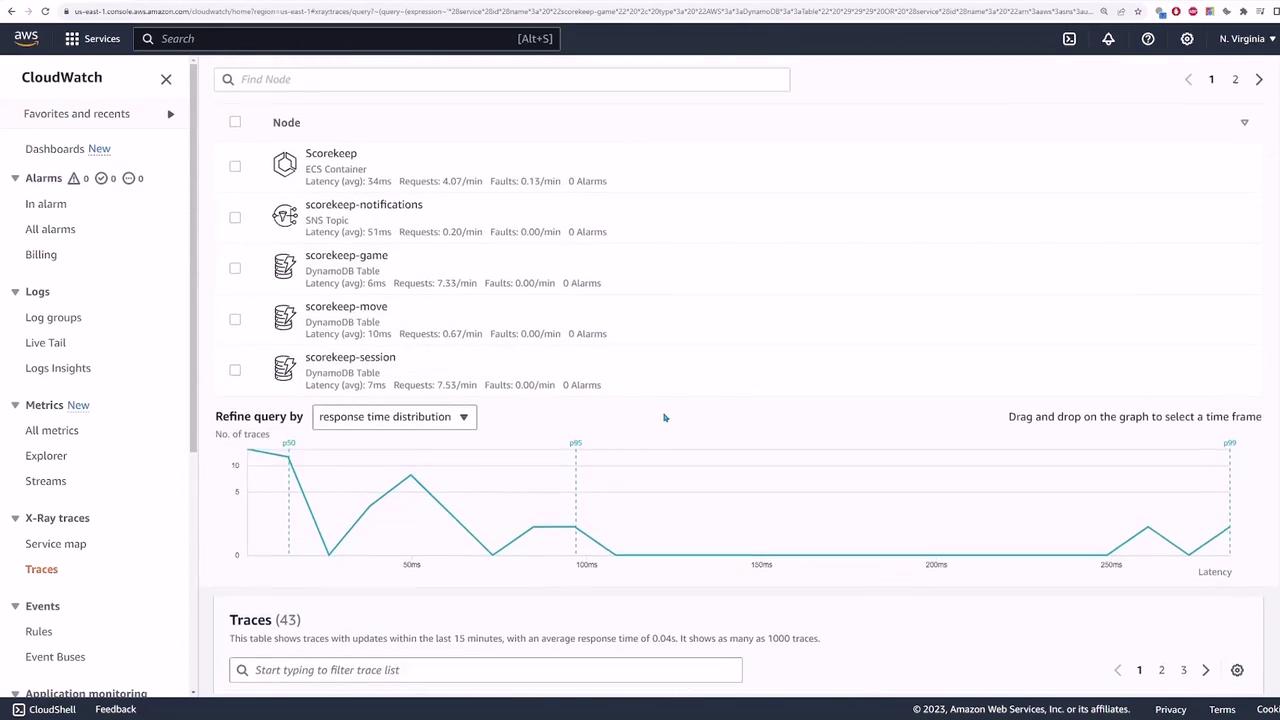
Combining Multiple Queries
Back on the traces page, you have the option to further refine your query. For example, if you wish to view traces that involve both the SNS topic and the scorekeep game, you can add those filters and run the query. This might return, for instance, 43 traces. The resulting graph will display response time distributions alongside the individual traces collected during the selected timeframe.
Summary
AWS X-Ray is an essential tracing tool designed to help you understand the lifecycle of a request through your application. By instrumenting your application with X-Ray, you can swiftly identify the components responsible for latency or errors, making performance troubleshooting more efficient.
Happy Tracing!
We hope you found this guide informative and useful. For more tips on monitoring and observability with AWS, explore our related resources and documentation.
Watch Video
Watch video content