AWS Certified SysOps Administrator - Associate
Domain 6 Cost and Performance Optimization
Monitoring EBS Metrics for Performance and More
Welcome students. In this lesson, we will explore key Amazon EBS metrics for effective performance monitoring. We will focus on understanding these metrics and their significance, particularly in an exam context.
CloudWatch Metrics for EBS Volumes
Amazon CloudWatch metrics provide essential insights into EBS volume performance. Understanding these metrics is key to identifying potential performance issues and optimizing your storage.
Volume Read Operations:
Indicates the total number of read operations performed on a volume. It helps gauge the volume’s read activity.Volume Write Operations:
Tracks all the write operations executed on the volume, offering insight into the volume’s write workload.Volume Bytes:
Divided into read bytes and write bytes, this metric shows the total amount of data read from or written to the volume during a given interval.Volume Queue Length (or Queue Depth):
Represents the number of I/O requests waiting in the queue. For example, if your system handles 500 read operations per second but receives 1,000, a backlog of 500 requests will occur. A high queue length generally signals that the disk is under heavy load.Provisioned IOPS Throughput Percentage:
For provisioned IOPS volumes, this metric displays the percentage of I/O operations processed. Lower percentages can indicate performance limitations.Burst Credits (for GP2 Volumes):
GP2 volumes, which are older than GP3, use burstable I/O credits. Monitoring burst balance is similar to tracking CPU burst on T2 or T3 systems.Volume Idle Time:
Measures the duration when no operations are requested. The impact of idle time varies; for example, 60 seconds of inactivity might be concerning in a short monitoring window, whereas 10 minutes could be normal during low-usage periods.Volume Total Read Time and Total Write Time:
These metrics show the cumulative time spent on read and write operations, which helps determine latency (the delay between requesting and completing an I/O operation).Volume Consumed Read/Write Operations:
For provisioned IOPS volumes, this metric tracks the total I/O consumed by read and write activities.
A critical performance indicator is IOPS (I/O operations per second). Alongside latency, IOPS directly affects overall performance. When the queue length increases, it signifies that the volume is not keeping up with the operations, creating a potential bottleneck.
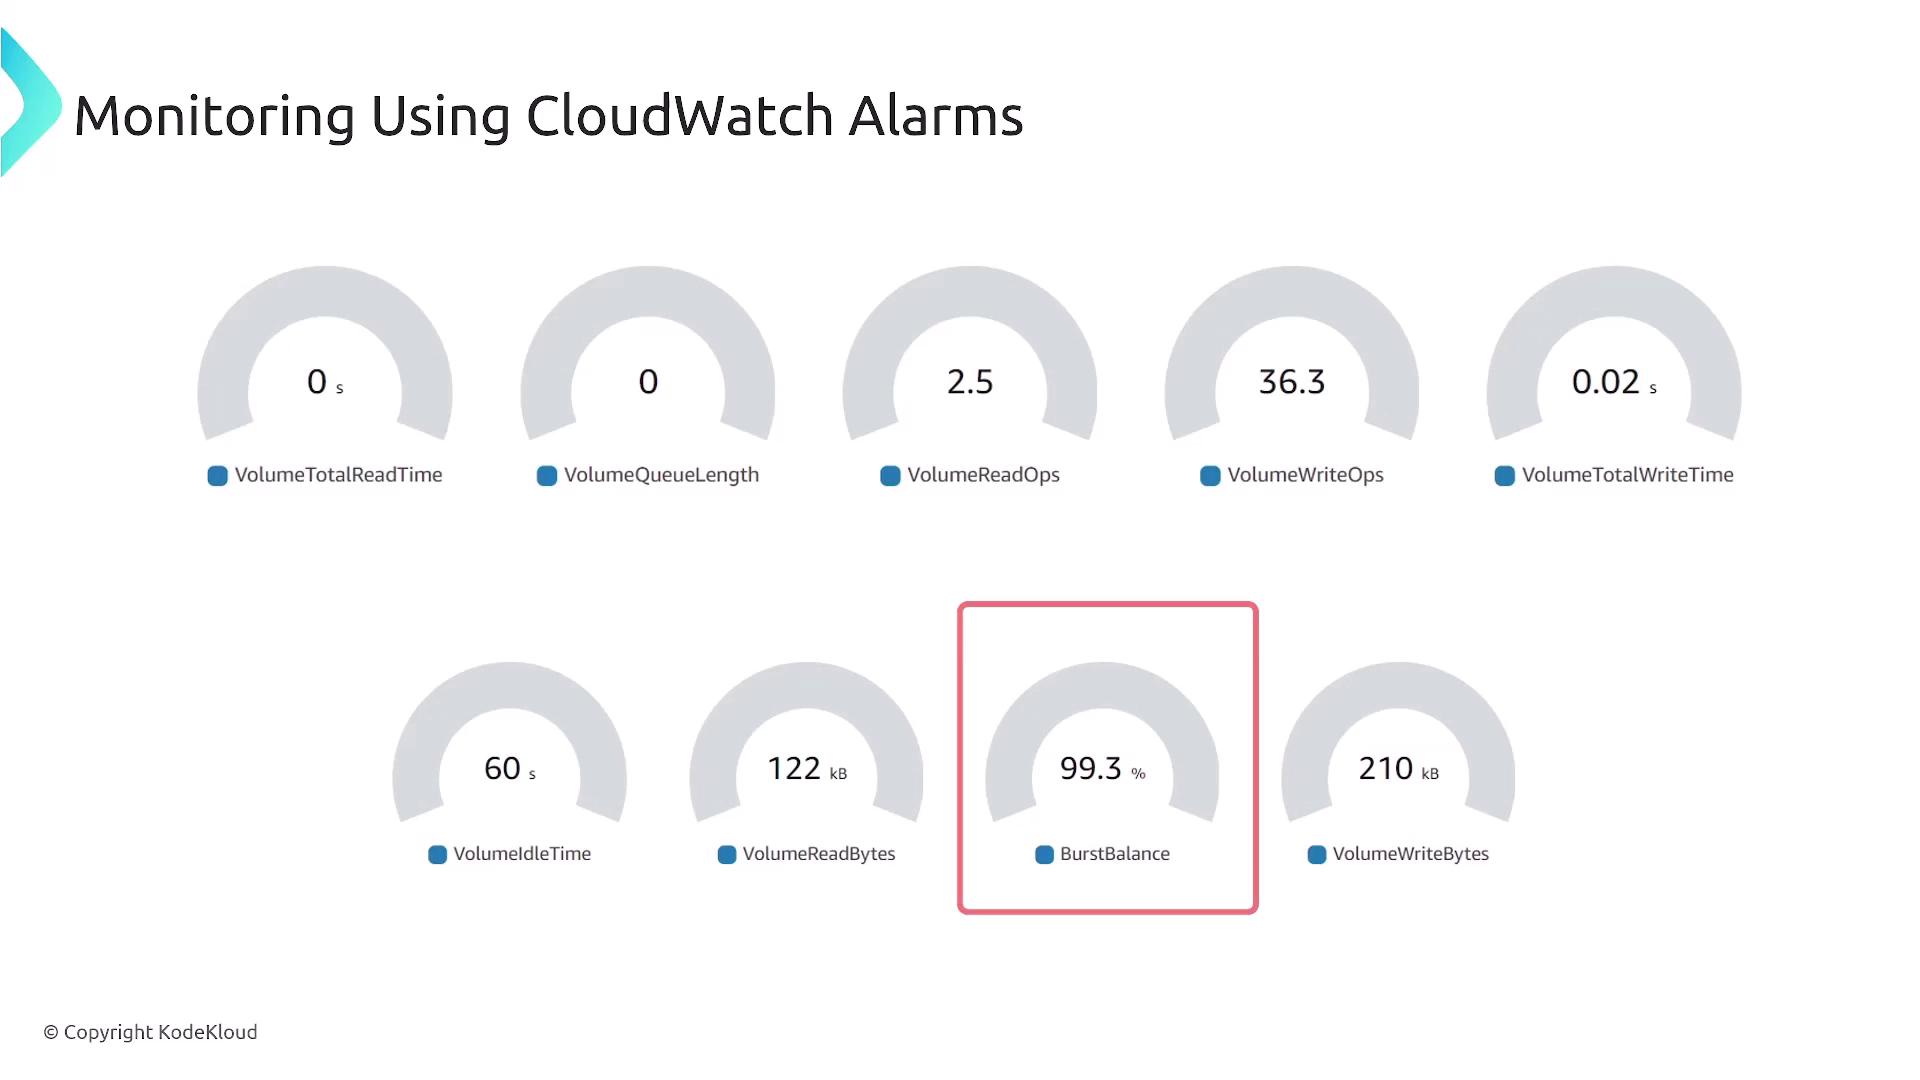
Below is an example of a CloudWatch alarms dashboard that displays several of these metrics:
Interpreting Key Performance Indicators (KPIs)
The following KPIs are essential for monitoring and optimizing I/O operations:
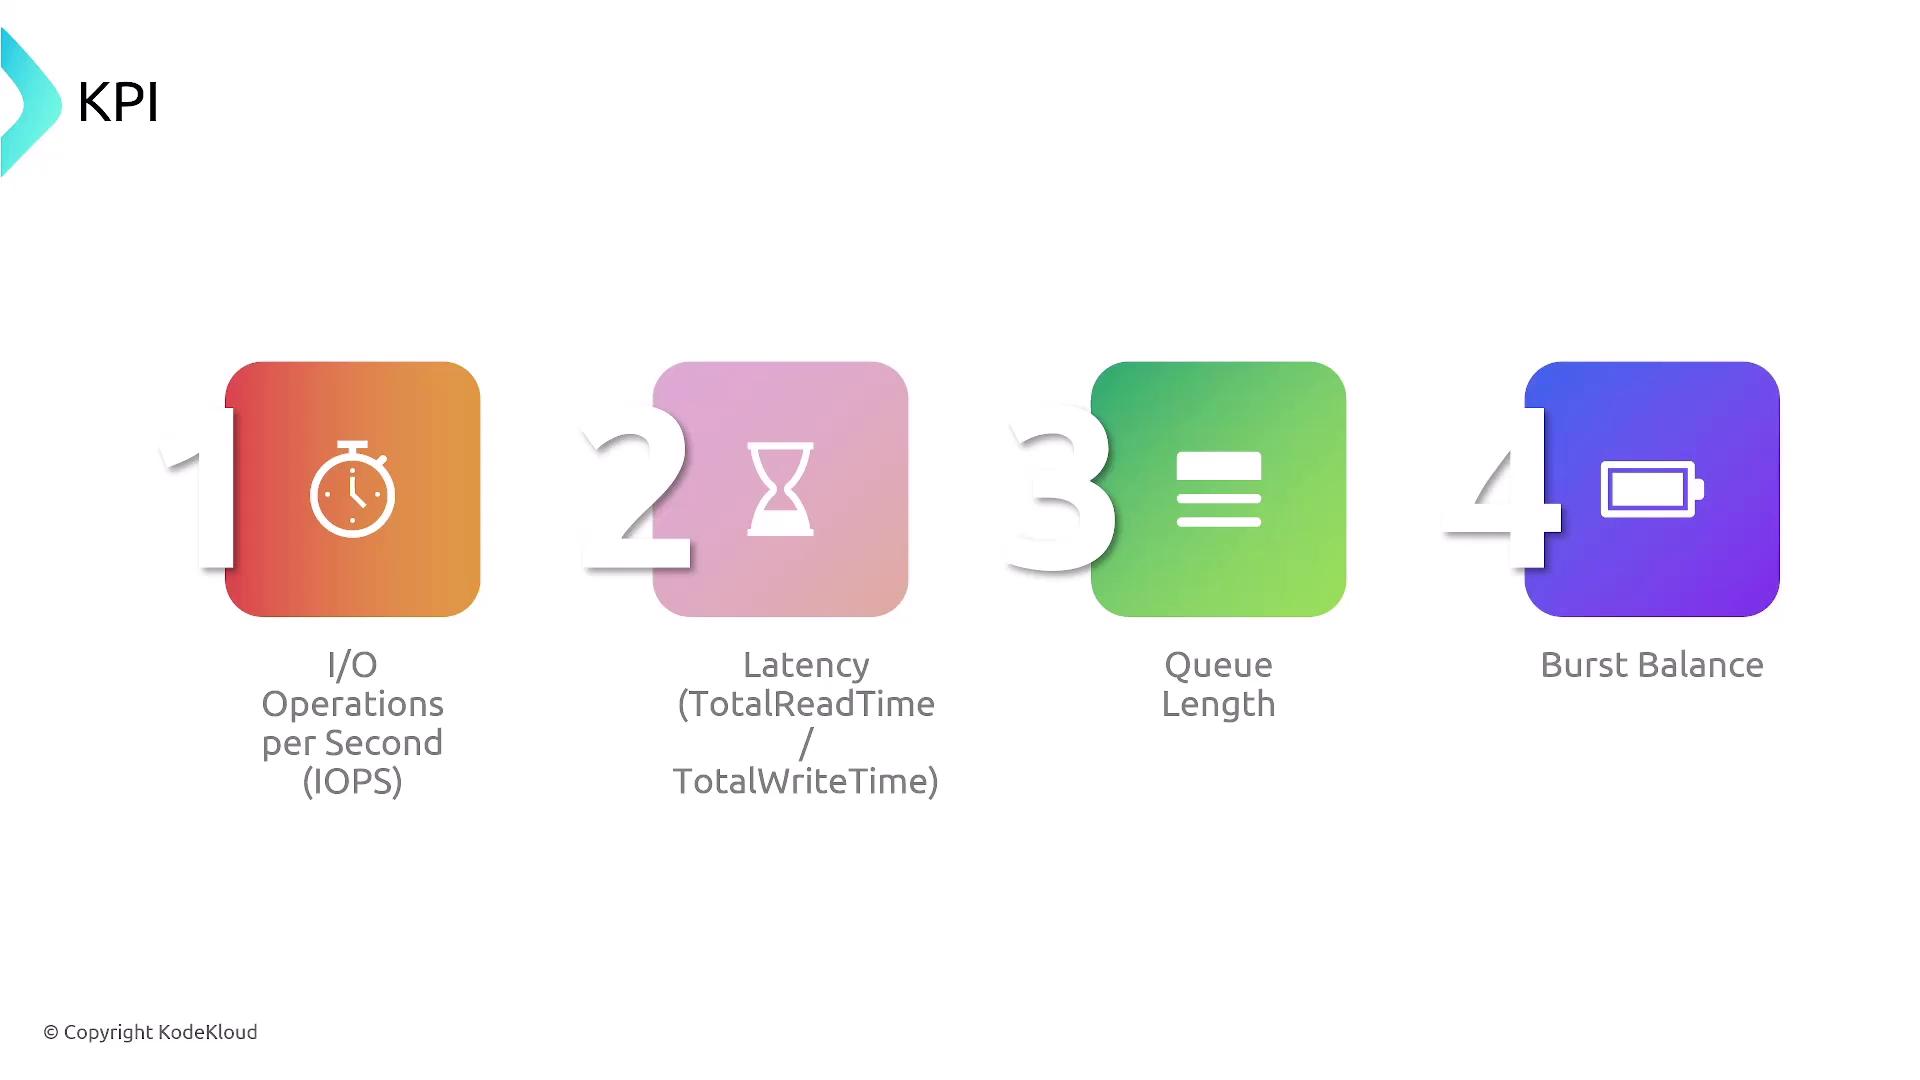
IOPS (I/O Operations Per Second):
Measures the number of read or write operations processed per second.Latency:
Represents the delay of each I/O operation, calculated from total read or write time. Higher latency translates to slower performance.Queue Length:
Also known as queue depth, an increasing number of pending requests indicates that the volume cannot handle the operations quickly enough.Burst Balance:
Especially important for GP2 volumes, burst balance provides insight into the available burst capacity. In some GP3 scenarios, this metric can also be monitored.
The diagram below clearly illustrates these key performance indicators with corresponding icons:
Configuring CloudWatch Alarms
CloudWatch alarms allow you to set alerts based on specific metrics. For instance, you can configure an alarm for the Total Read Time to notify you if it exceeds a threshold.
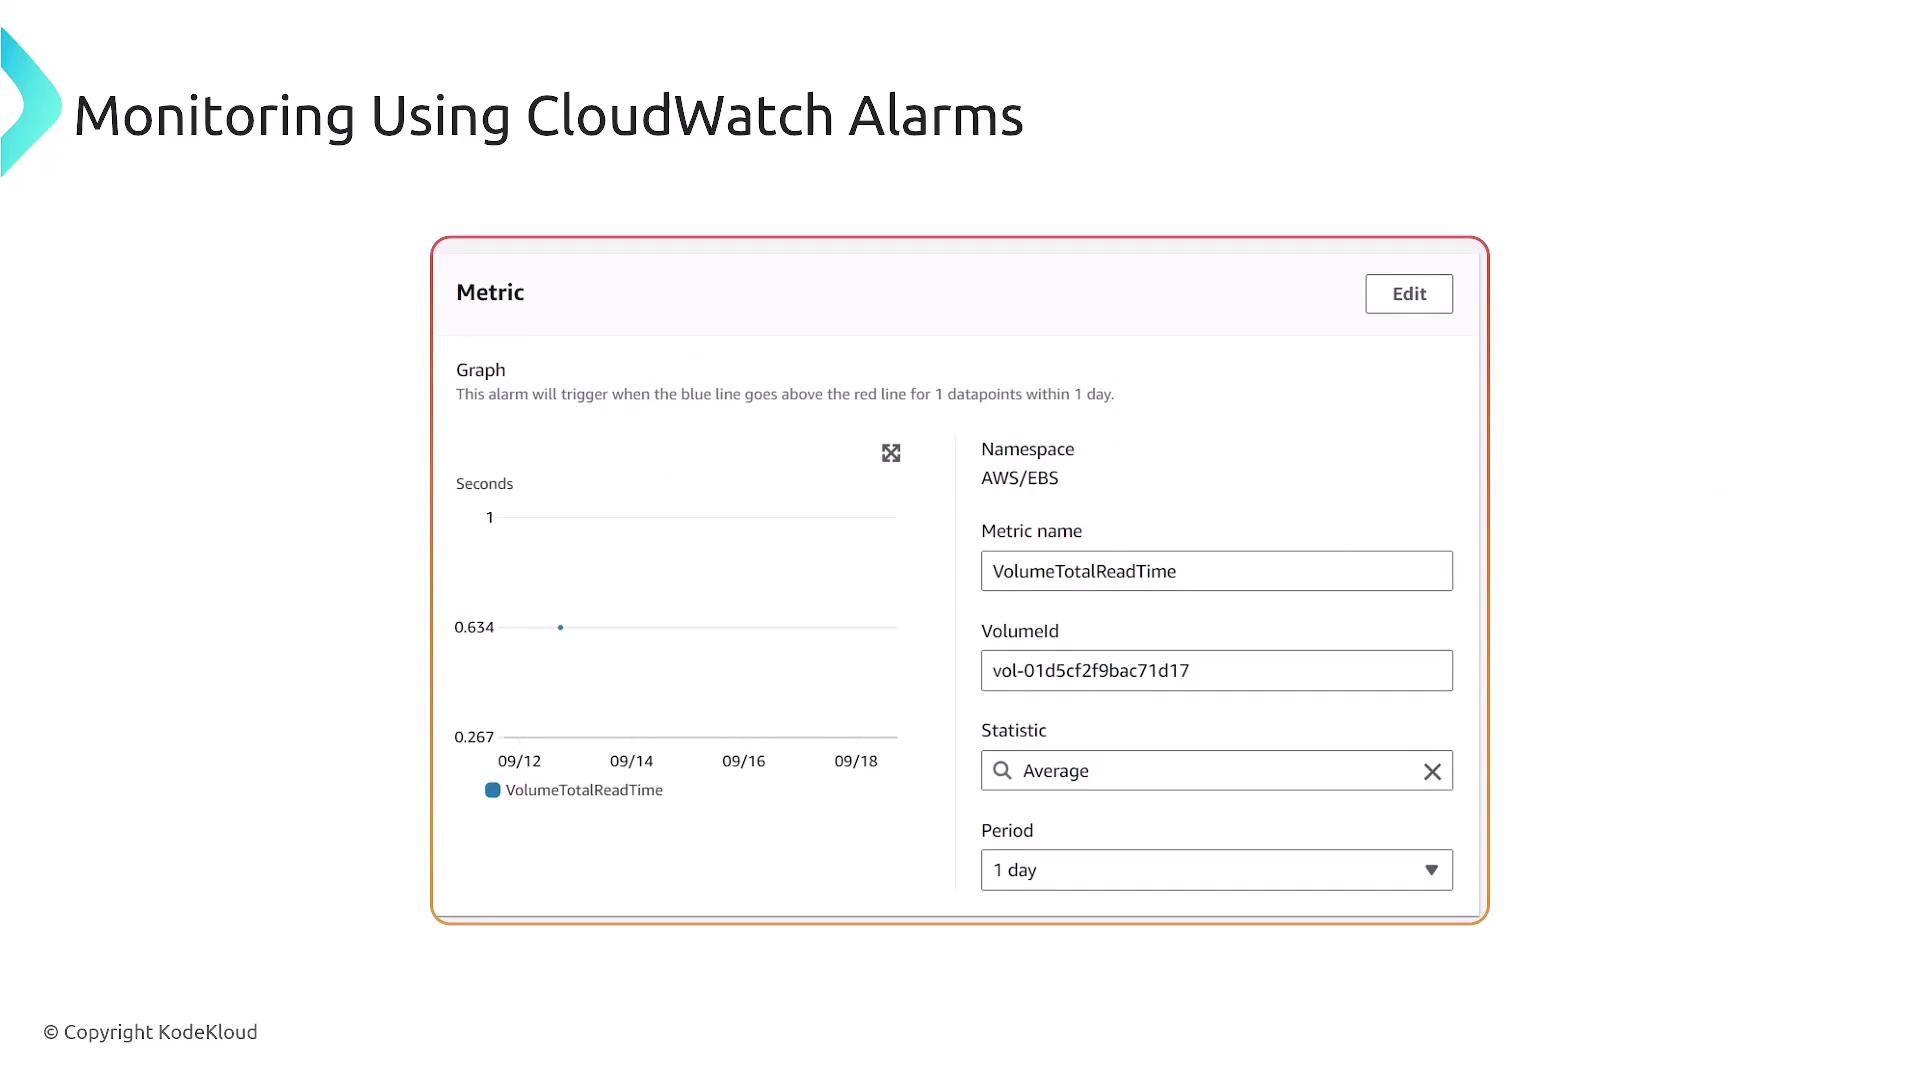
The monitoring period could span several days. If the volume displays minimal activity, the graph will reflect this accordingly. You can create alarms with various threshold conditions. For example:
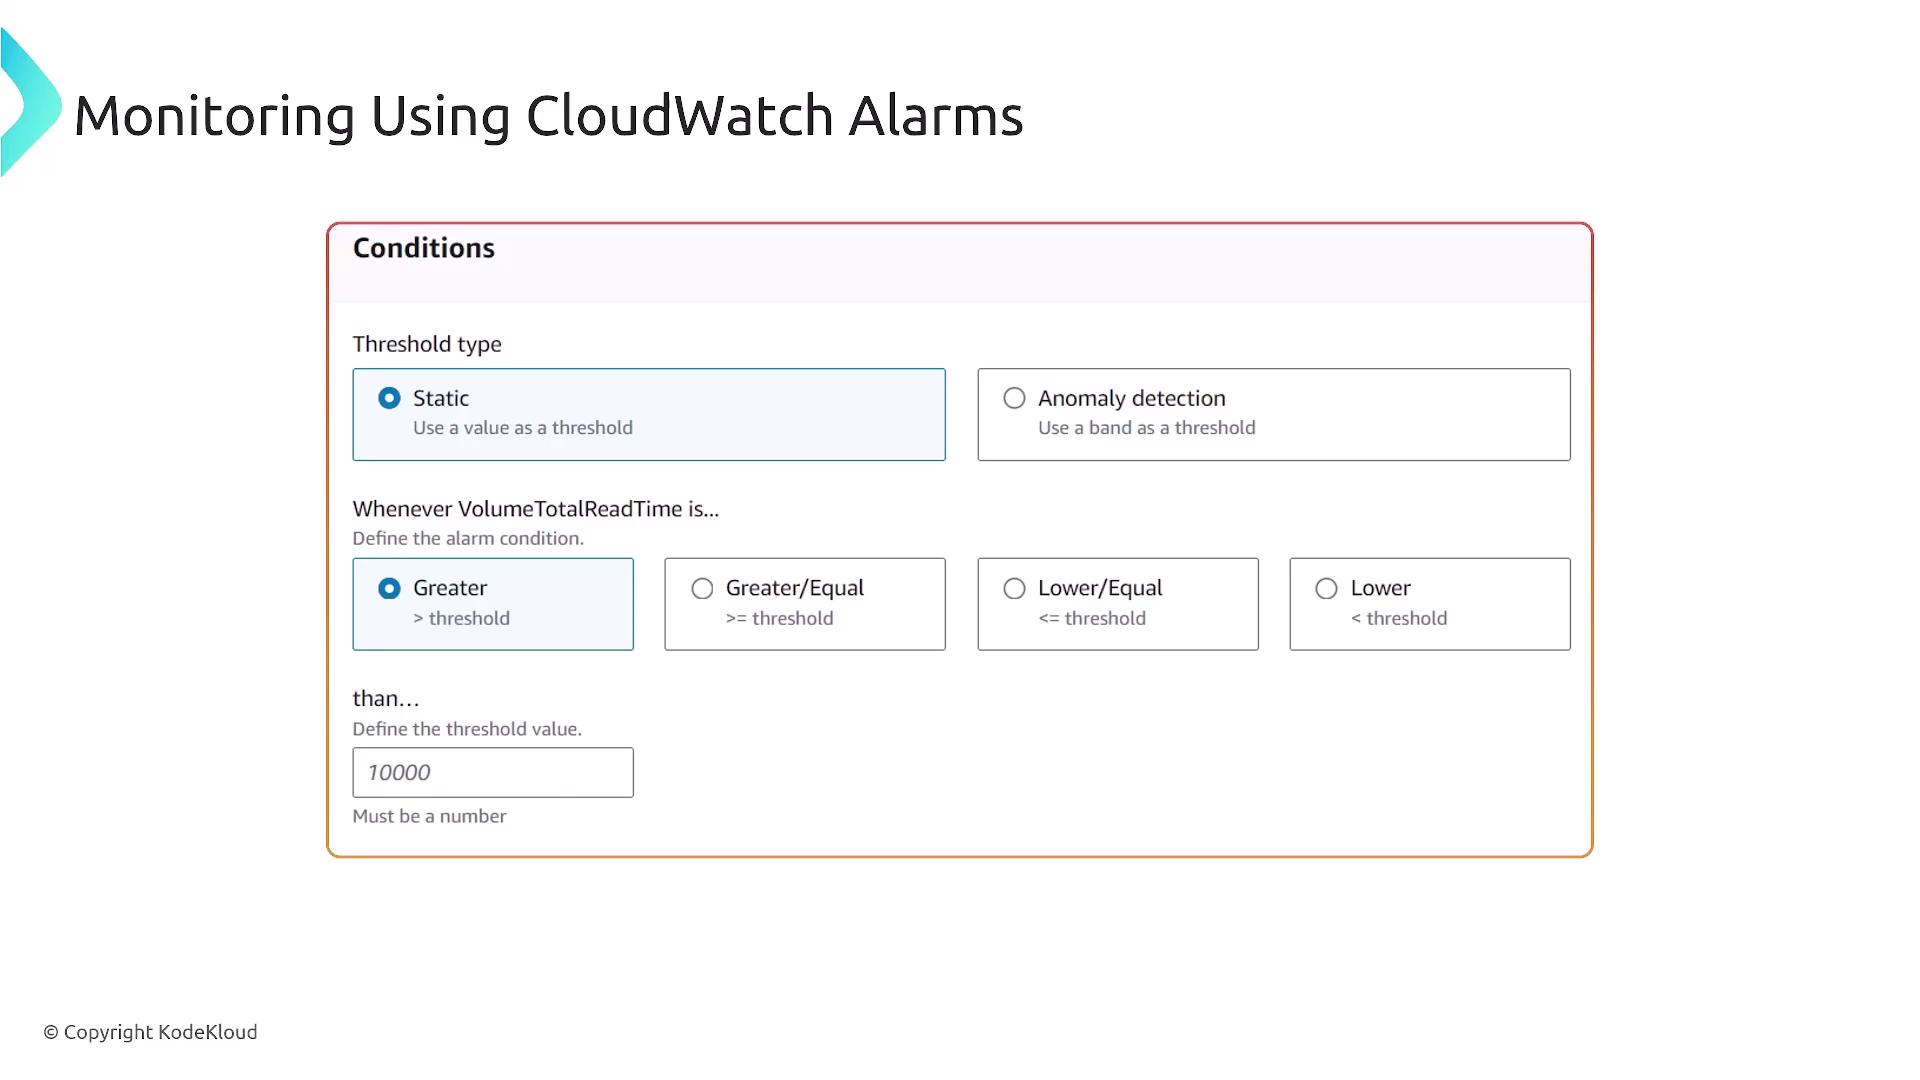
You have the flexibility to define conditions using operators such as greater than, greater than or equal to, less than, or less than or equal to. Moreover, alarms can automatically trigger corrective actions like sending notifications via SNS or calling a Lambda function.
Note
Be sure to review and adjust your alarm thresholds and configurations regularly to ensure optimal monitoring and quick response to any performance issues.
Summary
To summarize, the key metrics for monitoring EBS volumes include:
- Read and write operations (including the number of bytes transferred)
- Total operational times for read and write requests
- Queue length (queue depth)
- Burst balance (notably for GP2 volumes)
- IOPS and latency
It is essential to monitor these metrics carefully. For instance, a high queue length is an indication that the volume is overwhelmed, which could lead to performance bottlenecks. CloudWatch alarms offer the ability to proactively detect and address such issues, ensuring your EBS volumes operate efficiently.
Thank you for following along in this lesson.
Watch Video
Watch video content