1. Accessing Synthetic Canaries
- Sign in to the AWS Management Console.
- Navigate to CloudWatch under Services.
- In the left pane, select Synthetics > Canaries.
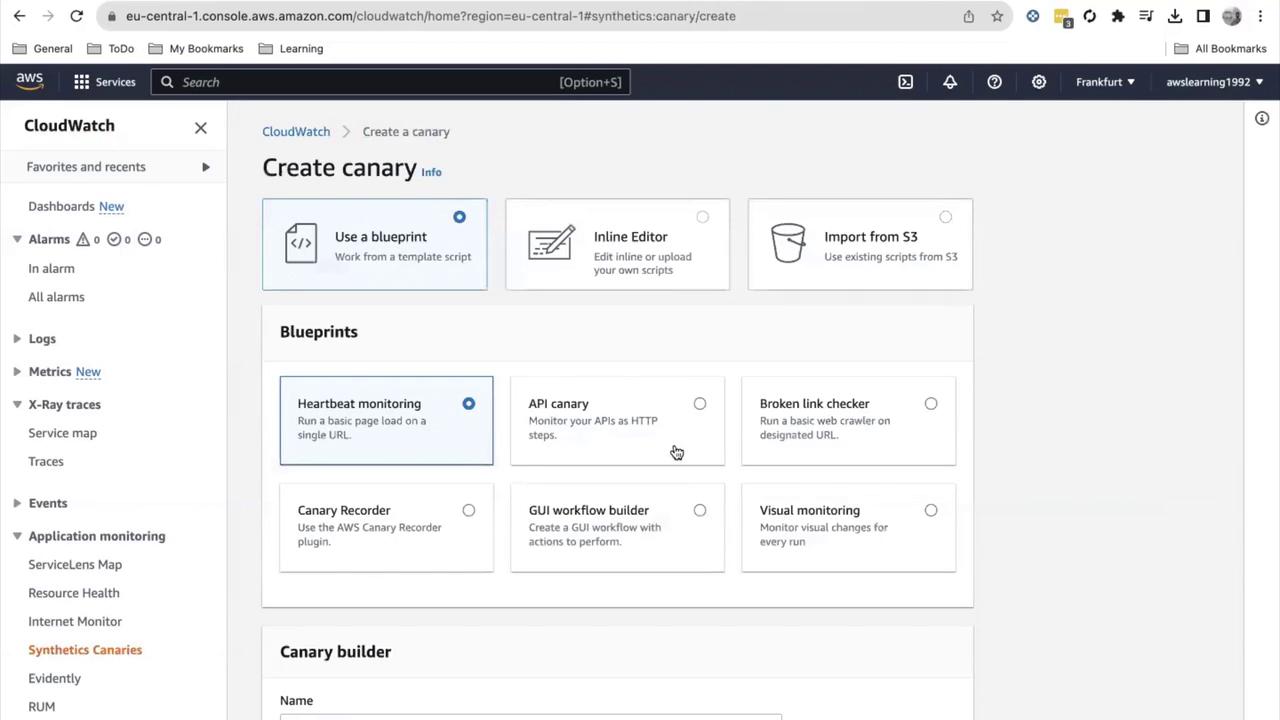
- Click Create Canary.
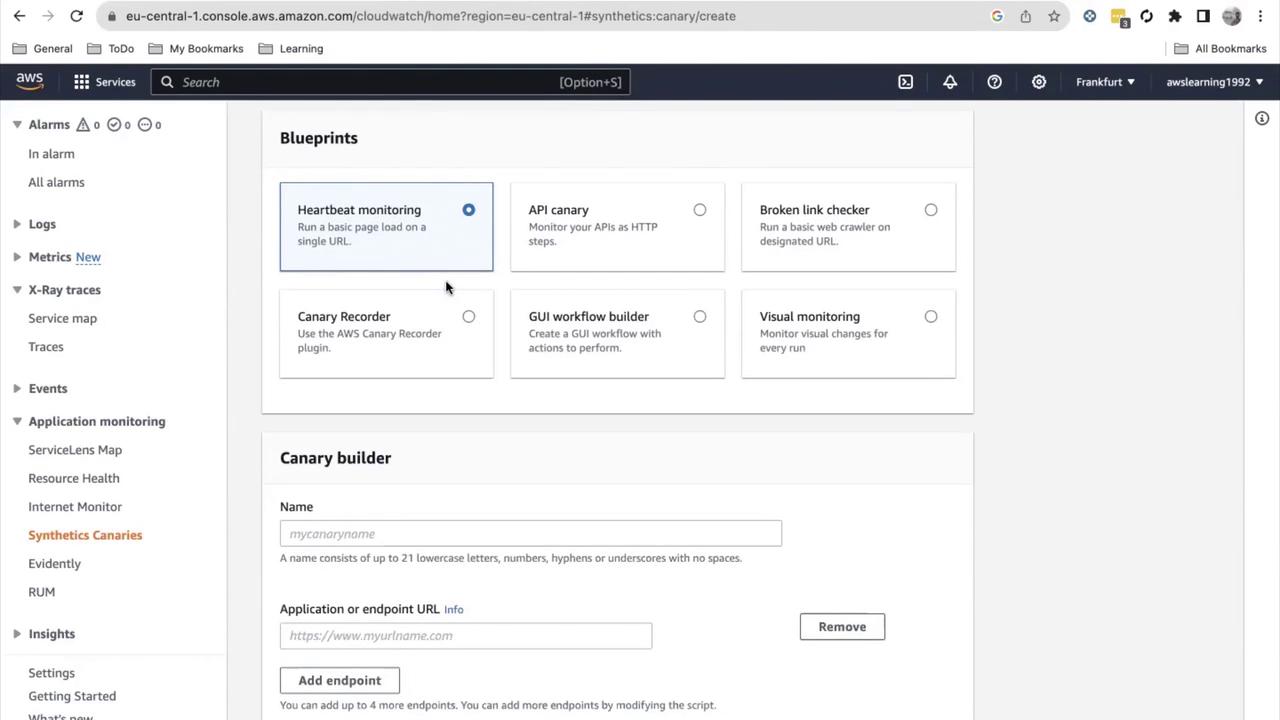
| Blueprint Type | Purpose | Example Use Case |
|---|---|---|
| Heartbeat monitoring | Simple URL availability check | Verifying your landing page uptime |
| API canary | REST API endpoint validation | Monitoring backend API performance |
| Visual monitoring | Browser-based UI element tests | Checking login page elements |
| Custom script | Upload your own Node.js script | Complex workflows or multi-step flows |
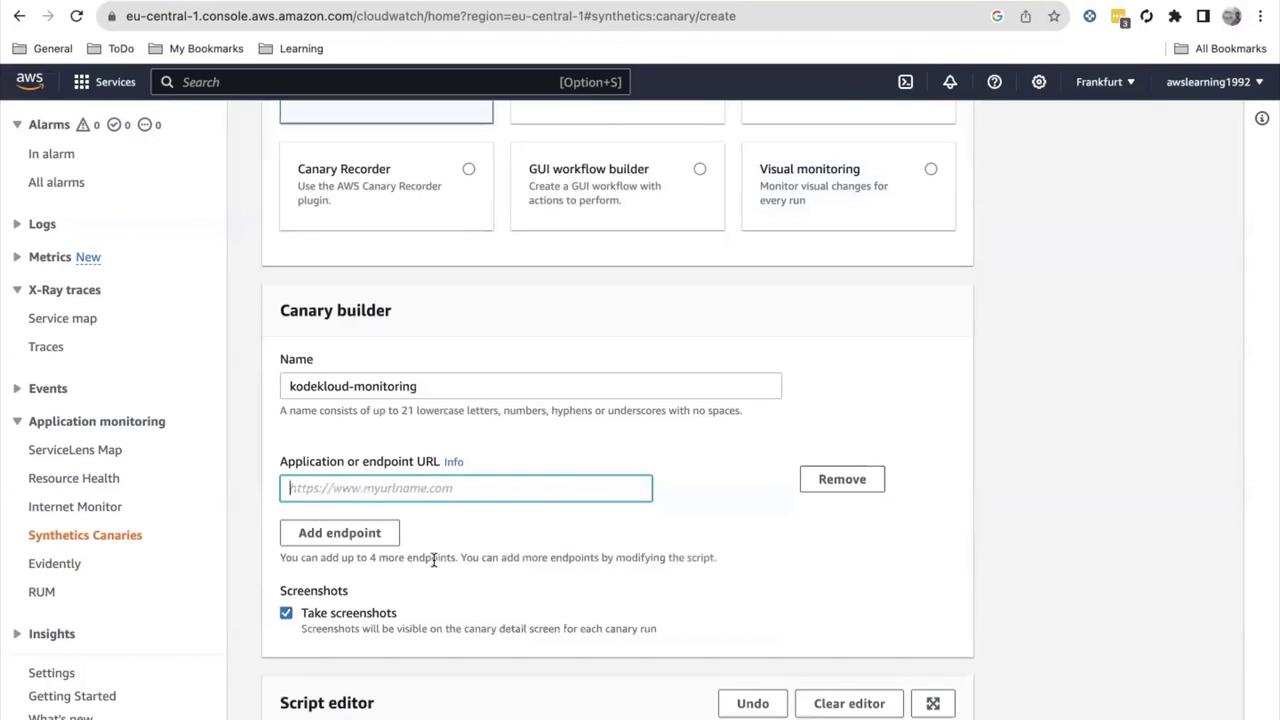
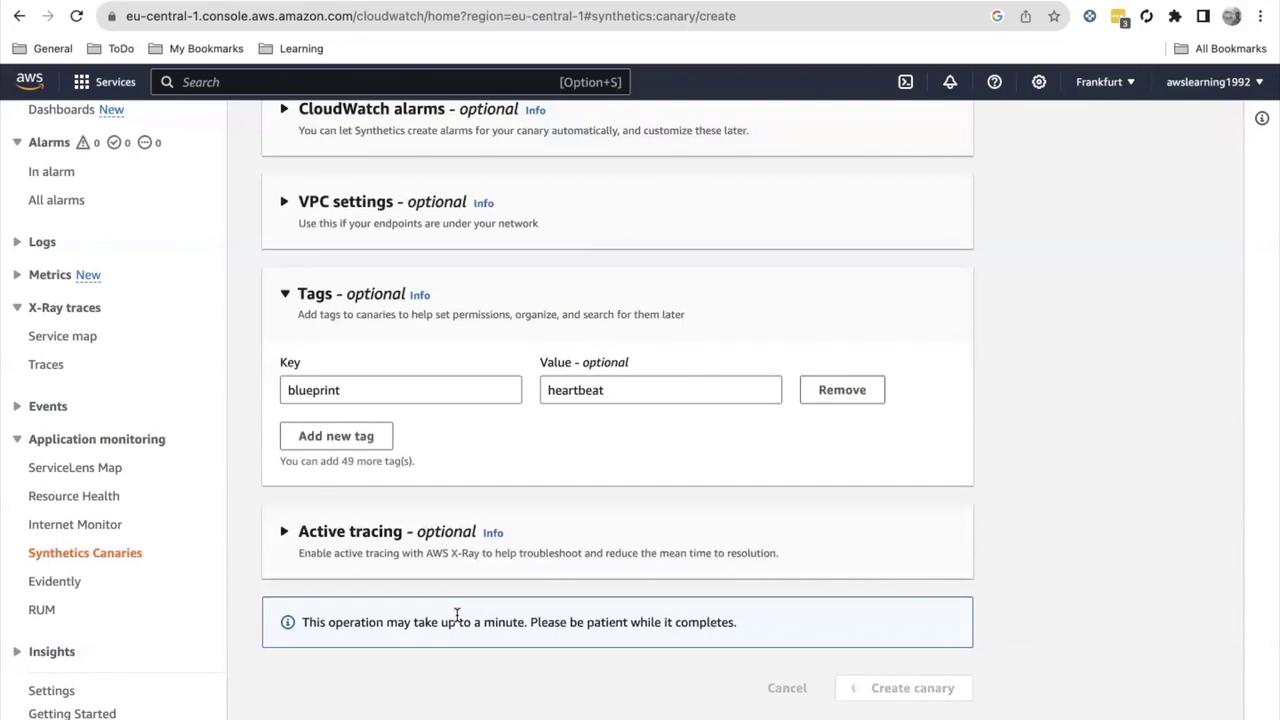
2. Configuring the Canary
- Under Select blueprint, choose Heartbeat monitoring.
- Enter Name:
KodeKloud-monitoring. - Provide the Endpoint URL, e.g.,
https://www.kodekloud.com.
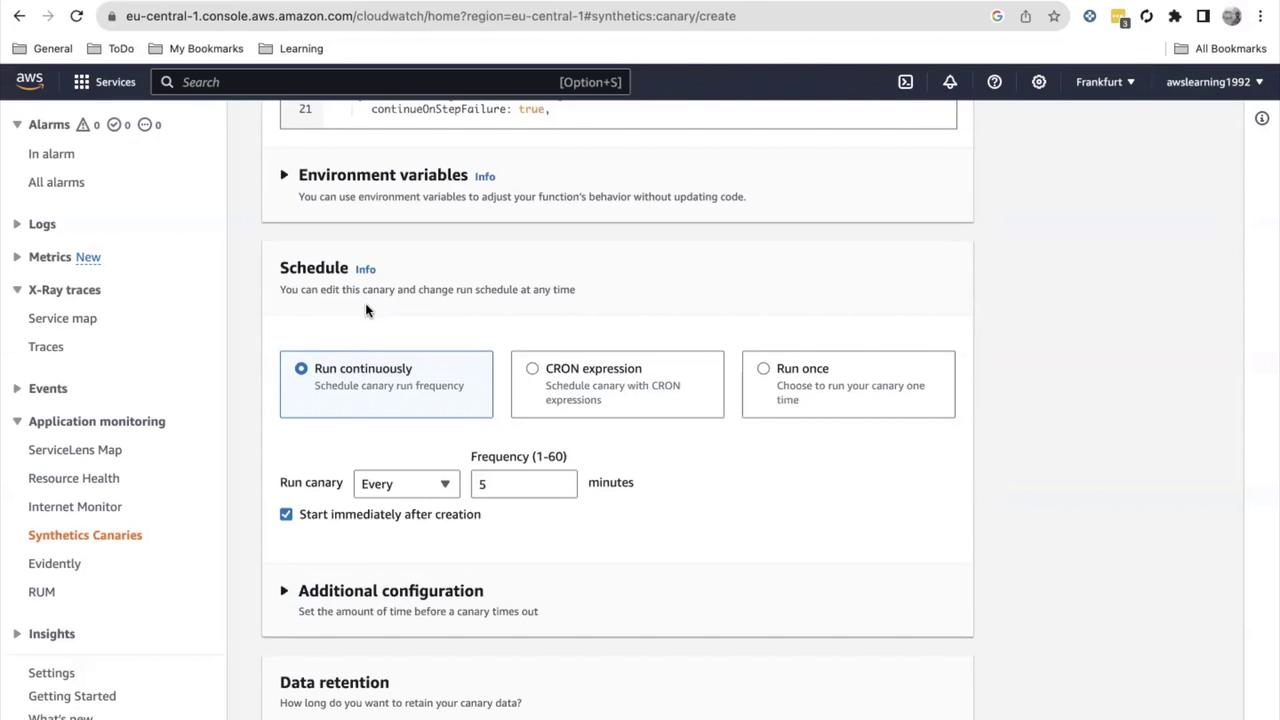
3. Scheduling Executions
Select a run schedule:- Run continuously (minimum 1-minute interval)
- Run on schedule (CRON expression)
- Run once
Running a canary every minute can increase AWS charges. Adjust the interval to balance cost and monitoring needs.
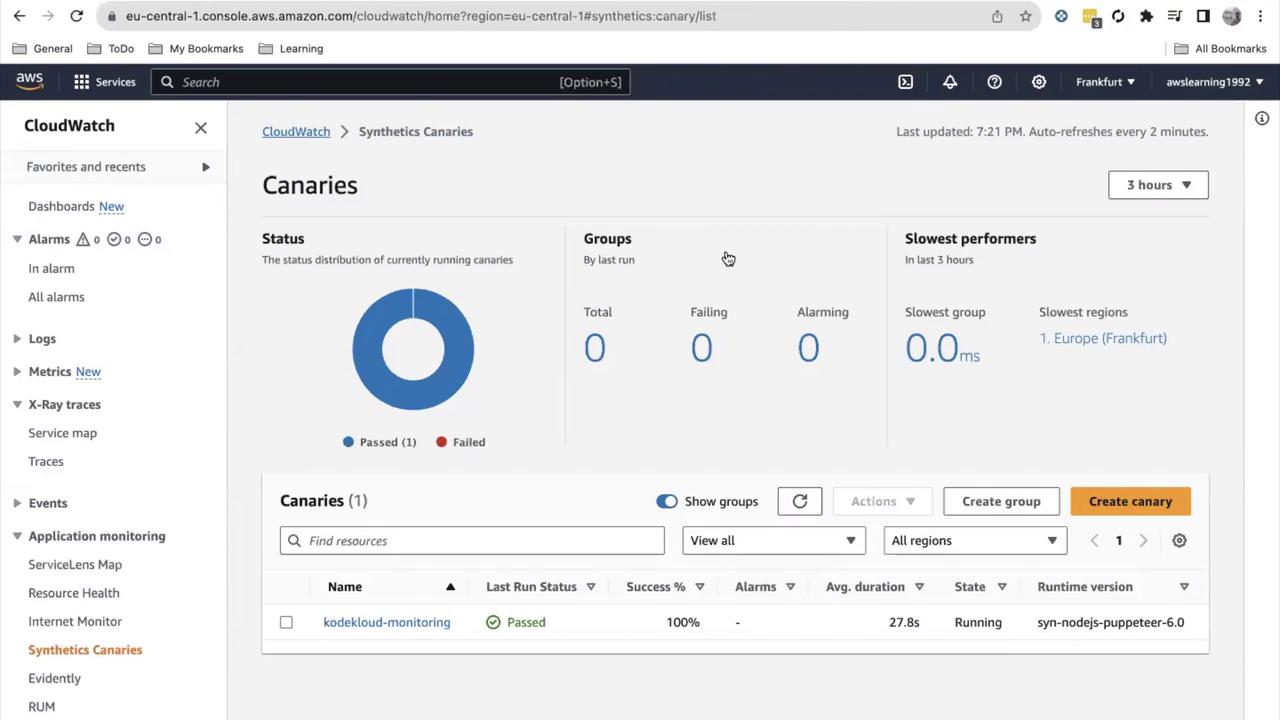
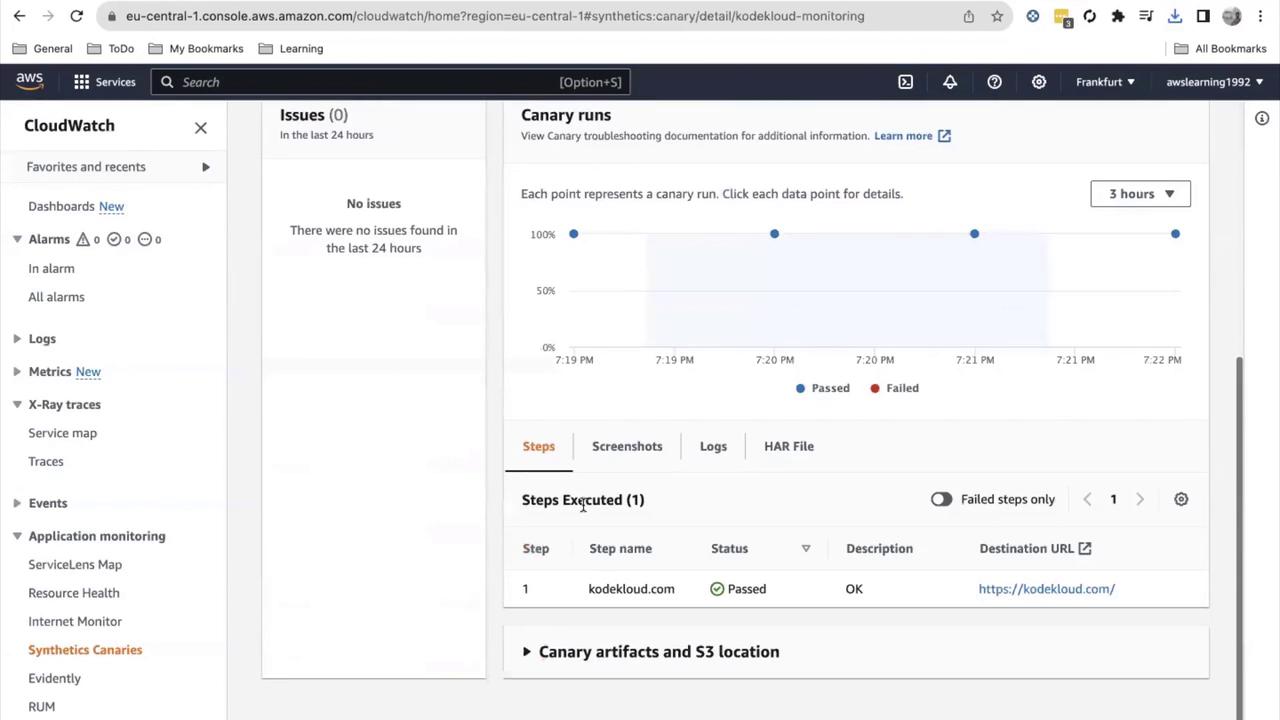
4. Monitoring Canary Metrics
After the canary is active, return to the Synthetics dashboard to view:- A pie chart of passed vs. failed runs
- Average runtime, status, and success rate
- Steps Executed: Each scripted step (e.g., open URL)
- Screenshots: Page captures at each step
- Logs: Console output from the script
- HAR file: HTTP archive for detailed analysis
- Execution info: Timestamps, duration, runtime environment
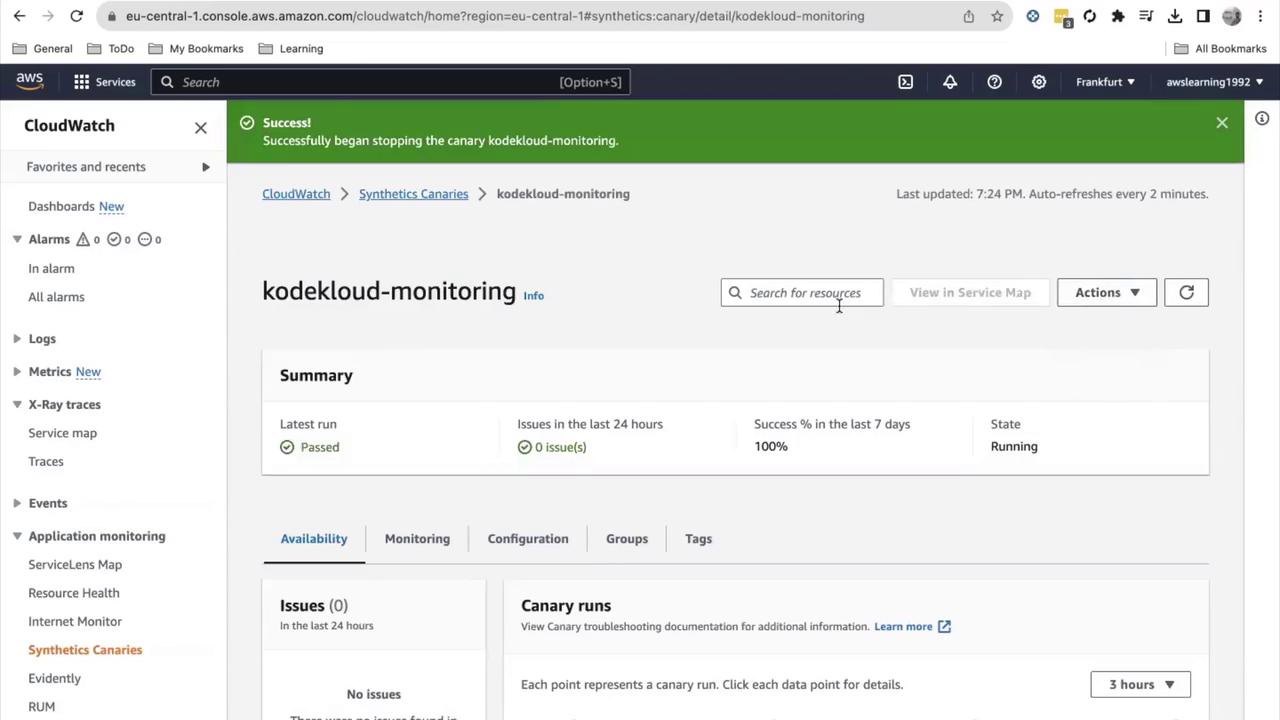
5. Pausing and Stopping a Canary
To stop a running canary:- In the Synthetics console, select your canary.
- Click Actions > Stop.
- Confirm the stop operation.
6. Organizing Canaries into Groups
Group related canaries (up to 10 per group) for streamlined management:- Navigate to Synthetics > Canary groups.
- Click Create group, specify a name, and add existing canaries.
7. Building a GUI Workflow Canary
For advanced end-to-end testing:- Click Create Canary.
- Choose a Visual monitoring or Browser-based blueprint.
- Use the Inline editor or Import from S3 for custom Node.js scripts.
- Validate login flows
- Measure form submission times
- Navigate menus and verify element visibility
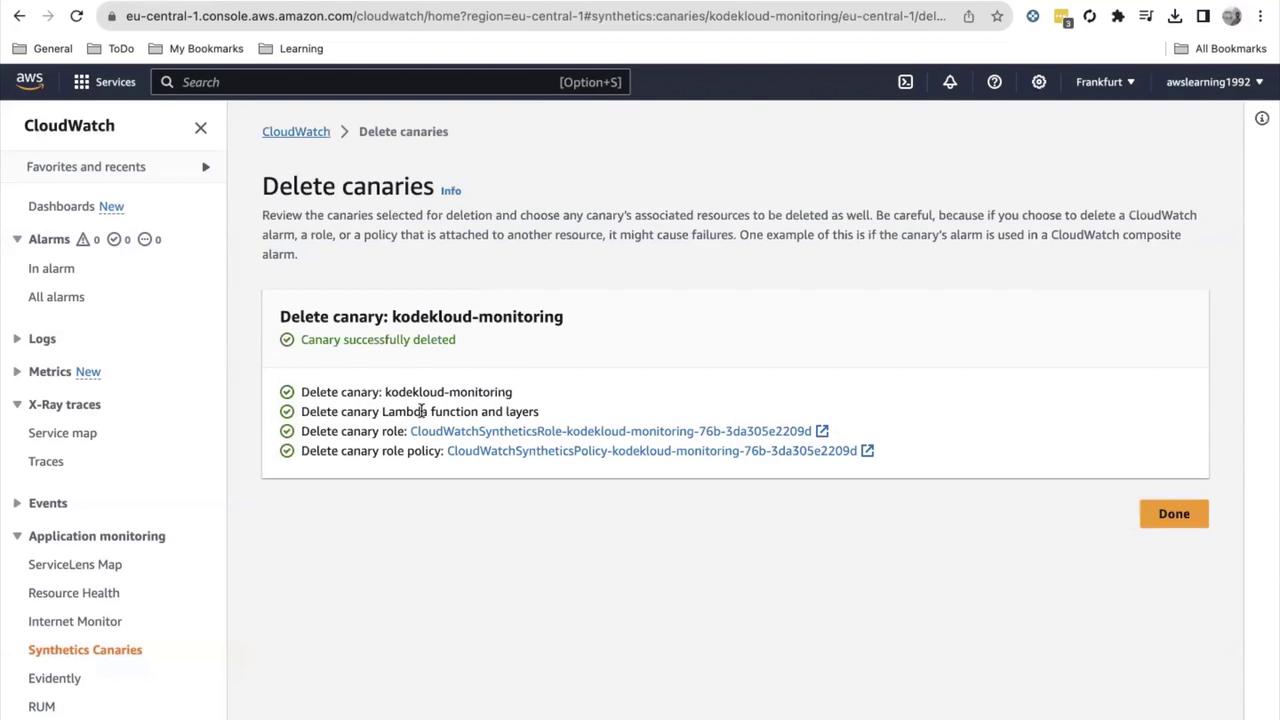
8. Deleting a Canary
When a canary is no longer needed:- Select it in the Synthetics console.
- Choose Actions > Delete.
- Optionally remove its IAM role.
If deletion fails, ensure the canary is stopped before retrying.