Historical Background: Coal Mines and Canaries
Early 20th-century coal miners used canaries to detect toxic gases like carbon monoxide and methane. Because canaries are more sensitive, their distress signaled miners to evacuate before gas levels became lethal.

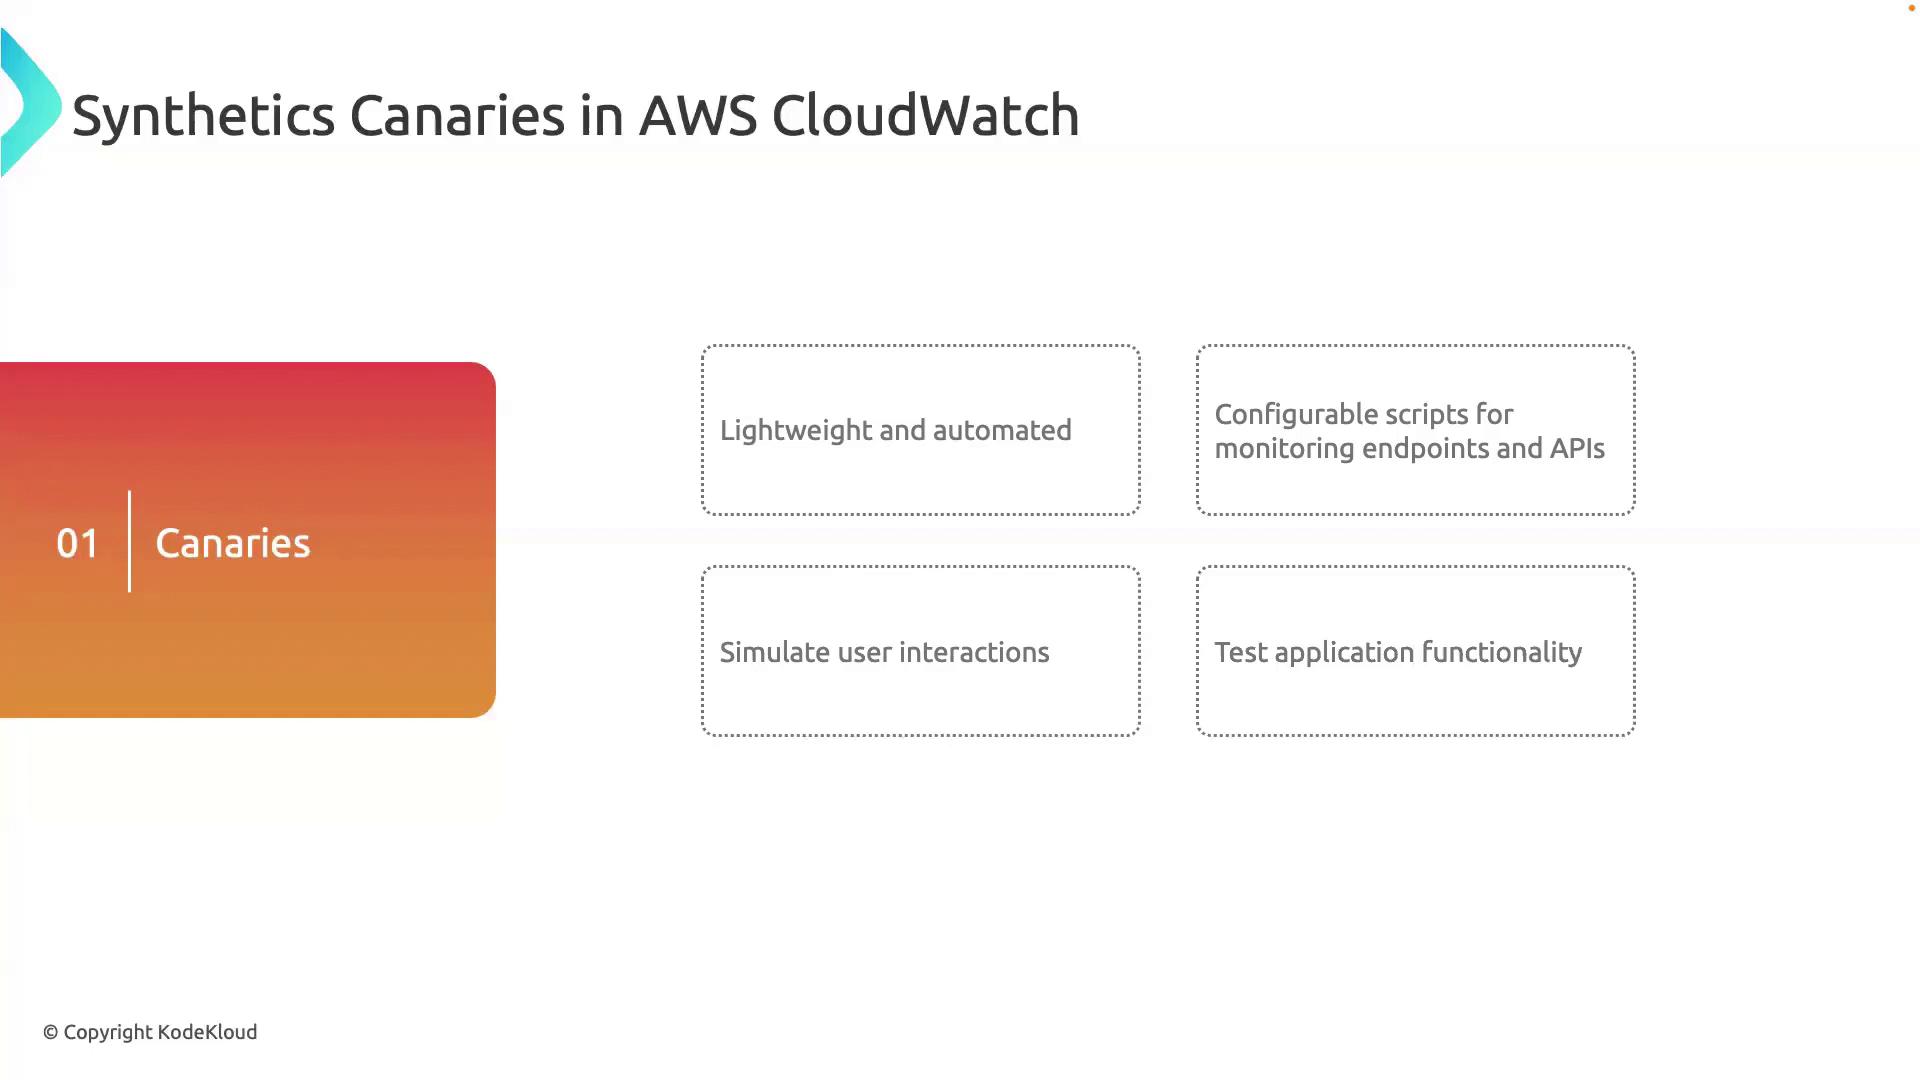
What Are Synthetic Canaries?
Synthetic Canaries in AWS CloudWatch are automated scripts running on a schedule to test your application’s endpoints, APIs, and workflows. Acting like a virtual QA team, they ensure availability and functionality.- Fully managed, serverless monitoring
- Scripts written in Node.js or Python
- Simulate real user actions (navigation, clicks, form submissions)
Synthetic Canaries support Selenium/WebDriver in Node.js and Python for custom workflows.
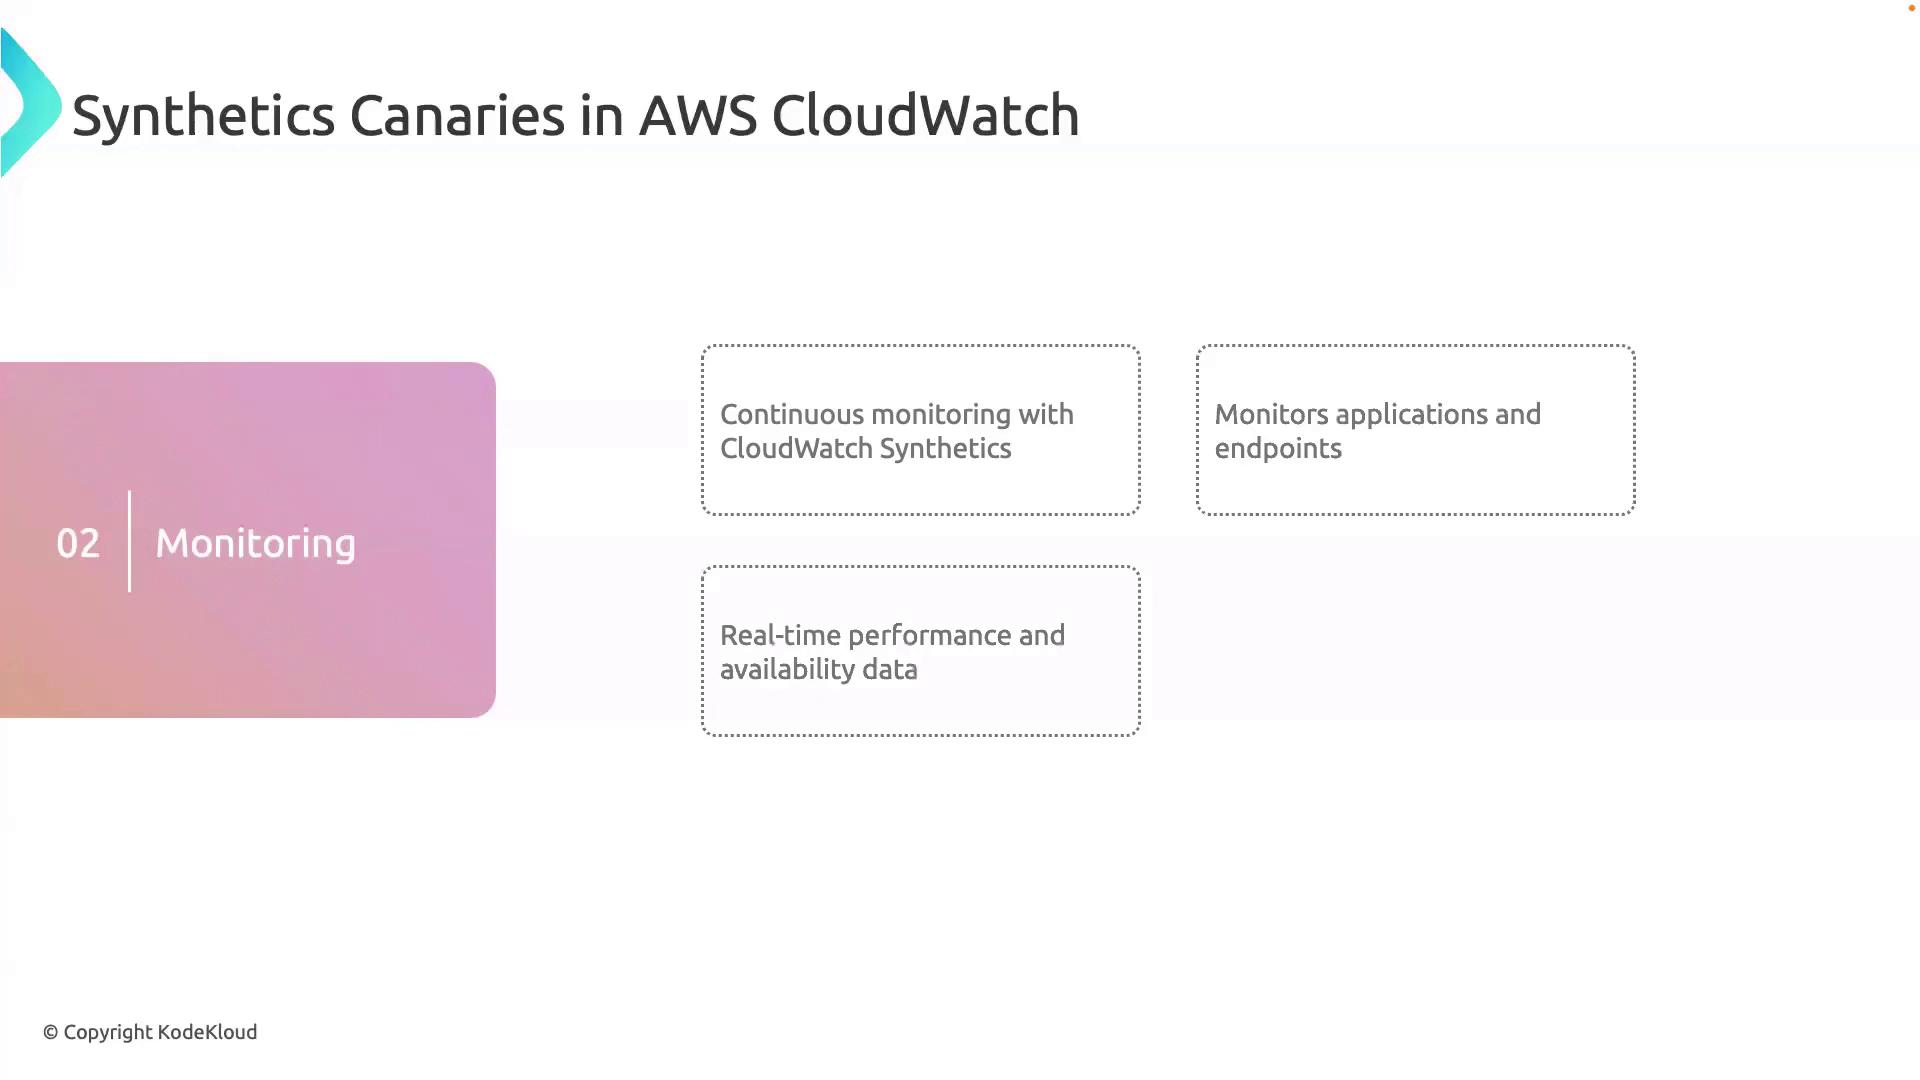
Continuous Monitoring and Performance Insights
With CloudWatch Synthetics, you gain real-time visibility into availability and performance metrics:- Measure response times and latency distributions
- Track HTTP status codes and error rates
- Trigger alerts on threshold breaches
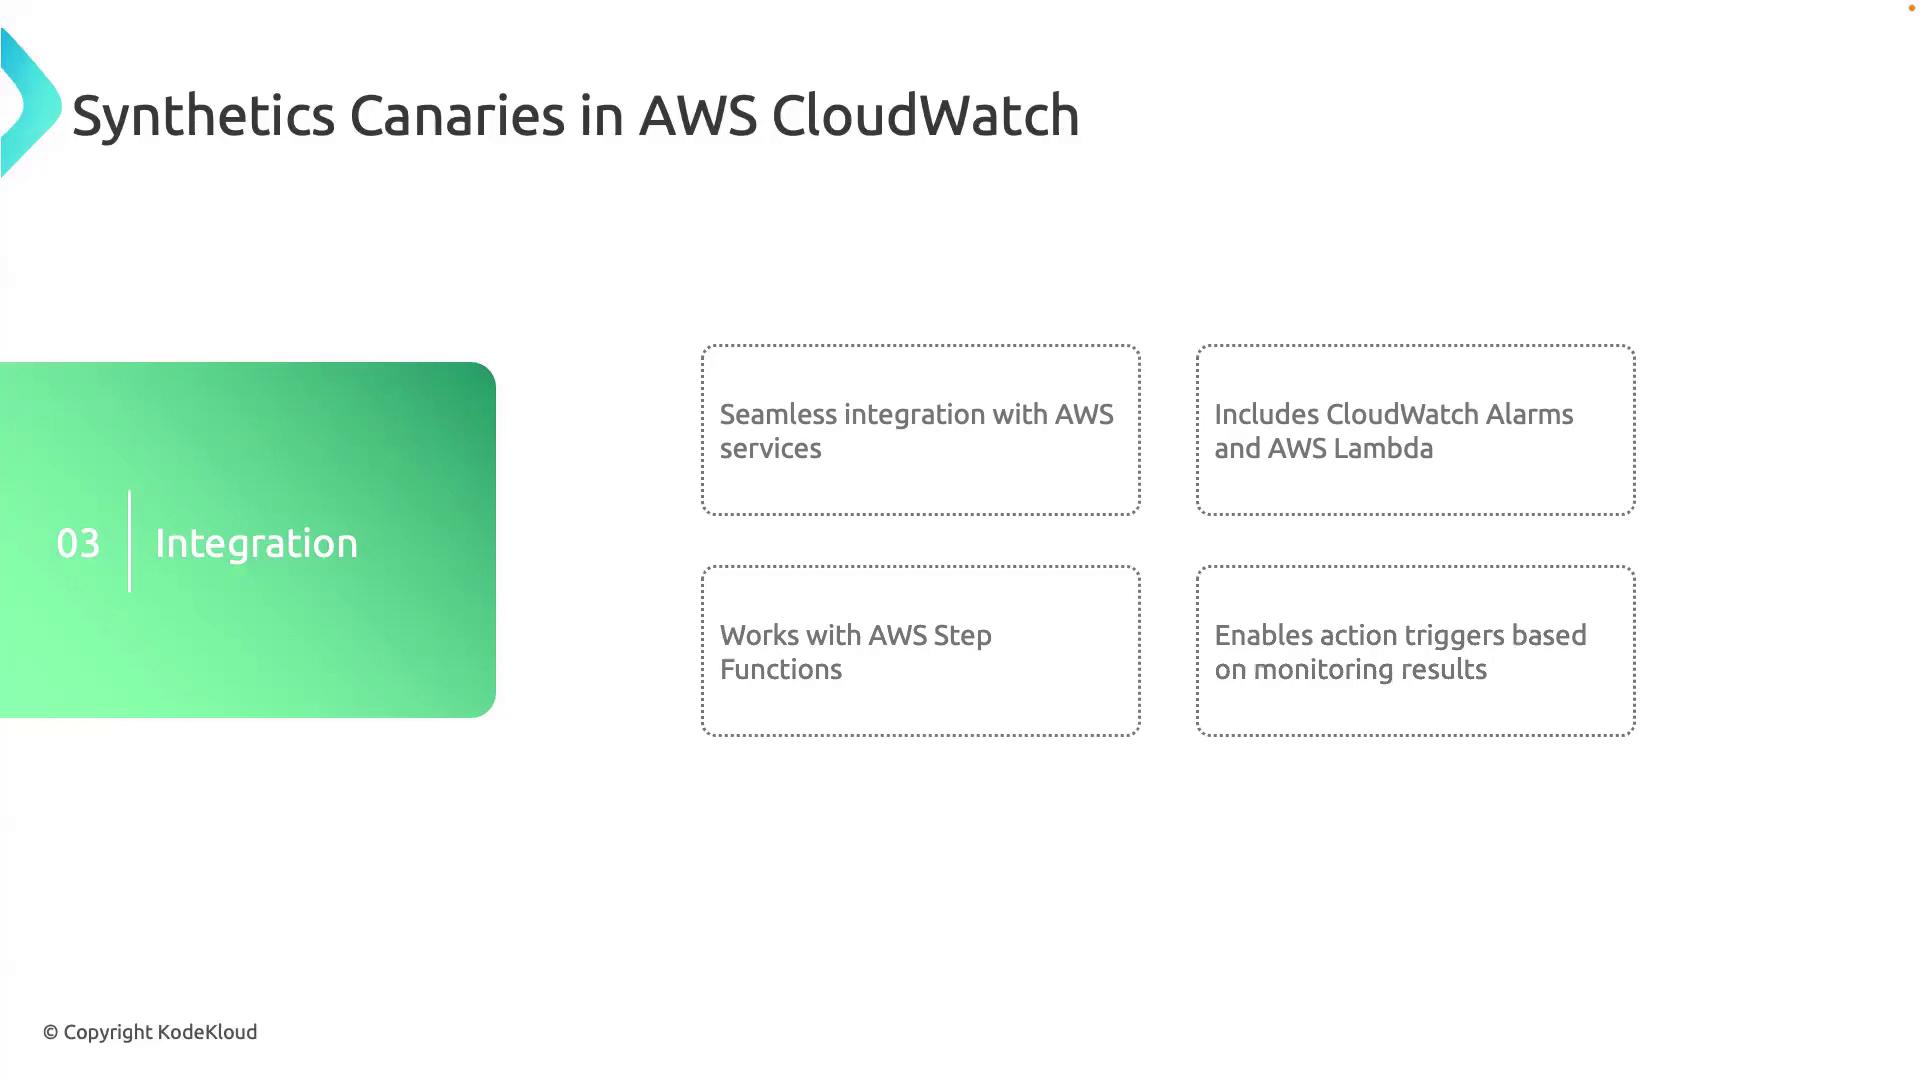
Seamless Integration with AWS Services
Synthetic Canaries connect monitoring events to automated workflows across AWS:| AWS Service | Use Case | Example |
|---|---|---|
| CloudWatch Alarms | Trigger alerts on canary failures | Create an alarm on the CanaryFailed metric |
| AWS Lambda | Run remediation scripts or rollbacks | Invoke a Lambda function to restart a service |
| Step Functions | Orchestrate multi-step incident workflows | Chain alerts, notifications, and recovery actions in a state machine |
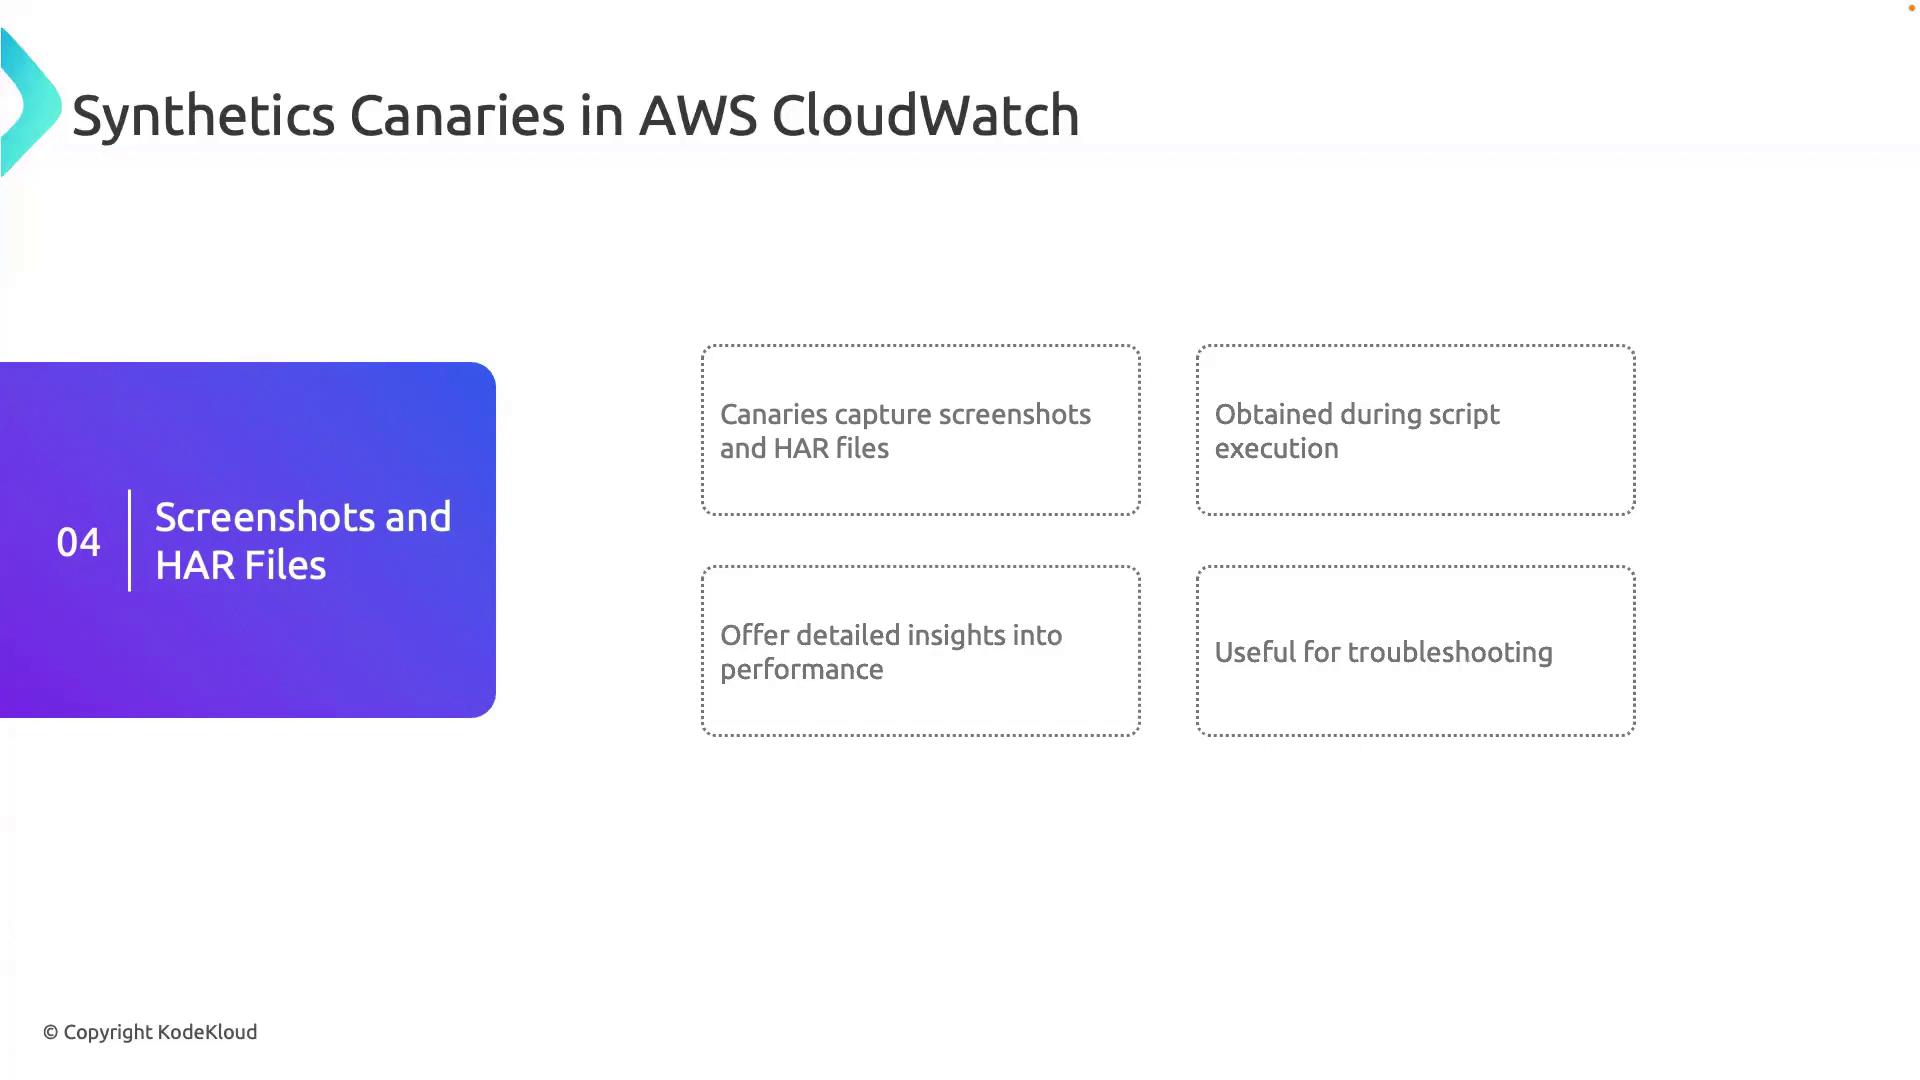
Diagnostics: Screenshots and HAR Files
When a canary runs, it captures artifacts for in-depth analysis:- Full-page screenshots at key script steps
- HAR (HTTP Archive) files with detailed request/response traces
Metrics and Logs Analysis
Every canary execution emits CloudWatch metrics and logs. Use CloudWatch Logs Insights and dashboards to:- Track success/failure rates over time
- Correlate latency spikes with deployments
- Drill into error stack traces for root-cause analysis
Cost Considerations for Canary Execution
Synthetic Canaries use a pay-as-you-go model:| Cost Component | Description |
|---|---|
| Canary runs | Charged per run based on schedule frequency |
| Compute duration | Billed per second of script execution |
| Data transfer & storage | For HAR files, screenshots, and logs retention |
Longer scripts and high-frequency runs can increase costs. Regularly review your canary schedules and artifact retention settings to optimize spend.
By deploying Synthetic Canaries in AWS CloudWatch, you gain proactive, end-to-end monitoring to maintain optimal availability and performance for your users.