| Insight Type | Primary Use Case | Key Benefit |
|---|---|---|
| Container Insights | Monitoring containerized applications (EKS, ECS, Kubernetes) | Unified metrics and logs for clusters |
| Lambda Insights | Observability for AWS Lambda functions | Spot function outliers and memory leaks |
| Contributor Insights | High-cardinality event analytics for microservices | Pinpoint source of errors and slowdowns |
| Application Insights | End-to-end web application monitoring | Auto-detect errors and performance issues |
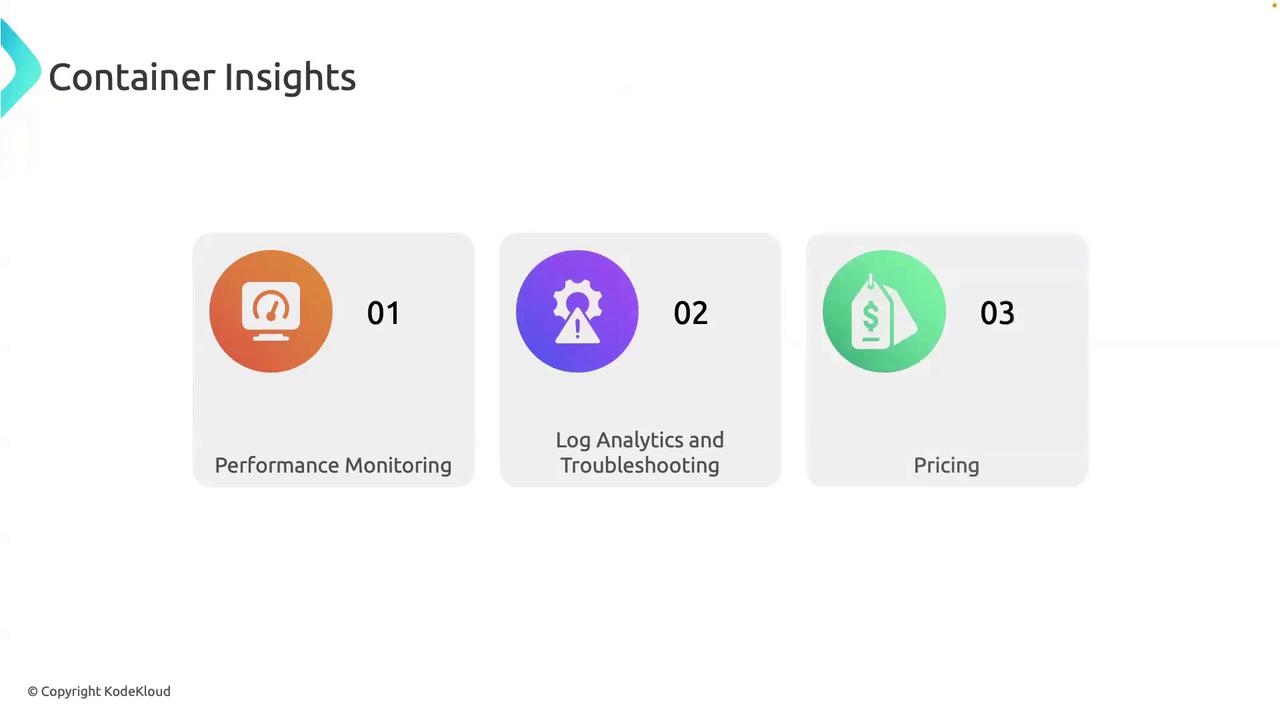
Container Insights
When running microservices in containers, you need a holistic view of CPU, memory, network, and logs—all in one dashboard. Container Insights collects, aggregates, and visualizes these metrics so you can take action before small issues become outages.Key Features
| Feature | Description |
|---|---|
| Performance Monitoring | Track CPU, memory, disk I/O, and network throughput in real time. |
| Log Analytics & Troubleshooting | Search, filter, and correlate container logs across clusters. |
| Auto-Scaling Integration | Trigger scaling policies based on custom metrics from your workloads. |
| Pay-As-You-Go Pricing | Only pay for the metrics and logs you collect; no upfront costs. |
You can enable Container Insights via the AWS Management Console, CLI, or CloudFormation in just a few clicks—no code changes required.
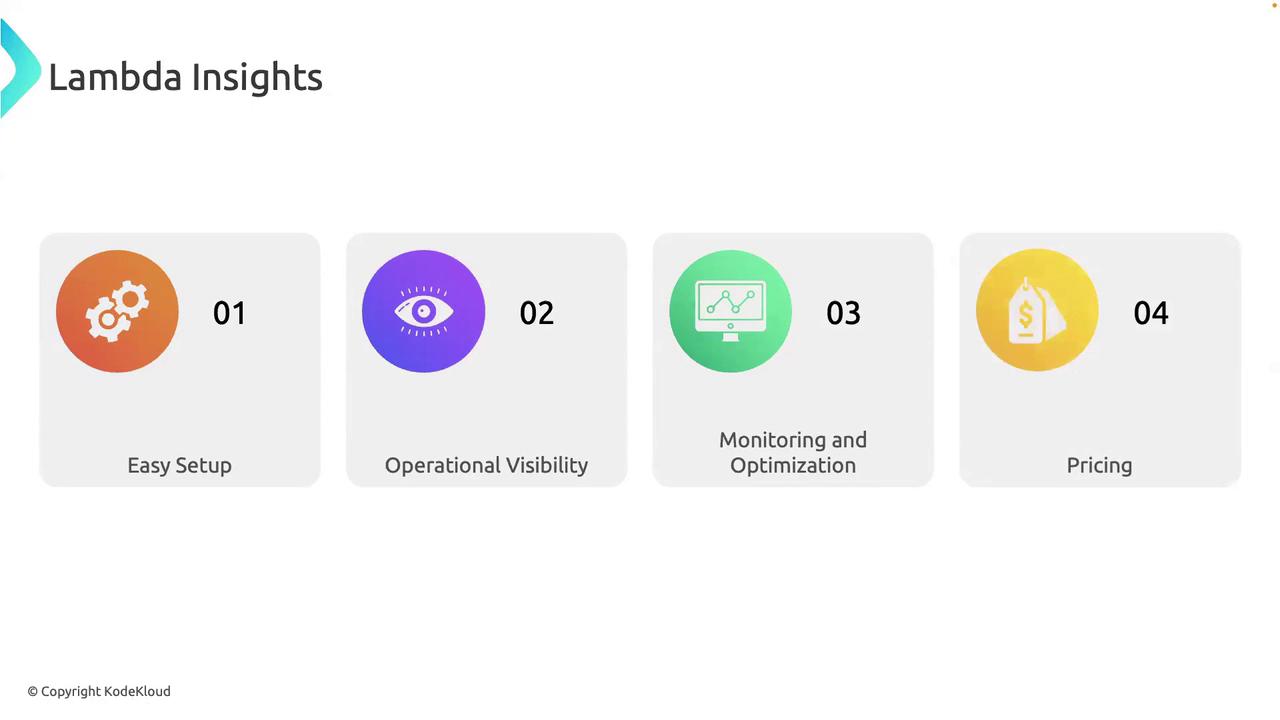
Lambda Insights
If your architecture relies on AWS Lambda for event-driven workloads (e.g., S3 triggers, EventBridge rules), Lambda Insights centralizes performance metrics and logs so you don’t have to investigate each function separately.
Key Features
- Easy Setup: Enable instrumentation without modifying your existing code or deployment pipeline.
- Real-Time Metrics: Monitor execution duration, memory usage, cold starts, and concurrency.
- Bottleneck Detection: Quickly identify functions that exceed thresholds or show anomalous behavior.
- Cost Allocation: Break down Lambda charges by function to optimize spend.
Lambda Insights incurs a small additional cost per metric and log, but gives you actionable data to reduce overall Lambda spend.
Contributor Insights
Contributor Insights provides real-time analytics on high-cardinality data (user IDs, API endpoints, order IDs) so you can pinpoint which component in your transaction pipeline is causing issues.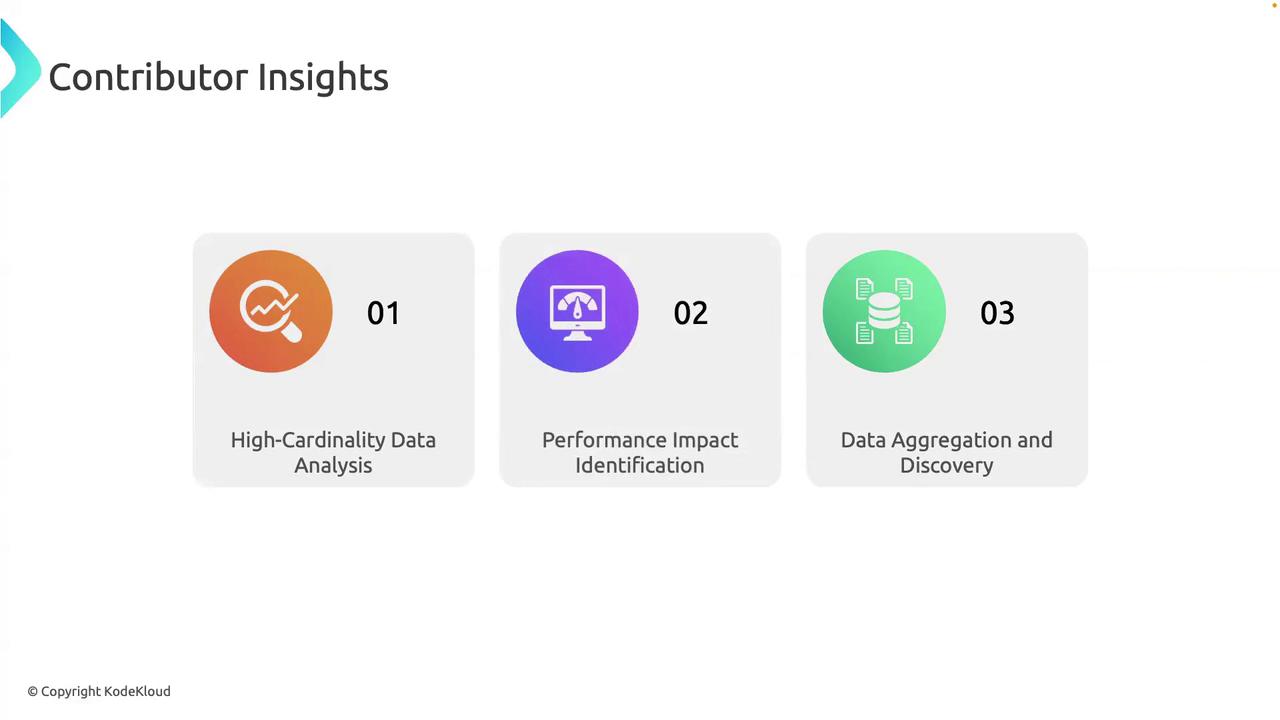
Key Features
| Feature | Benefit |
|---|---|
| High-Cardinality Analysis | Drill into unique keys (e.g., user ID, session ID) to spot hotspots. |
| Performance Impact Identification | Correlate slow API calls or retries with downstream resource errors. |
| Trend Aggregation & Alerts | Aggregate events over time, set thresholds, and receive alerts. |
Contributor Insights shines as your microservice count grows. Use it proactively in production to detect anomalies early.
Application Insights
For full-stack web applications—like a live video streaming site—Application Insights offers automatic error detection, performance tracing, and dependency mapping to keep end users happy.
Key Features
- Web Application Monitoring: Auto-discover exceptions, HTTP 5XX errors, and latency spikes.
- Dependency Mapping: Visualize calls to databases, caches, and external APIs.
- Telemetry Dashboard: Combine user, performance, and operational data in one view.
Application Insights adds overhead—enable it for mission-critical applications where user experience metrics are essential.
Links and References
- AWS CloudWatch Container Insights
- AWS Lambda Insights
- AWS Contributor Insights
- AWS Application Insights
- AWS CloudWatch Documentation