AWS CloudWatch

Cloudwatch Insights X Ray and Service Map

Demo Lambda Insights

In this guide, you’ll learn how to provision multiple AWS Lambda functions with CloudFormation, invoke them to generate metrics, and explore those metrics in CloudWatch using Lambda Insights.

1. CloudFormation Template

Note

Ensure that an IAM role named HelloWorldFunctionRole exists with permissions for Lambda execution and CloudWatch logging. You can define it in this template or create it beforehand.

Below is a CloudFormation YAML template that defines three Lambda functions:

Resources:
  HelloWorldFunction01:
    Type: AWS::Lambda::Function
    Properties:
      FunctionName: HelloWorldFunction01
      Runtime: python3.9
      Handler: index.handler
      Role: !GetAtt HelloWorldFunctionRole.Arn
      Timeout: 15
      Code:
        ZipFile: |
          import json
          def handler(event, context):
              print("HelloWorld from function 01")
              return {
                  'statusCode': 200,
                  'body': json.dumps('Hello from Lambda!')
              }

  HelloWorldFunction02:
    Type: AWS::Lambda::Function
    Properties:
      FunctionName: HelloWorldFunction02
      Runtime: python3.9
      Handler: index.handler
      Role: !GetAtt HelloWorldFunctionRole.Arn
      Timeout: 15
      Code:
        ZipFile: |
          import json
          def handler(event, context):
              print("HelloWorld from function 02")
              return {
                  'statusCode': 200,
                  'body': json.dumps('Hello from Lambda!')
              }

  HelloWorldFunction03:
    Type: AWS::Lambda::Function
    Properties:
      FunctionName: HelloWorldFunction03
      Runtime: python3.9
      Handler: index.handler
      Role: !GetAtt HelloWorldFunctionRole.Arn
      Timeout: 15
      Code:
        ZipFile: |
          import json
          import time
          def handler(event, context):
              print("HelloWorld from function 03")
              time.sleep(5)
              return {
                  'statusCode': 200,
                  'body': json.dumps('Hello from Lambda!')
              }

Function Summary

Function NameDescriptionTimeout
HelloWorldFunction01Prints a greeting message15 sec
HelloWorldFunction02Prints a greeting message15 sec
HelloWorldFunction03Prints a greeting after a 5-sec delay15 sec

2. Invocation Script

Generate consistent metrics by invoking each function 50 times. Save the following as lambda_call.sh and make it executable.

#!/usr/bin/env bash

for i in {1..50}; do
  aws lambda invoke --function-name HelloWorldFunction01 --payload '{}' output01.txt
  aws lambda.invoke --function-name HelloWorldFunction02 --payload '{}' output02.txt
  aws lambda.invoke --function-name HelloWorldFunction03 --payload '{}' output03.txt
done
chmod +x lambda_call.sh

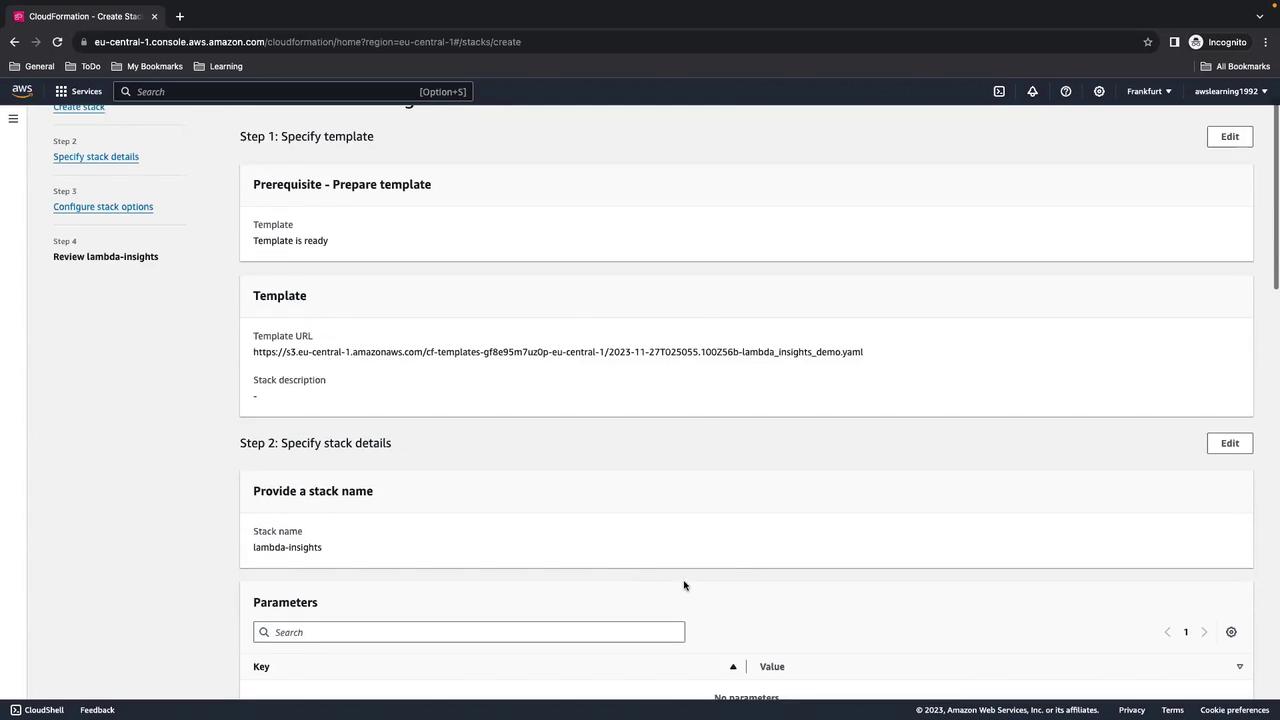
3. Deploying the Stack

  1. Open the AWS Management Console and navigate to CloudFormation.
  2. Choose Create stack > With new resources (standard).
  3. Upload the YAML template and click Next.
  4. Enter a stack name (e.g., 
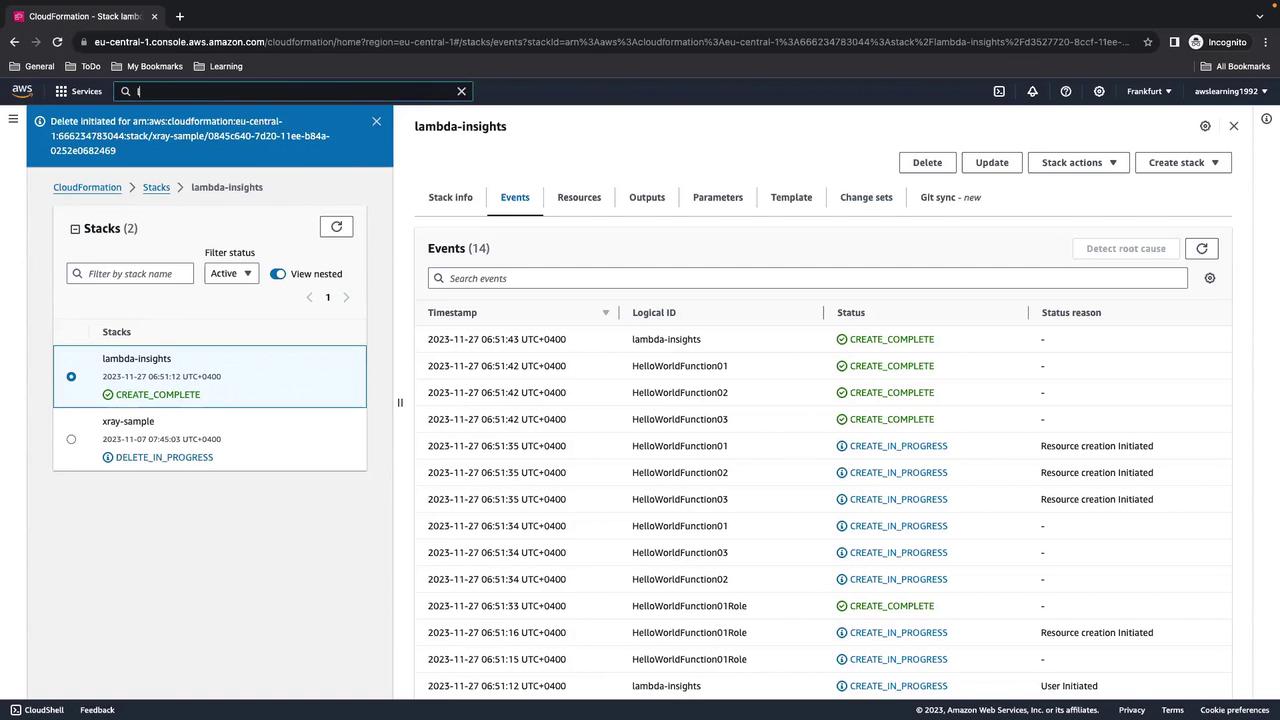
lambda-insights-demo), acknowledge IAM capabilities, then click Next and Create stack.

The image shows an AWS CloudFormation console where a user is creating a stack. It includes steps for specifying a template and stack details, with fields for a template URL and stack name.

Wait until the status reads CREATE_COMPLETE.

The image shows an AWS CloudFormation console with a list of stack events for "lambda-insights," displaying timestamps, logical IDs, and statuses of various operations.

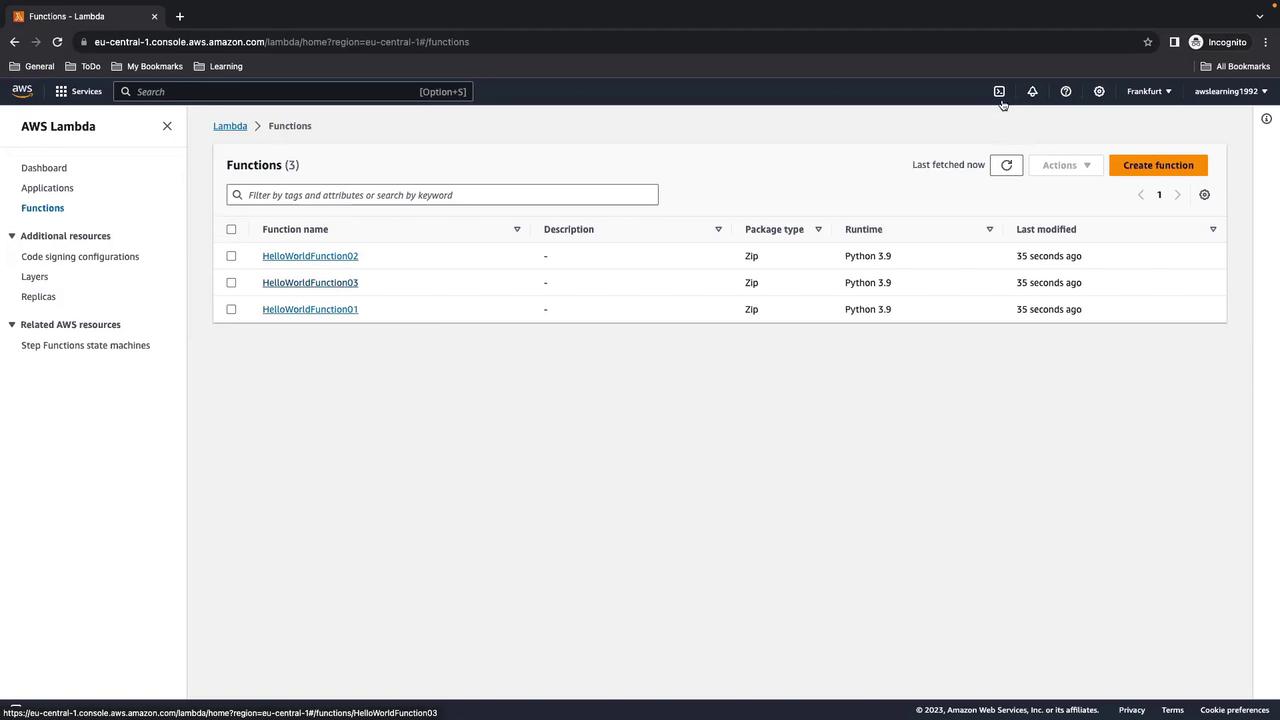
4. Verify Lambda Functions

In the Lambda console, confirm that all three functions (HelloWorldFunction01, HelloWorldFunction02, HelloWorldFunction03) are present and using Python 3.9.

The image shows an AWS Lambda console with a list of functions named "HelloWorldFunction01," "HelloWorldFunction02," and "HelloWorldFunction03," all using Python 3.9.

5. Generate Load Using AWS CloudShell

  1. Open AWS CloudShell from the console toolbar.

  2. Upload or paste the lambda_call.sh script into your home directory.

  3. Execute:

    ./lambda_call.sh
    

You’ll see output similar to:

{
  "StatusCode": 200,
  "ExecutedVersion": "$LATEST"
}
...

Notice that invocations for Function 03 take ~5 seconds due to the sleep.

6. Enabling Lambda Insights

By default, Lambda Insights is off. To enable it:

  1. In the Lambda console, select each function and go to Configuration > Monitoring and operations.
  2. Click Edit, enable Enhanced monitoring (Lambda Insights), and save.

Warning

Enabling Lambda Insights produces extra logs and metrics, which may incur additional charges.

Wait a few minutes for data to appear in CloudWatch.

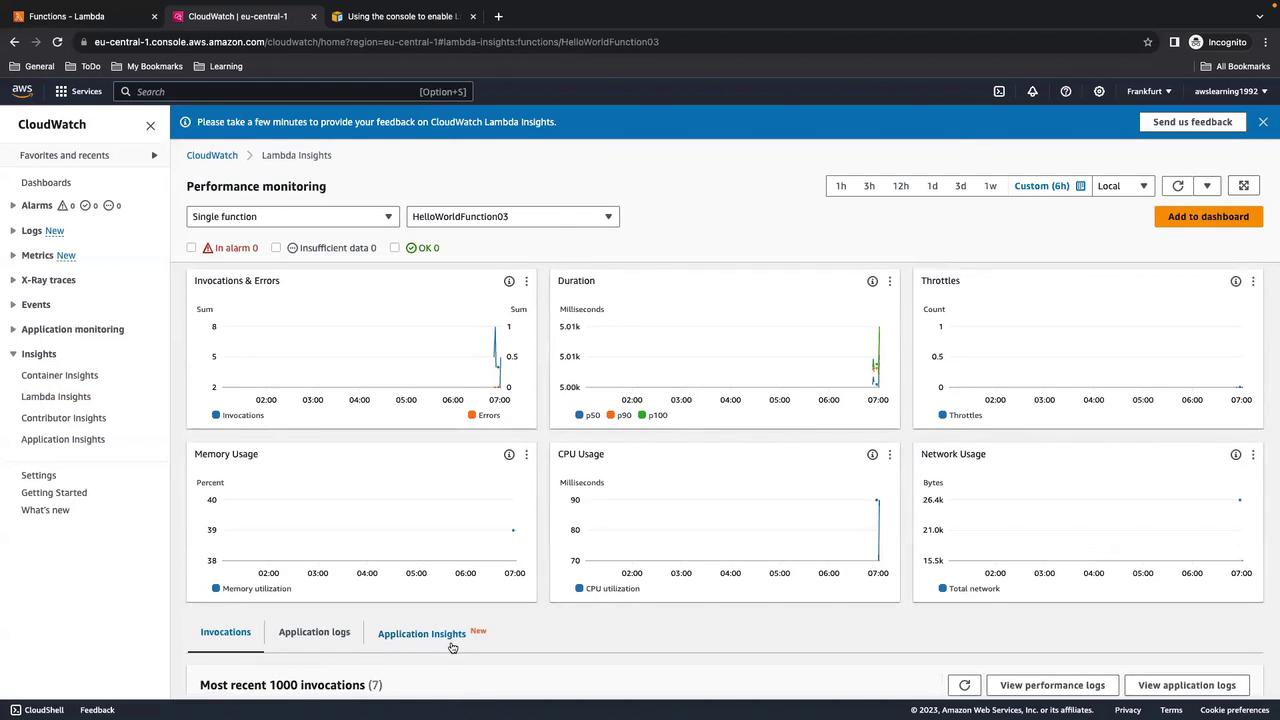
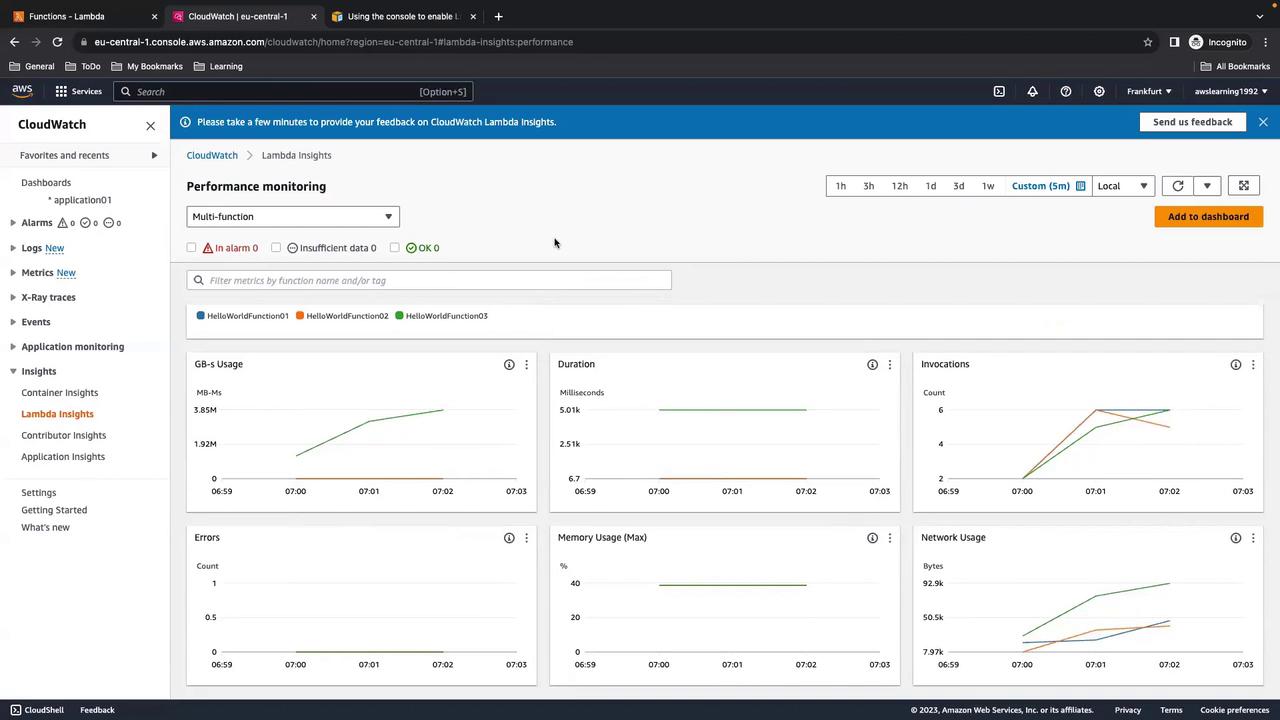
7. Exploring Metrics in CloudWatch

Navigate to CloudWatch > Insights > Lambda Insights to view consolidated metrics across all functions.

The image shows an AWS CloudWatch dashboard displaying metrics for a Lambda function, including graphs for invocations, errors, memory usage, CPU usage, and network usage, along with a table of recent invocations.

To focus on a single function (e.g., 
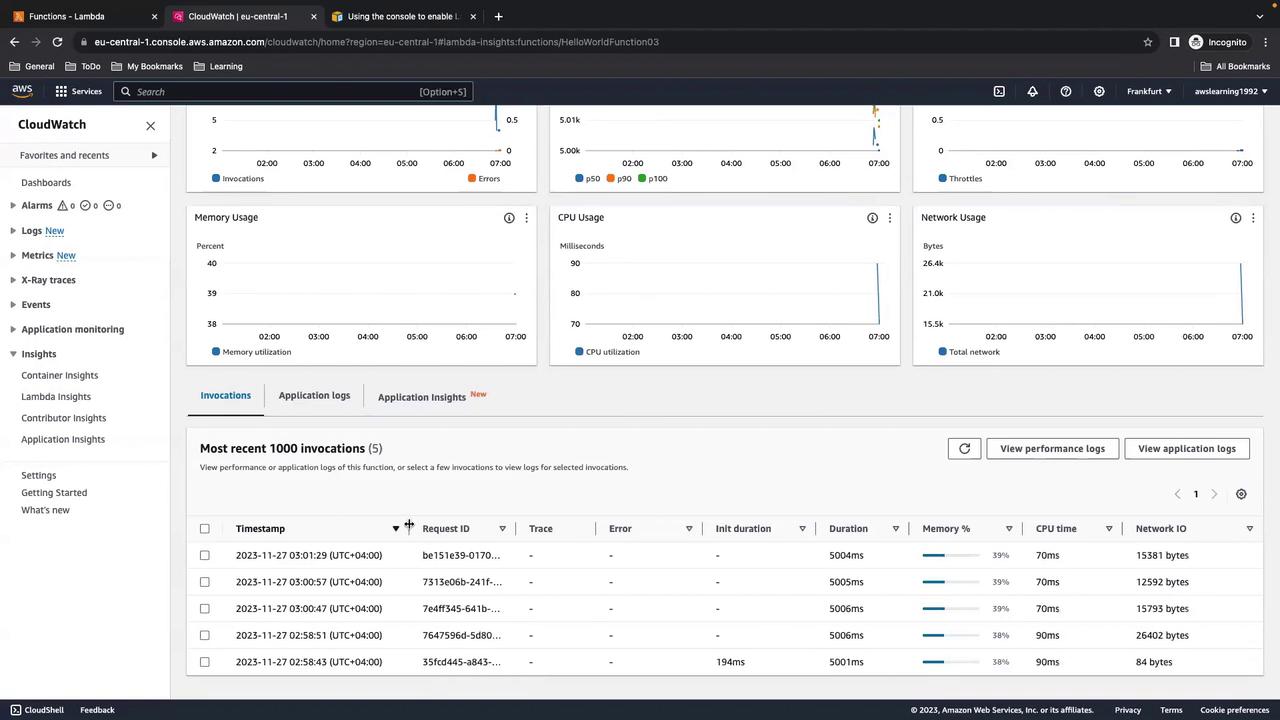
HelloWorldFunction03), select it from the list:

The image shows an AWS CloudWatch dashboard displaying performance monitoring metrics for a Lambda function, including invocations, errors, duration, throttles, memory usage, CPU usage, and network usage over a custom time range.

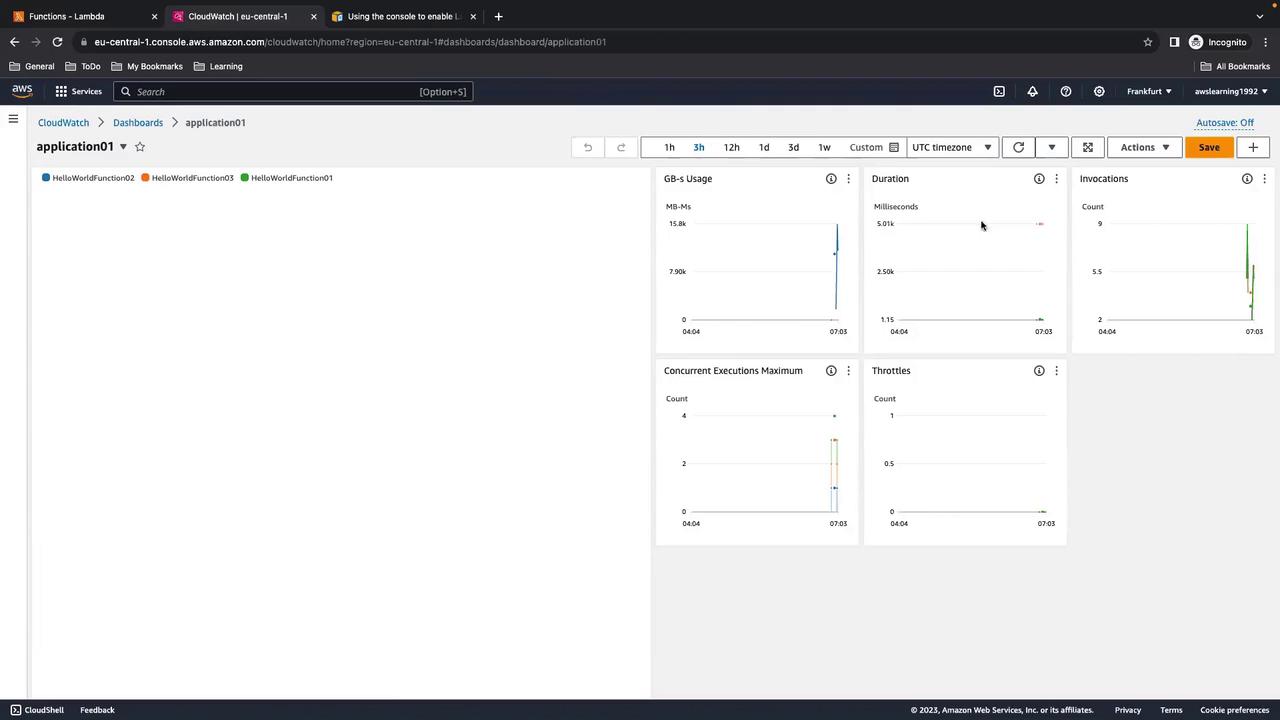
8. Creating a Custom Dashboard

If you manage many functions, a dedicated CloudWatch dashboard helps.

  1. In CloudWatch, go to Dashboards and click Create dashboard.
  2. Add Lambda Insights widgets and select your functions.
  3. Customize widgets for GB-s usage, duration, invocations, concurrent executions, and throttles.

The image shows an AWS CloudWatch dashboard displaying metrics for an application, including GB-s usage, duration, invocations, concurrent executions, and throttles.

Here’s an example with multiple functions:

The image shows an AWS CloudWatch Lambda Insights dashboard displaying performance metrics such as GB-s usage, duration, invocations, errors, memory usage, and network usage for multiple functions. The interface includes graphs and options for customizing the time range and adding data to a dashboard.

Remember to disable Lambda Insights when not troubleshooting to avoid unnecessary costs.

9. Cleanup

  1. In CloudShell, choose Actions > Restart CloudShell to stop any running processes.
  2. In CloudFormation, select lambda-insights-demo and click Delete.
  3. Confirm that the Lambda functions, logs, and IAM roles have been removed.

That completes this AWS Lambda Insights walkthrough. Happy monitoring!

References

Watch Video

Watch video content

Previous
Container InsightsLambda InsightsContributor InsightsApplication Insights