1. EKS Control Plane Logging
Enable control plane logging when creating your EKS cluster to capture API activity and control plane events. Logged data flows automatically to Amazon CloudWatch Logs in a log group named after your cluster.Control plane logs are invaluable for auditing and security compliance. Enable them at cluster creation—AWS handles the log delivery.
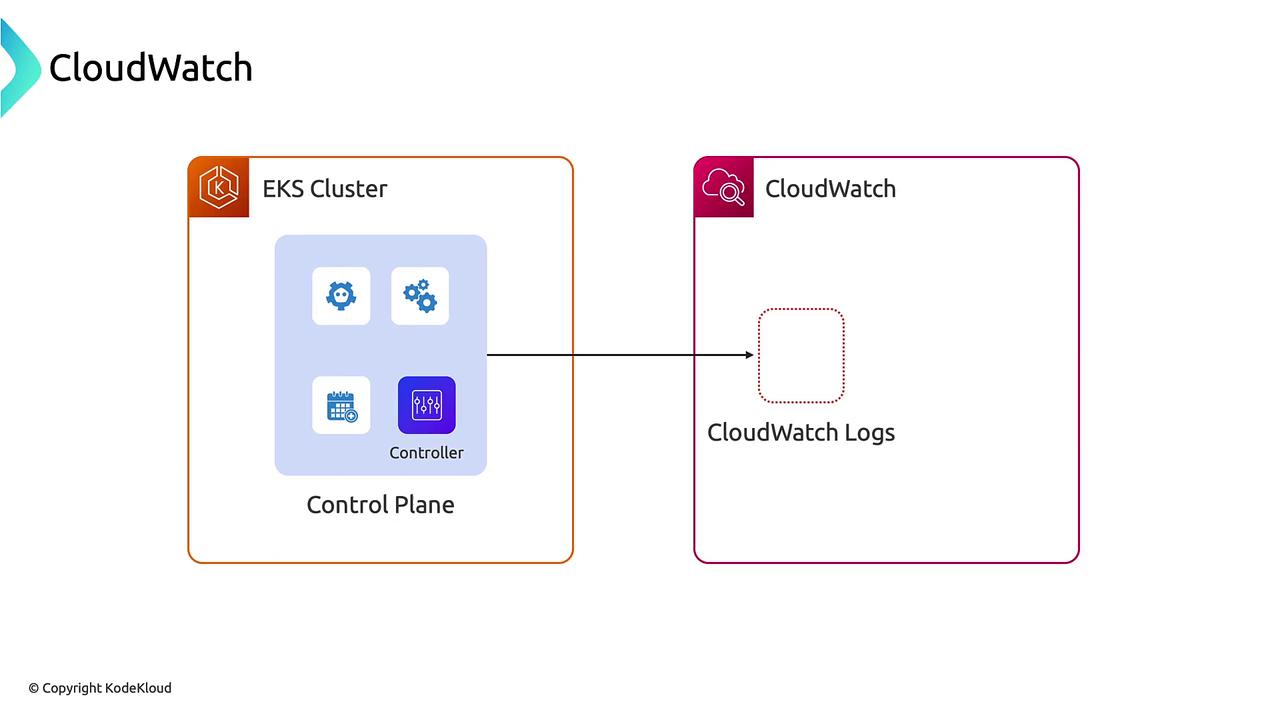
- Query and filter control plane logs
- Create CloudWatch Alarms on specific API calls
- Build dashboards to surface real-time cluster health
2. Node-Level Logging with CloudWatch Agents
To capture node-level system logs and container stdout/stderr streams, deploy the CloudWatch Logs agent on each EC2 node via the AWS Observability Add-on.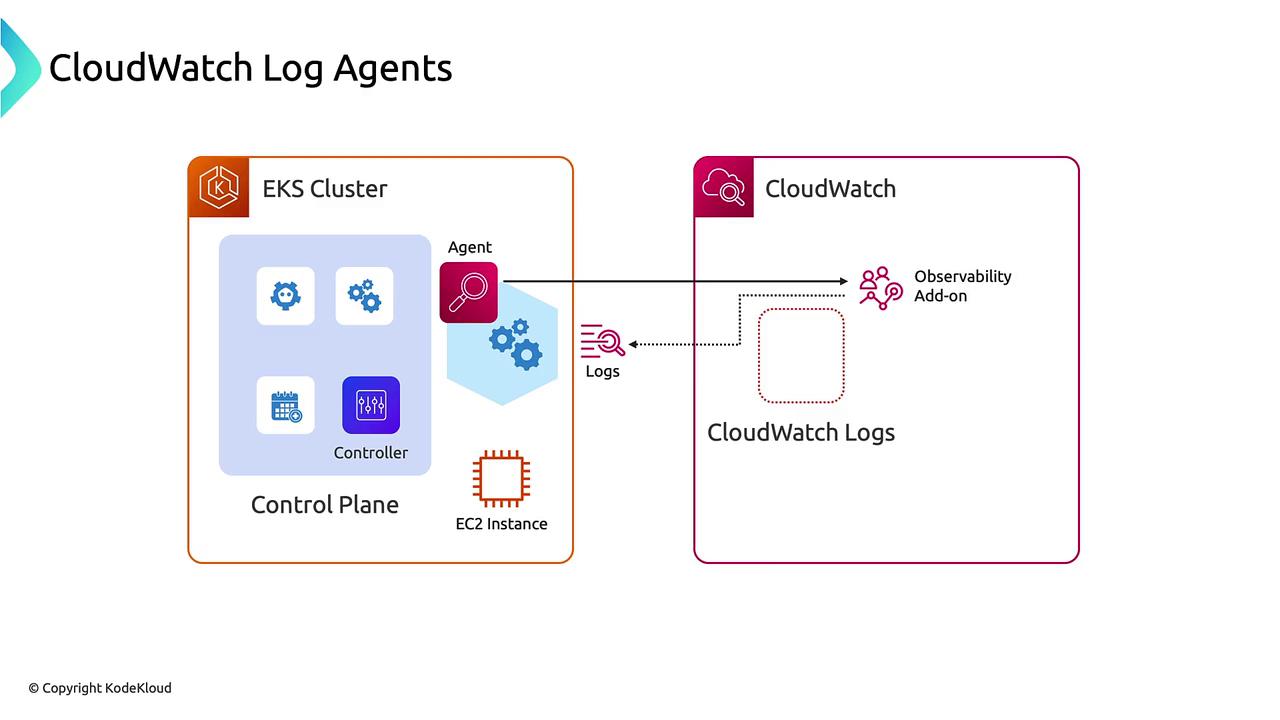
| Log Source | Path/Type | Description |
|---|---|---|
| Node system logs | /var/log/messages | OS events, kernel and system messages |
| Container logs | stdout/stderr | Application output and errors |
| Kubernetes metrics | Prometheus endpoint | CPU, memory, and pod-level metrics |
3. Workload Insights with ADOT
The AWS Distro for OpenTelemetry (ADOT) add-on extends CloudWatch Logs agent capabilities by collecting metrics, logs, and distributed traces. You can send data to CloudWatch or any OpenTelemetry-compatible backend.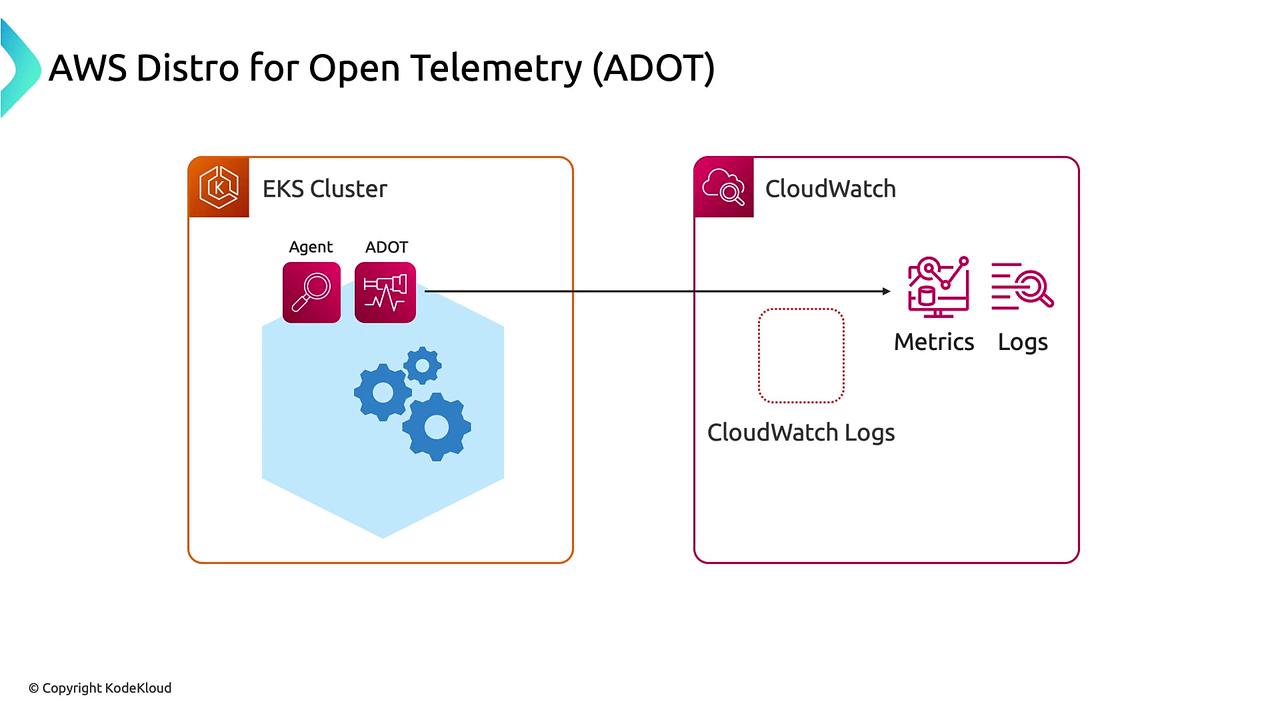
- Unified collection pipeline for logs, metrics, and traces
- Native support for custom OpenTelemetry backends
- Correlation of application logs with performance metrics
Tracing with AWS X-Ray
Layer the AWS X-Ray add-on on ADOT to enable end-to-end distributed tracing across microservices. Trace data is automatically visible in the X-Ray console.4. Fargate Logging
EKS on Fargate uses a managed Fluent Bit agent (similar to FireLens). Deploy logging by:- Creating an AWS Observability namespace in your cluster.
- Applying the provided ConfigMap to configure Fluent Bit.
Fargate only captures application container logs. If you require node-level metrics, consider EC2-based nodes or use Prometheus scraping.
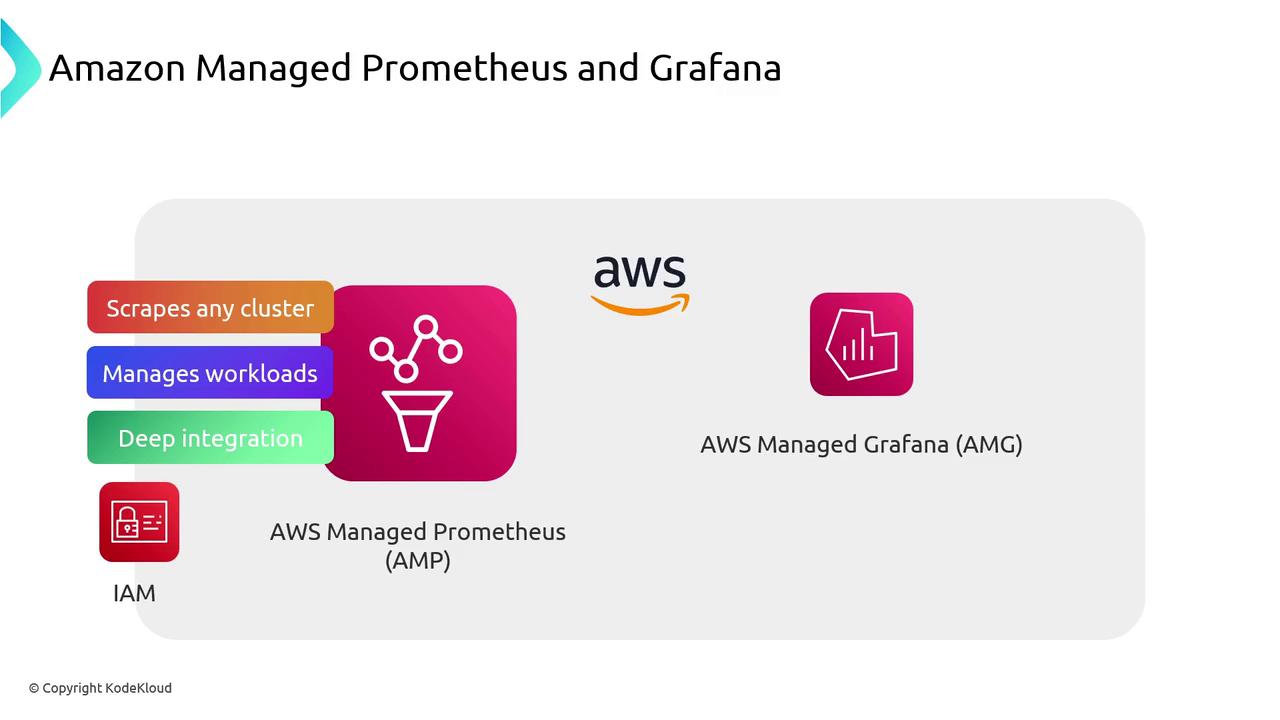
5. Amazon Managed Prometheus and Grafana
For a fully managed Prometheus/Grafana experience, AWS offers:| Service | Use Case | Key Features |
|---|---|---|
| Amazon Managed Prometheus | Scalable metrics ingestion & storage | Auto scale, high availability, Prometheus-compatible |
| Amazon Managed Grafana | Dashboards & alerting | IAM integration, plugins, team management |
Conclusion
AWS offers a comprehensive observability suite for EKS:- Control Plane Logs via CloudWatch Logs
- Node & Container Logs with CloudWatch Logs agent and Observability Add-on
- Unified Telemetry using ADOT
- Distributed Tracing with AWS X-Ray
- Fargate Logging through managed Fluent Bit
- Managed Metrics & Visualization with AMP and AMG