• An AWS account with permissions to create Lambda functions, EventBridge rules, and SNS topics
• Basic knowledge of Python and AWS services
• Basic knowledge of Python and AWS services
Table of Contents
- Open the Lambda Console
- Select the Canary Blueprint
- Configure the Function
- Review the Sample Code
- Set Schedule & Environment Variables
- View Your New Function
- Add SNS Destinations for Success & Failure
- Test the Canary Function
- Monitor Metrics and Logs
1. Open the Lambda Console
- Sign in to the AWS Management Console.
- In the Services menu, search for Lambda and click Lambda.
- Choose Create function.
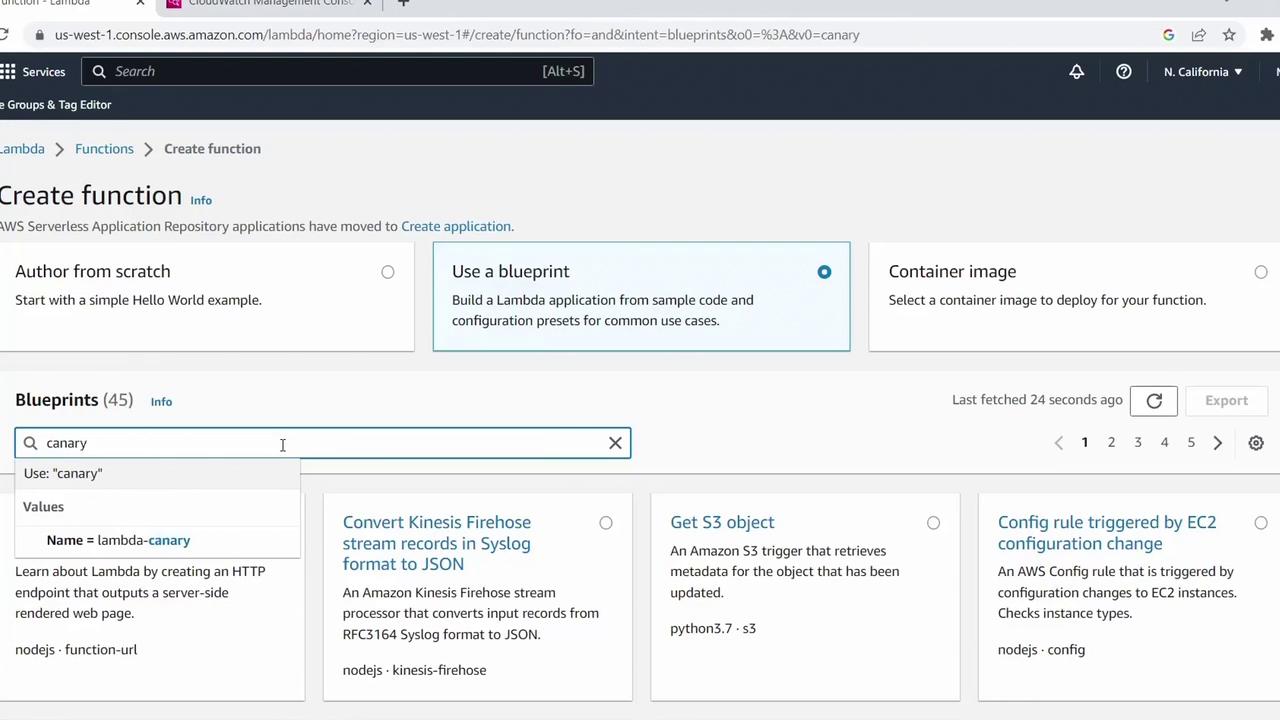
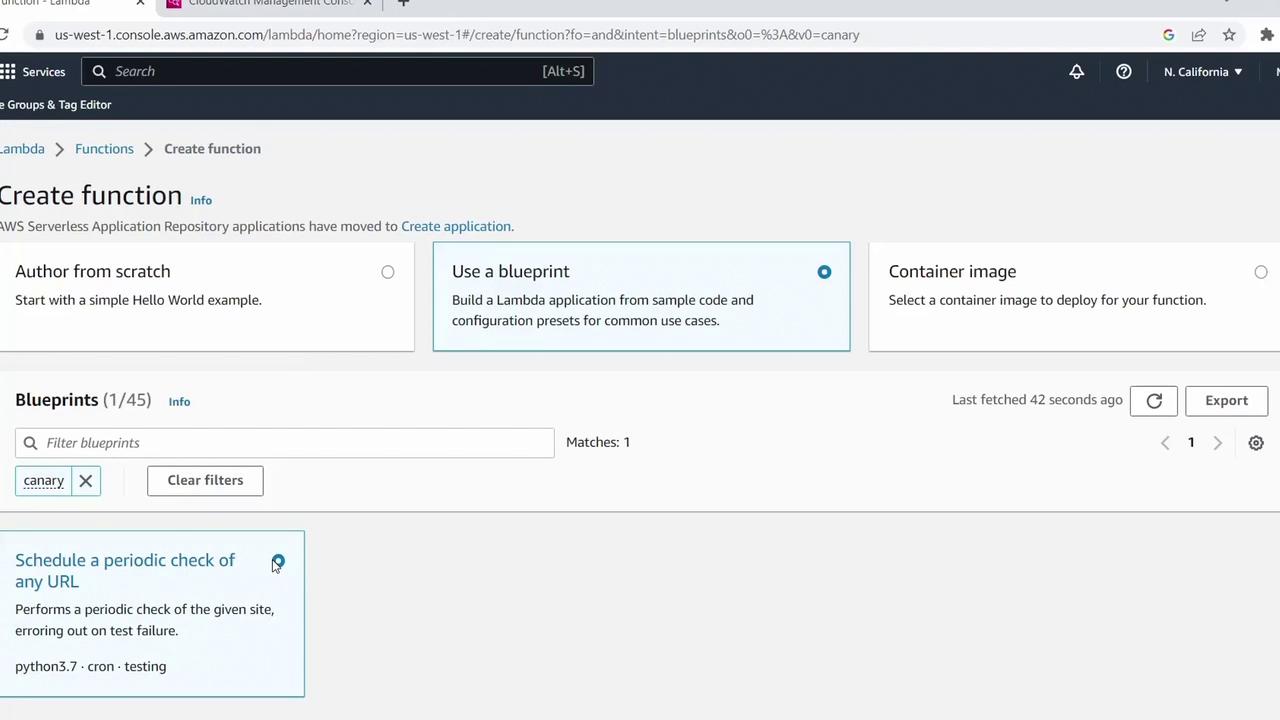
2. Select the Canary Blueprint
AWS provides several blueprints with boilerplate code for common tasks. In the Use a blueprint tab:- Search for canary.
- Select Canary Function (runtime: Python 3.7).
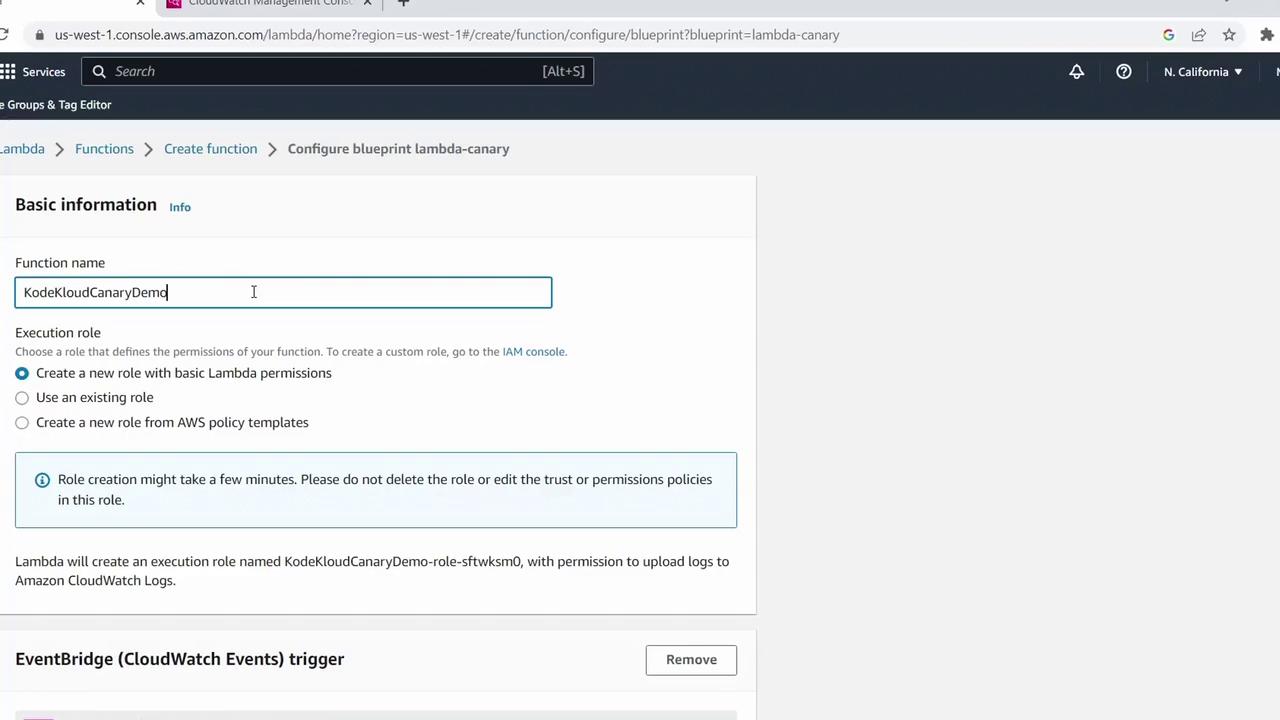
3. Configure the Function
- Click Configure.
- Enter a Function name, e.g.,
KodeKloudCanaryDemo. - Under Permissions, select Create a new role with basic Lambda permissions.
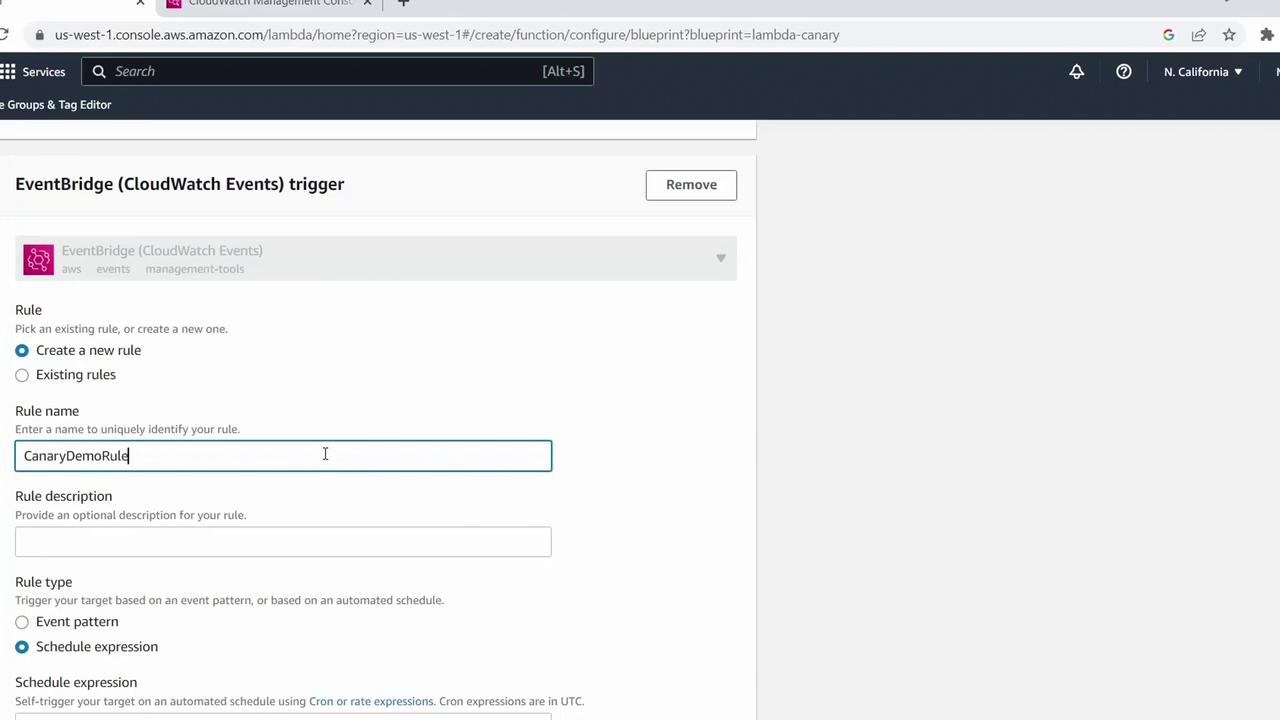
- Rule name:
CanaryDemoRule
4. Review the Sample Code
Scroll to Function code to inspect the handler:| Variable | Description |
|---|---|
site | URL of the site to check |
expected | Text string to search for |
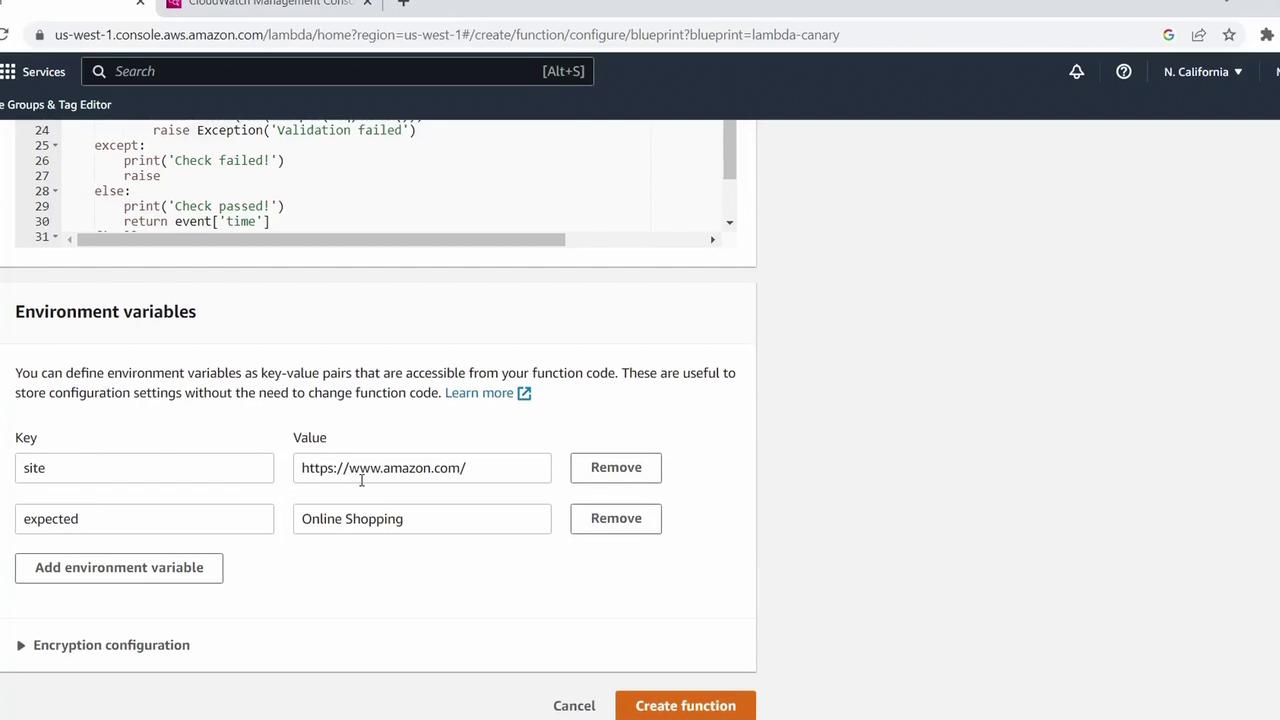
5. Set Schedule & Environment Variables
-
In the trigger pane, set the Schedule expression to:
-
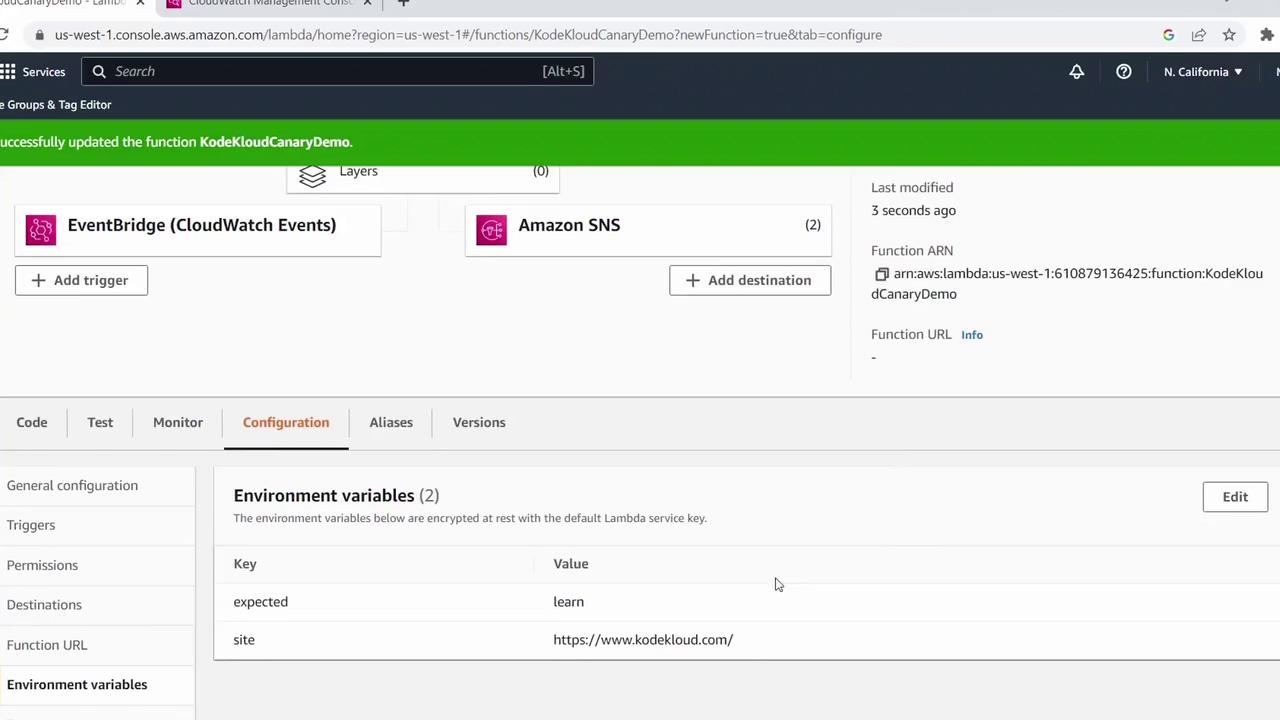
Under Variables and secrets, add:
Key Value sitehttps://kodekloud.comexpecteda string not on the site (to test failure)
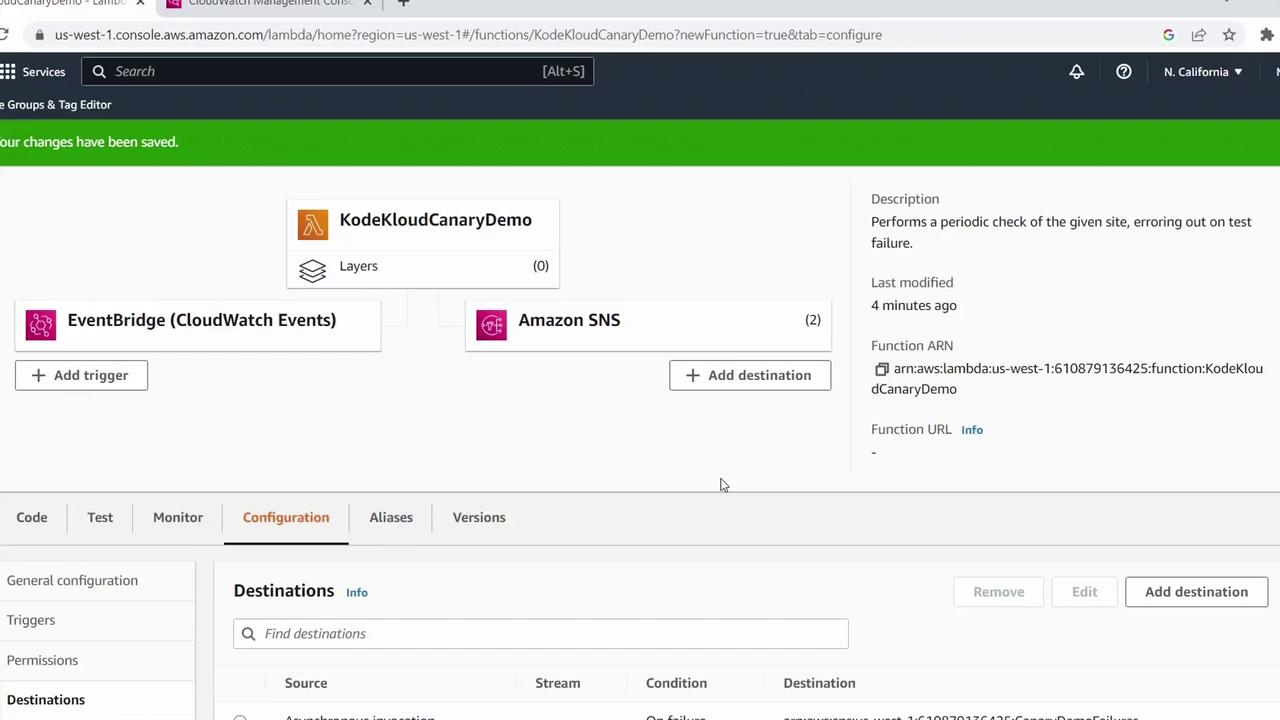
6. View Your New Function
After creation, the Lambda console displays your function’s details and trigger.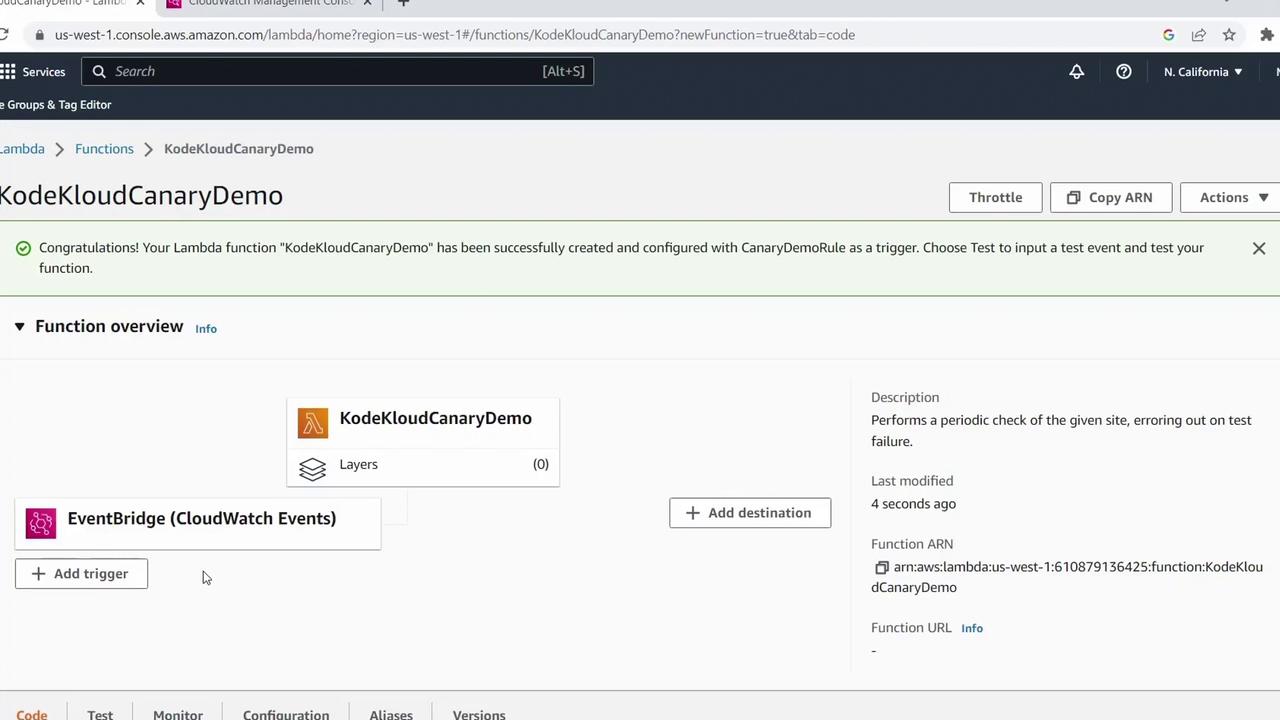
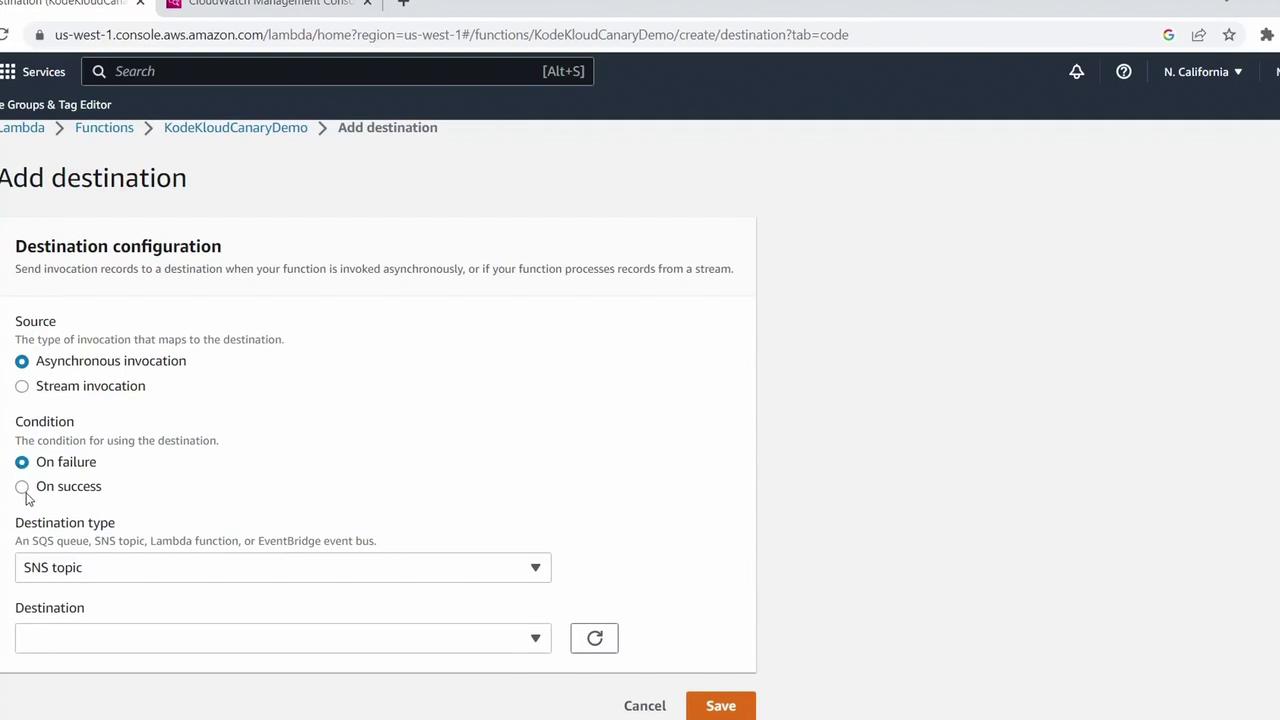
7. Add SNS Destinations for Success & Failure
By default, asynchronous invocations don’t return errors to the trigger. To capture outcomes:- Click Add destination.
- Under Source type, select Asynchronous invocation.
- Set Condition to On failure.
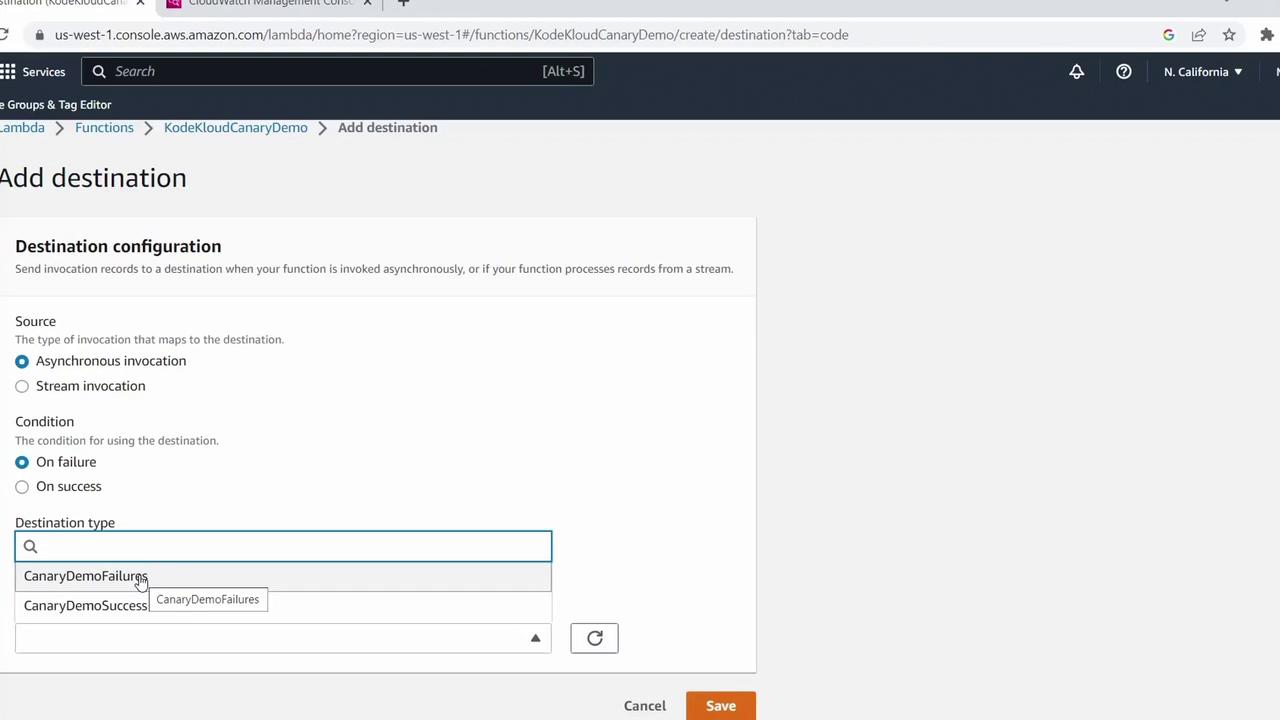
- For Destination type, choose SNS topic and pick (or create) your topic, e.g.,
Canary Demo Failures. - Save and allow AWS to create the necessary IAM role.
Canary Demo Success).
8. Test the Canary Function
- In the Lambda console, click Test.
- The first invocation should fail (expected=string not on site).
- To simulate success, go to Configuration > Variables and secrets and update
expectedto a word you know exists (e.g.,learned). - Save and click Test again.
9. Monitor Metrics and Logs
To review invocation metrics:- Click the Monitor tab in the Lambda console.
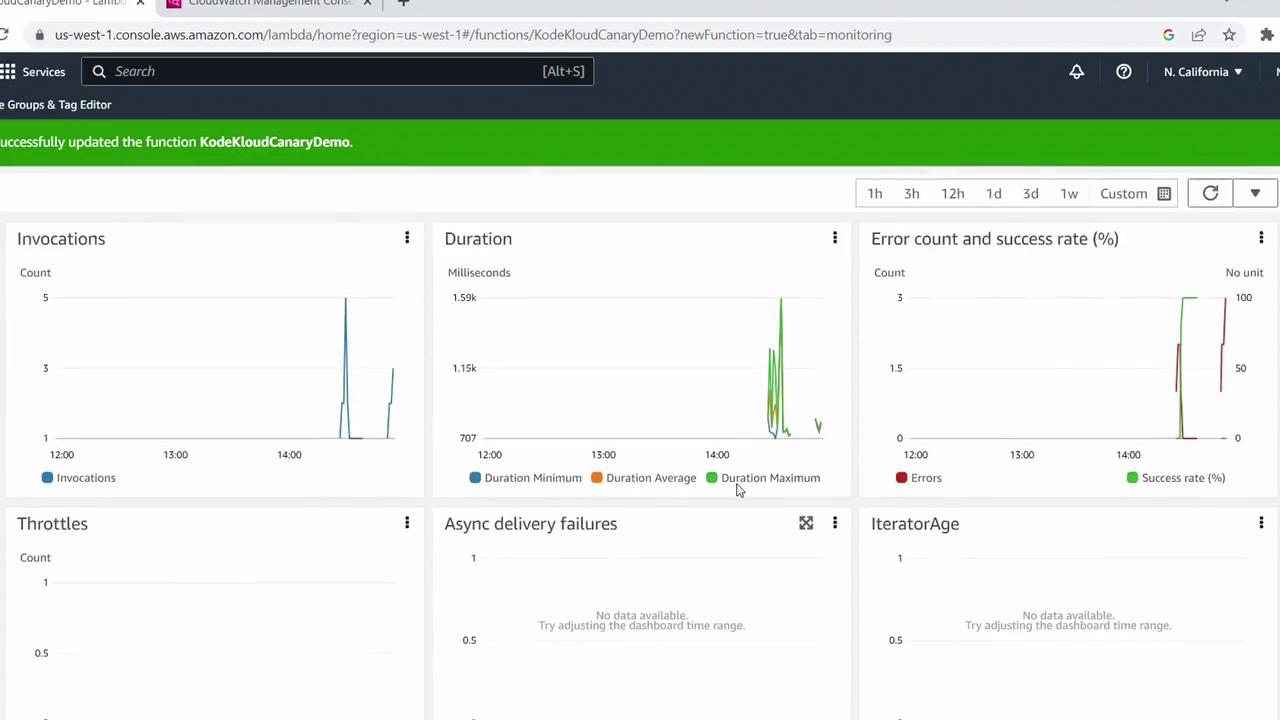
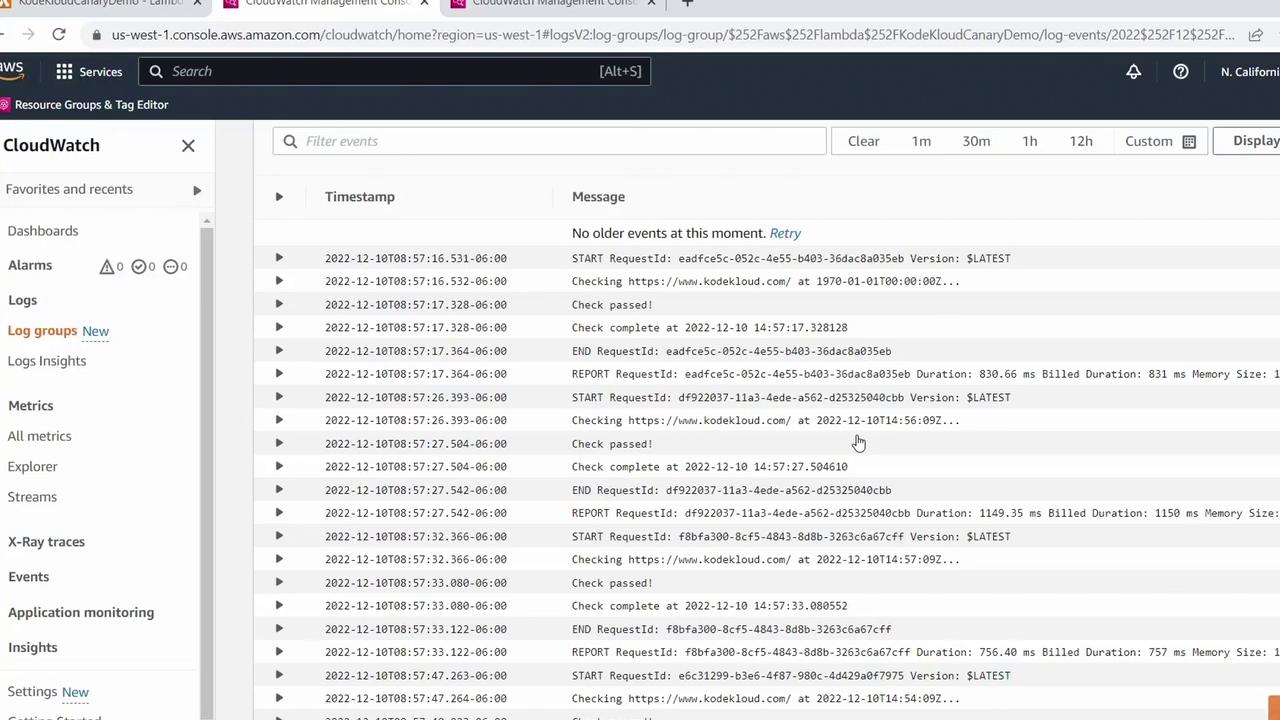
- For detailed logs, select View logs in CloudWatch.
Inspect each log stream to see both failures and successful runs.
Congratulations! You’ve successfully created a Canary Function using an AWS Lambda blueprint, scheduled it with EventBridge, configured SNS destinations, and monitored its behavior. For more AWS Lambda tips and tutorials, explore the AWS Lambda Documentation.