AZ-204: Developing Solutions for Microsoft Azure

Exploring Azure Event Hubs

Exploring Event Hubs Capture

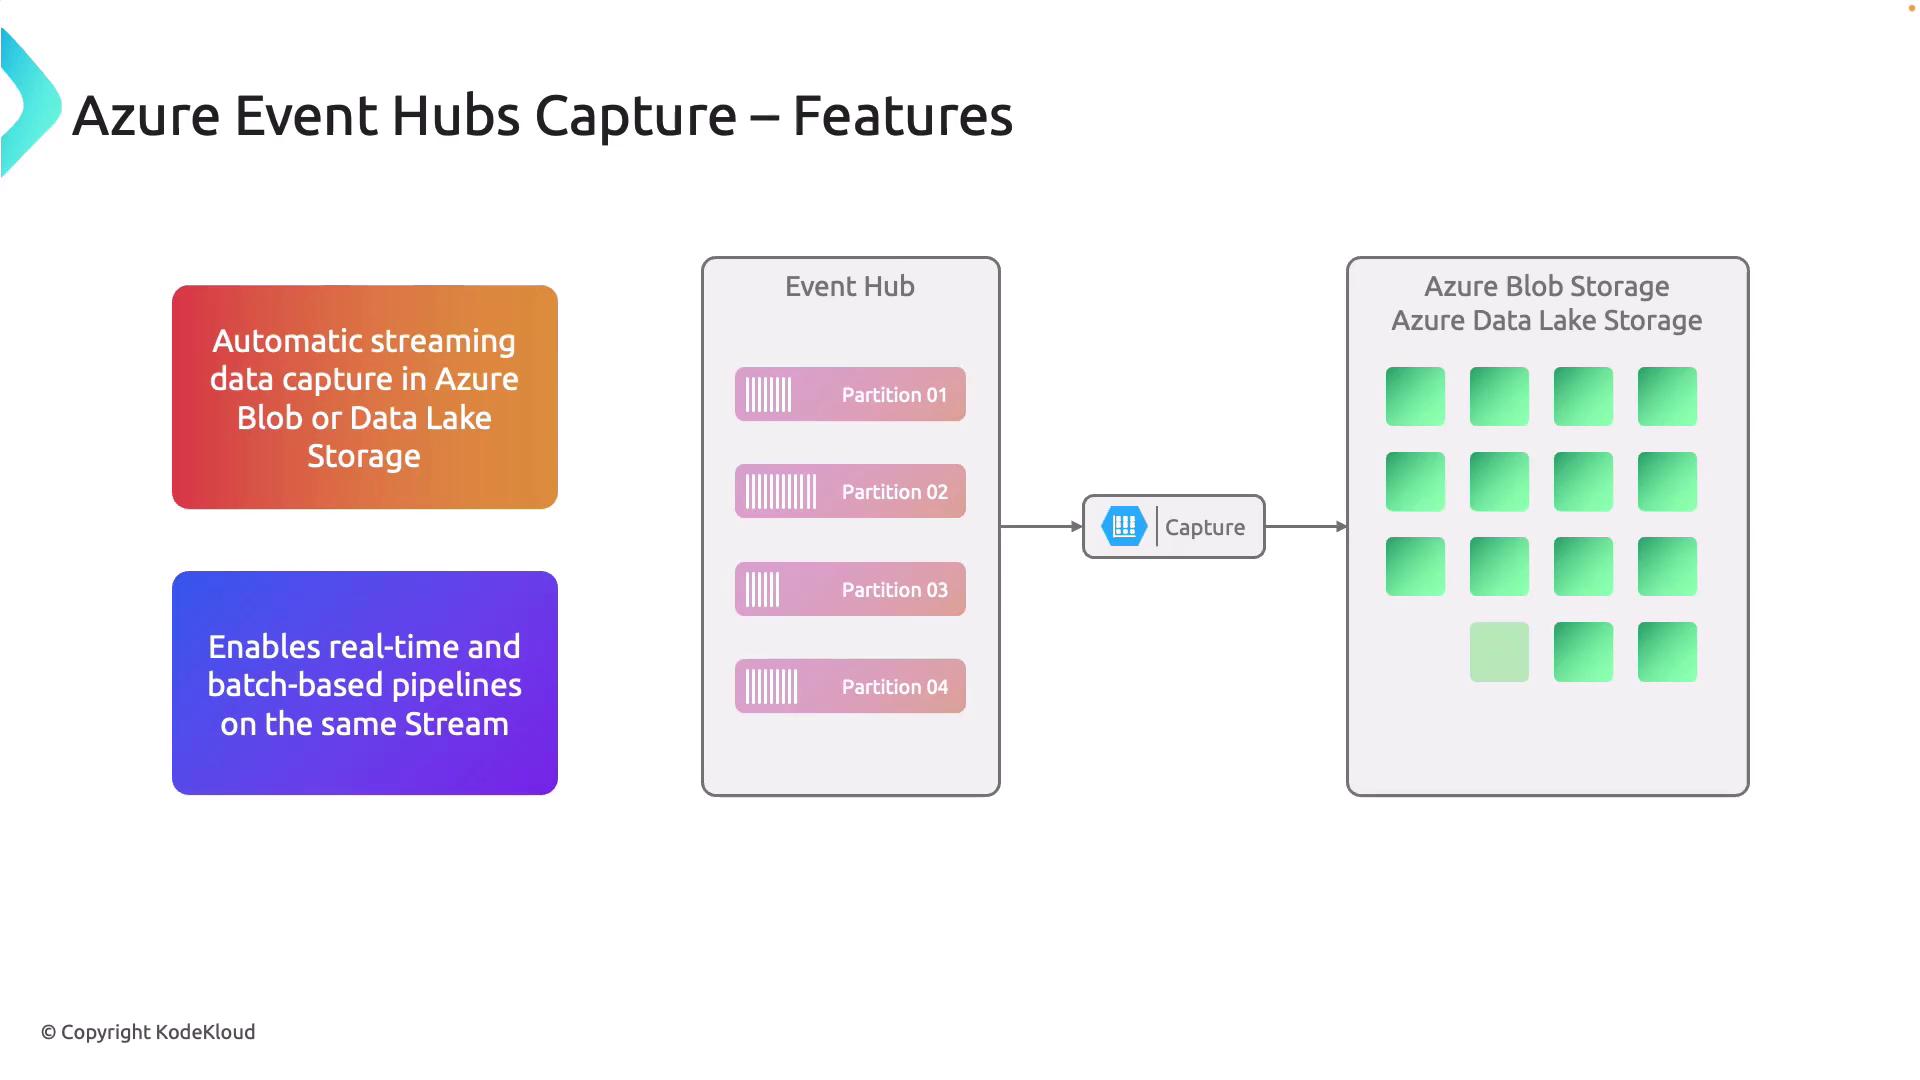
Azure Event Hubs Capture is a powerful feature that automatically streams incoming data from Event Hubs into your Azure storage accounts, such as Blob Storage or Data Lake Storage. This functionality is crucial for building both real-time and batch-based data pipelines, allowing for seamless live data analysis and efficient archival for future processing.

By automating data ingestion, Event Hubs Capture simplifies the process of dealing with high-volume event streams, ensuring cost-effective storage and streamlined analysis without the need for complex custom solutions. In this guide, we'll walk through the core features of Event Hubs Capture, its windowing and scaling mechanisms, and how to set it up and verify its output using the Azure Portal.


How Capture Works: Windowing

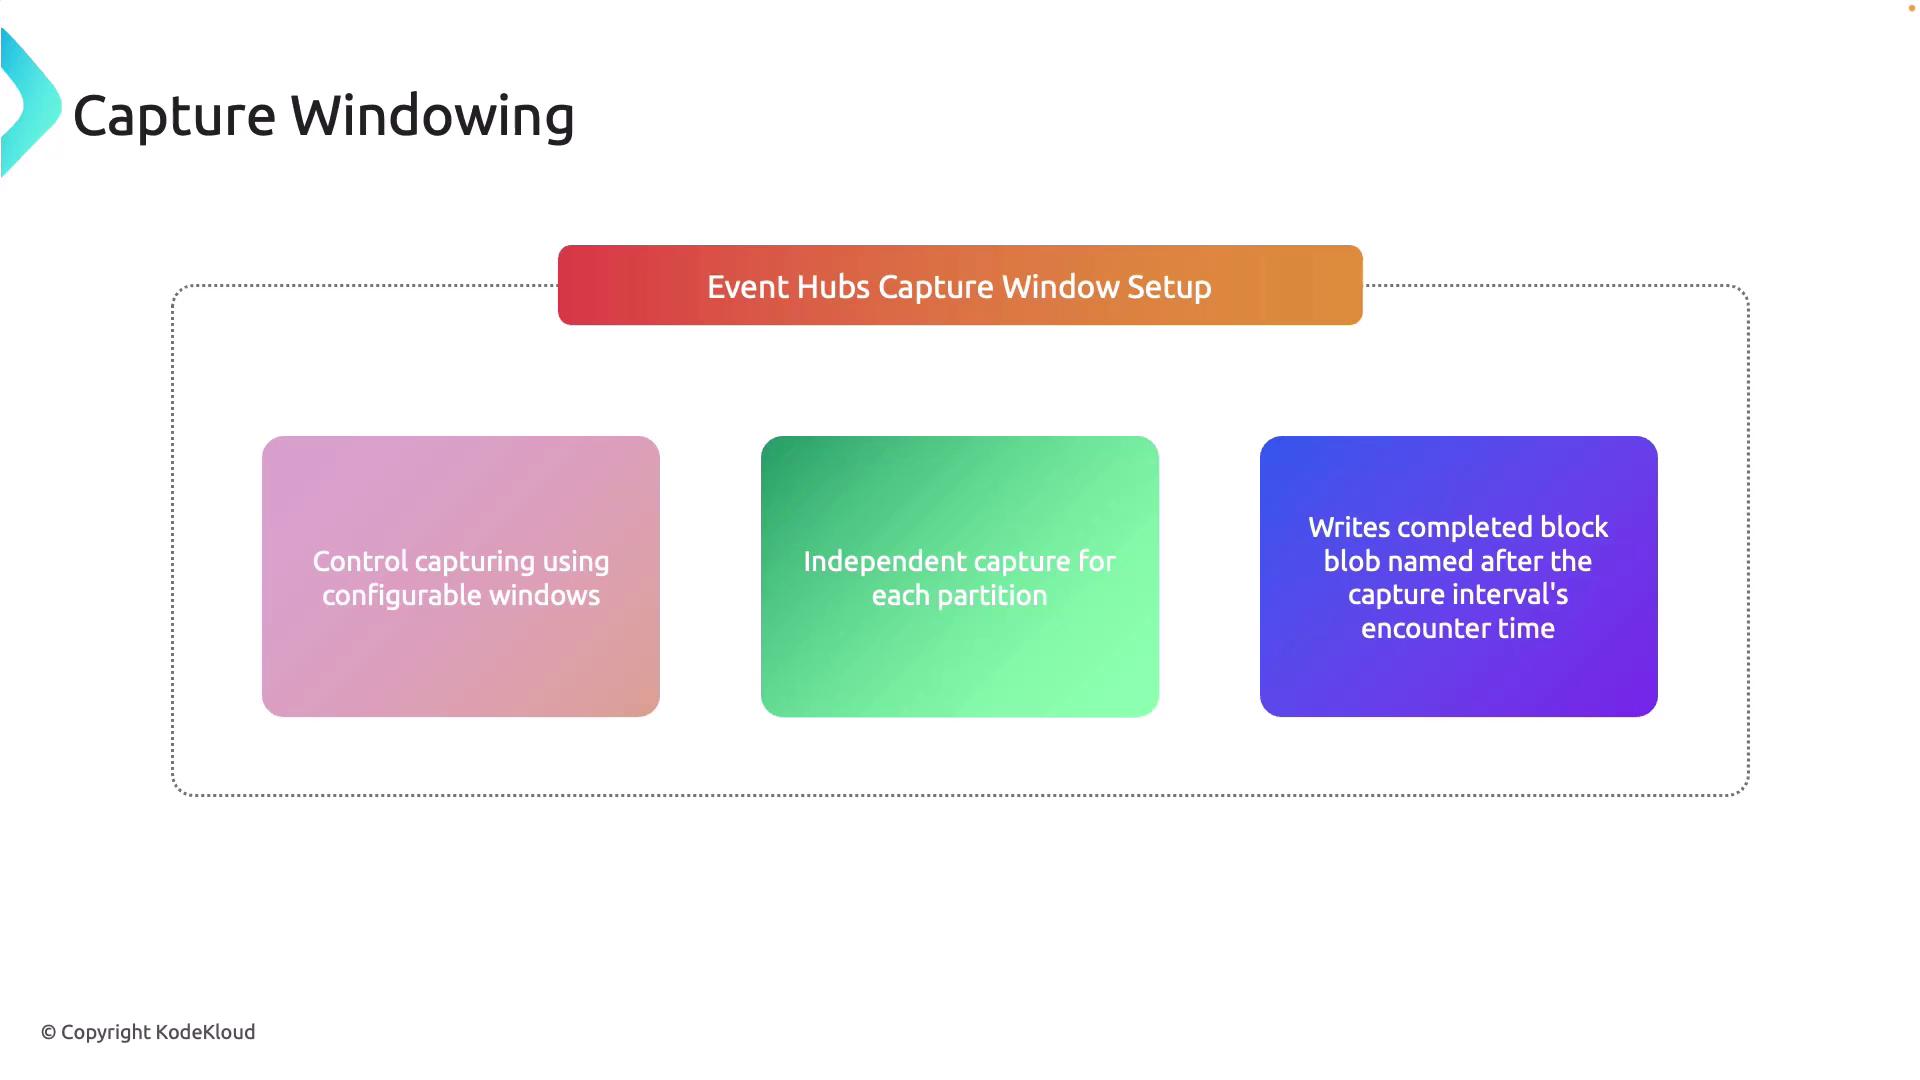
Event Hubs Capture enables you to configure specific time or size windows for data capture. Each partition in the Event Hub writes its data independently; at the end of each capture window, the accumulated data is written to storage as a blob. The blob naming convention reflects the exact time of capture, making it simple to track data processing intervals.

The image illustrates the features of Azure Event Hubs Capture, showing automatic streaming data capture into Azure Blob or Data Lake Storage, and enabling real-time and batch-based pipelines. It includes a flow from Event Hub partitions to Azure storage.

The diagram below outlines the capture window setup, highlighting three crucial points:

  • Configurable windows control the capture process.
  • Each partition captures data independently.
  • Blobs are created after each capture interval, with names indicating the precise capture time.

The image is a diagram titled "Capture Windowing" that outlines the "Event Hubs Capture Window Setup" with three points: controlling capturing using configurable windows, independent capture for each partition, and writing completed block blobs named after the capture interval's encounter time.


Scaling with Throughput Units

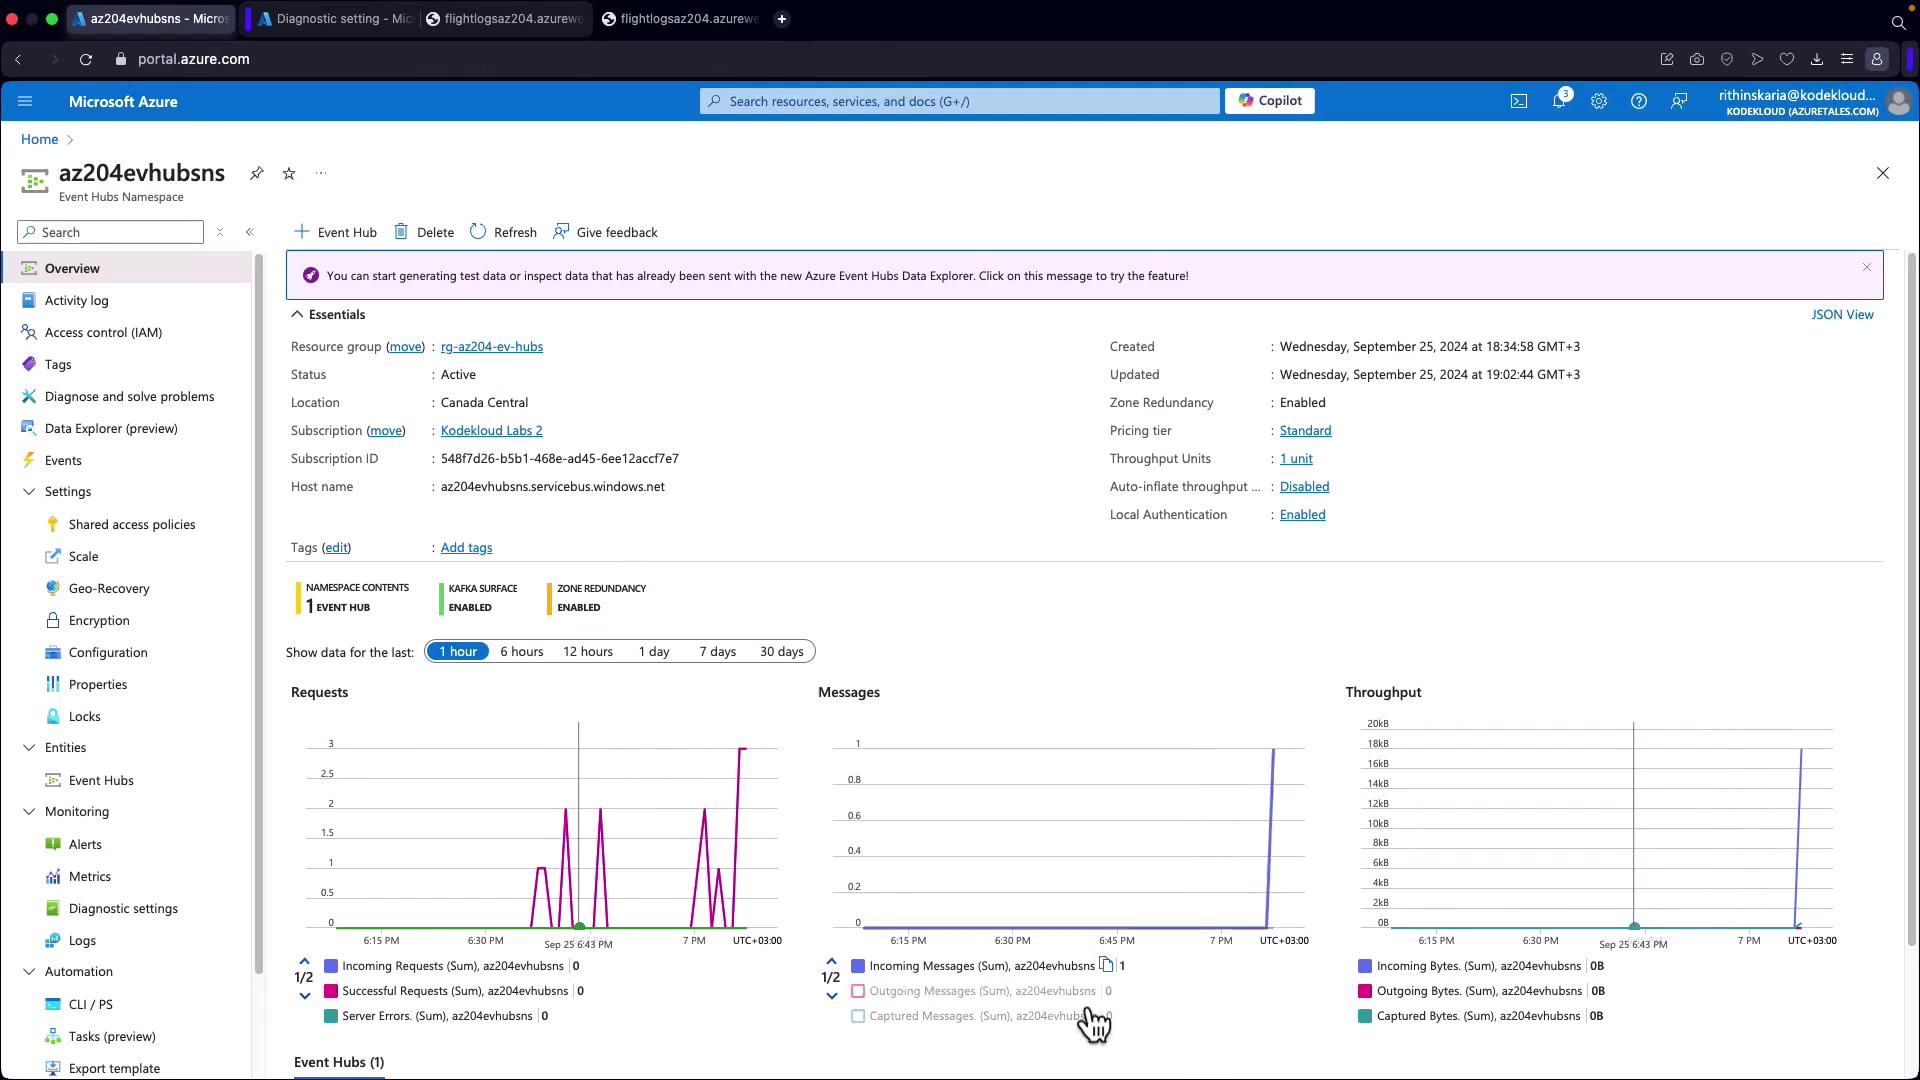
Event Hubs Capture leverages throughput units (TUs) to manage event hub traffic and automatically scales to meet demand. A noteworthy benefit is that the capture process operates independently of throughput unit quotas, ensuring it does not affect your processing egress limits even during peak data flows.

Automatic Capture Trigger

Event Hubs Capture begins as soon as the first event is sent, eliminating the need for any manual intervention.

This design guarantees smooth data ingestion and consistent storage performance under various load conditions, making it ideal for both high-volume environments and batch processing tasks.


Setting Up Azure Event Hubs Capture

Now let's explore how to configure an Event Hub in the Azure Portal with Capture enabled.

  1. Upgrade Your Event Hub Tier
    In the Azure Portal, ensure your Event Hub is upgraded to the Standard tier, which provides access to the capture feature (the Basic tier does not support this). Once upgraded, navigate to your Event Hubs namespace.
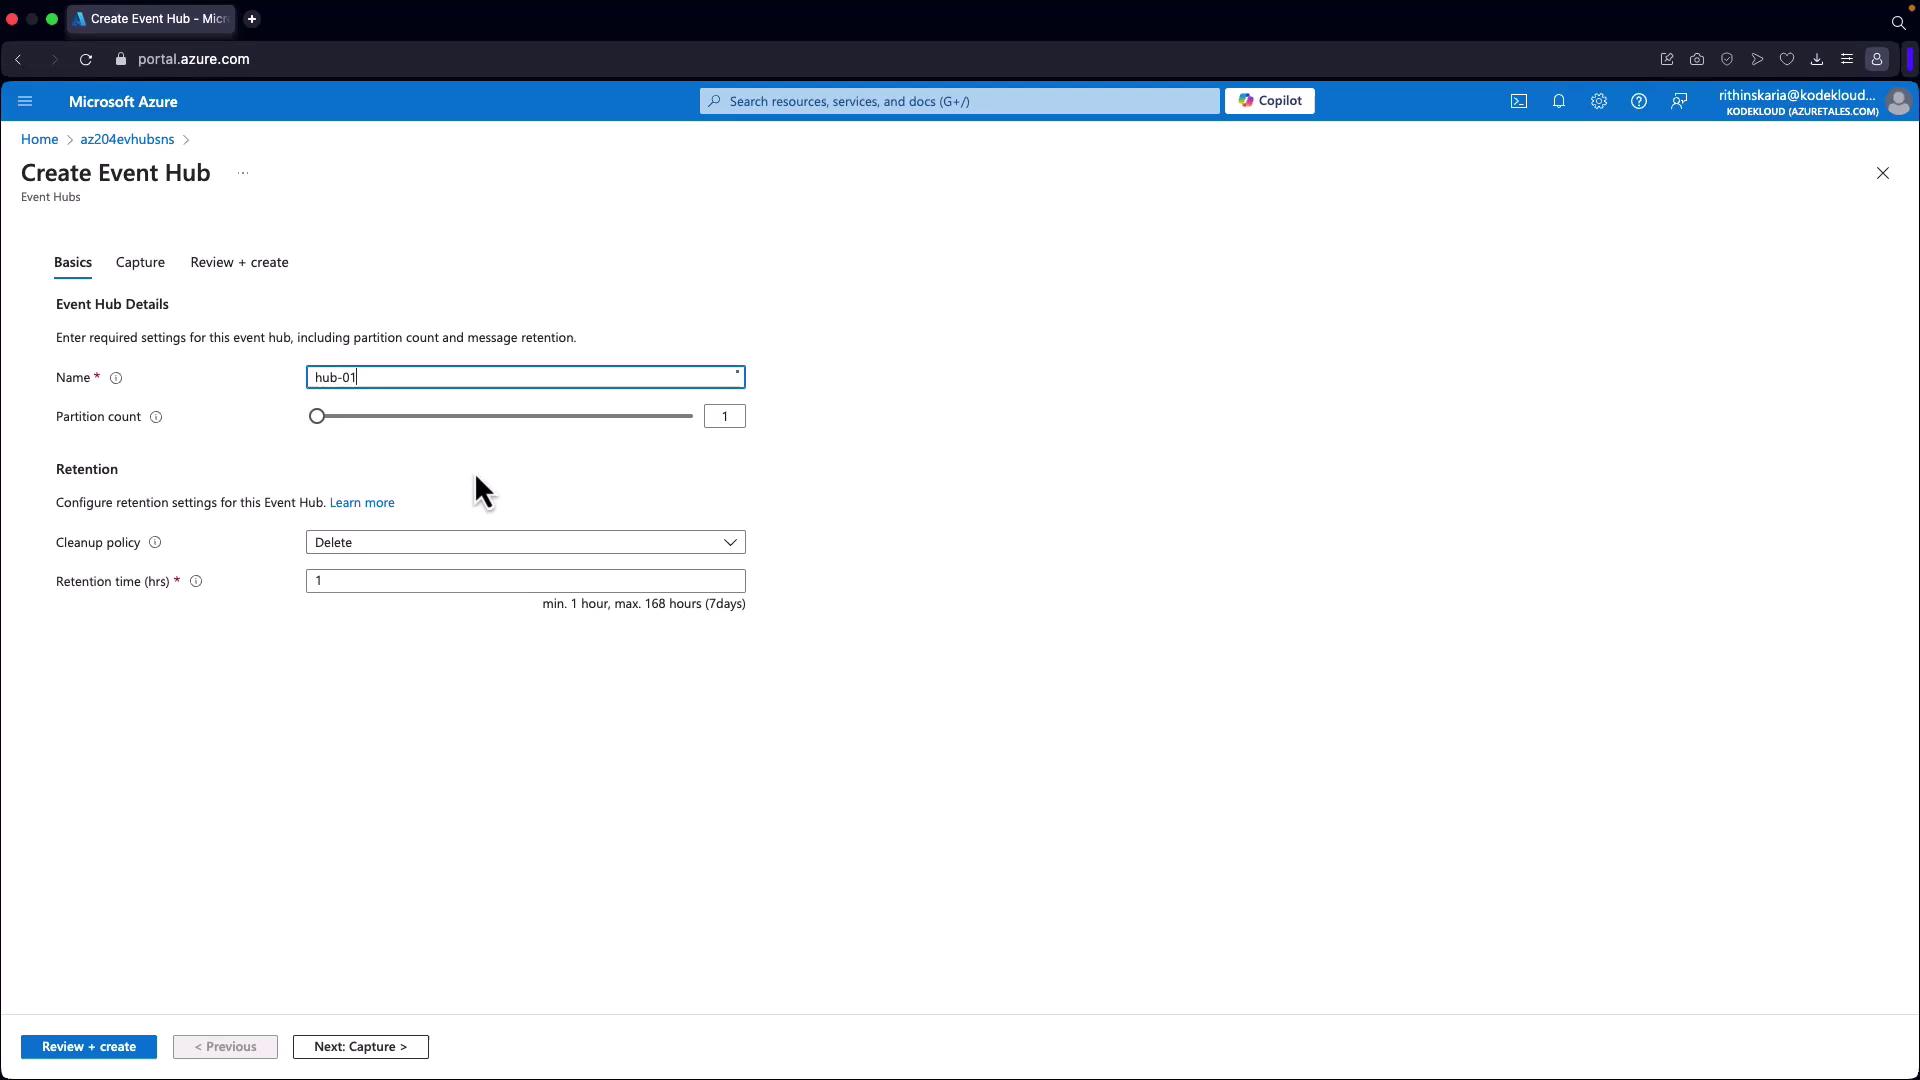
  2. Create an Event Hub
    Follow these steps to create your Event Hub:

    • Name it "Hub 01".
    • Set the partition count to one.
    • Configure the cleanup policy as "Delete" with a retention period of one hour.
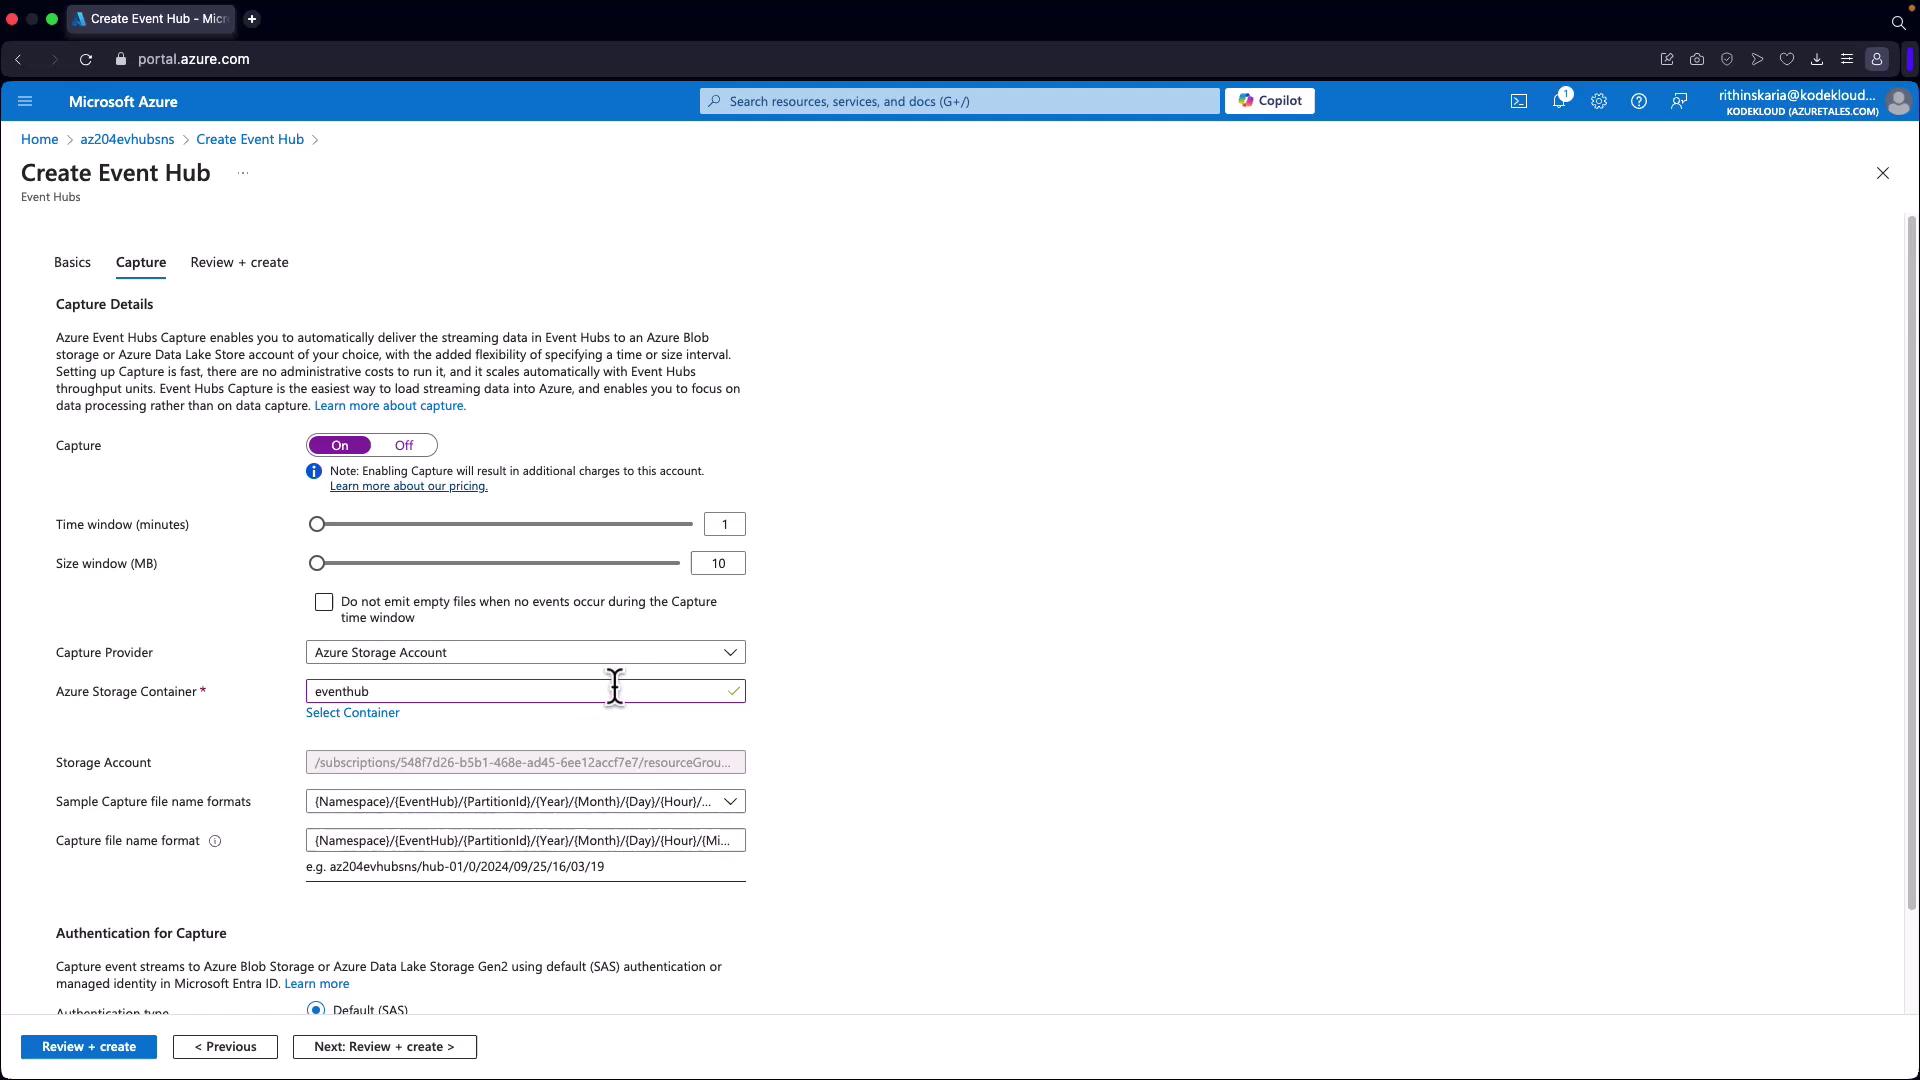
    • Enable Capture and specify your desired capture window settings (for example, a five-minute window, or a smaller size window such as 10 MB and one minute for demonstration).

    The image shows a Microsoft Azure portal interface for creating an Event Hub, with fields for entering the hub name, partition count, and retention settings.

  3. Configure Capture Settings
    In the Capture settings, click on "Select Container" to configure the storage account or ADLS container. You can modify the container name if necessary. The default blob naming format includes details such as namespace, Event Hub, partition ID, and a timestamp (year, month, day, hour, minute, and second). Choose your preferred authentication method; for this example, Shared Access Signatures (SAS) are used, though Managed Identities are also an option.

    The image shows the "Capture" settings page for creating an Event Hub in Microsoft Azure. It includes options for enabling capture, setting time and size windows, and selecting a storage container.

  4. Generate Events for Testing
    After creating the Event Hub, generate some events to test your configuration.


Generating and Streaming Events

There are several methods to generate events. One option is to use the .NET SDK (a topic for another guide). In this instance, you'll configure diagnostic settings on an Azure App Service (e.g., "Flight Logs") to generate events:

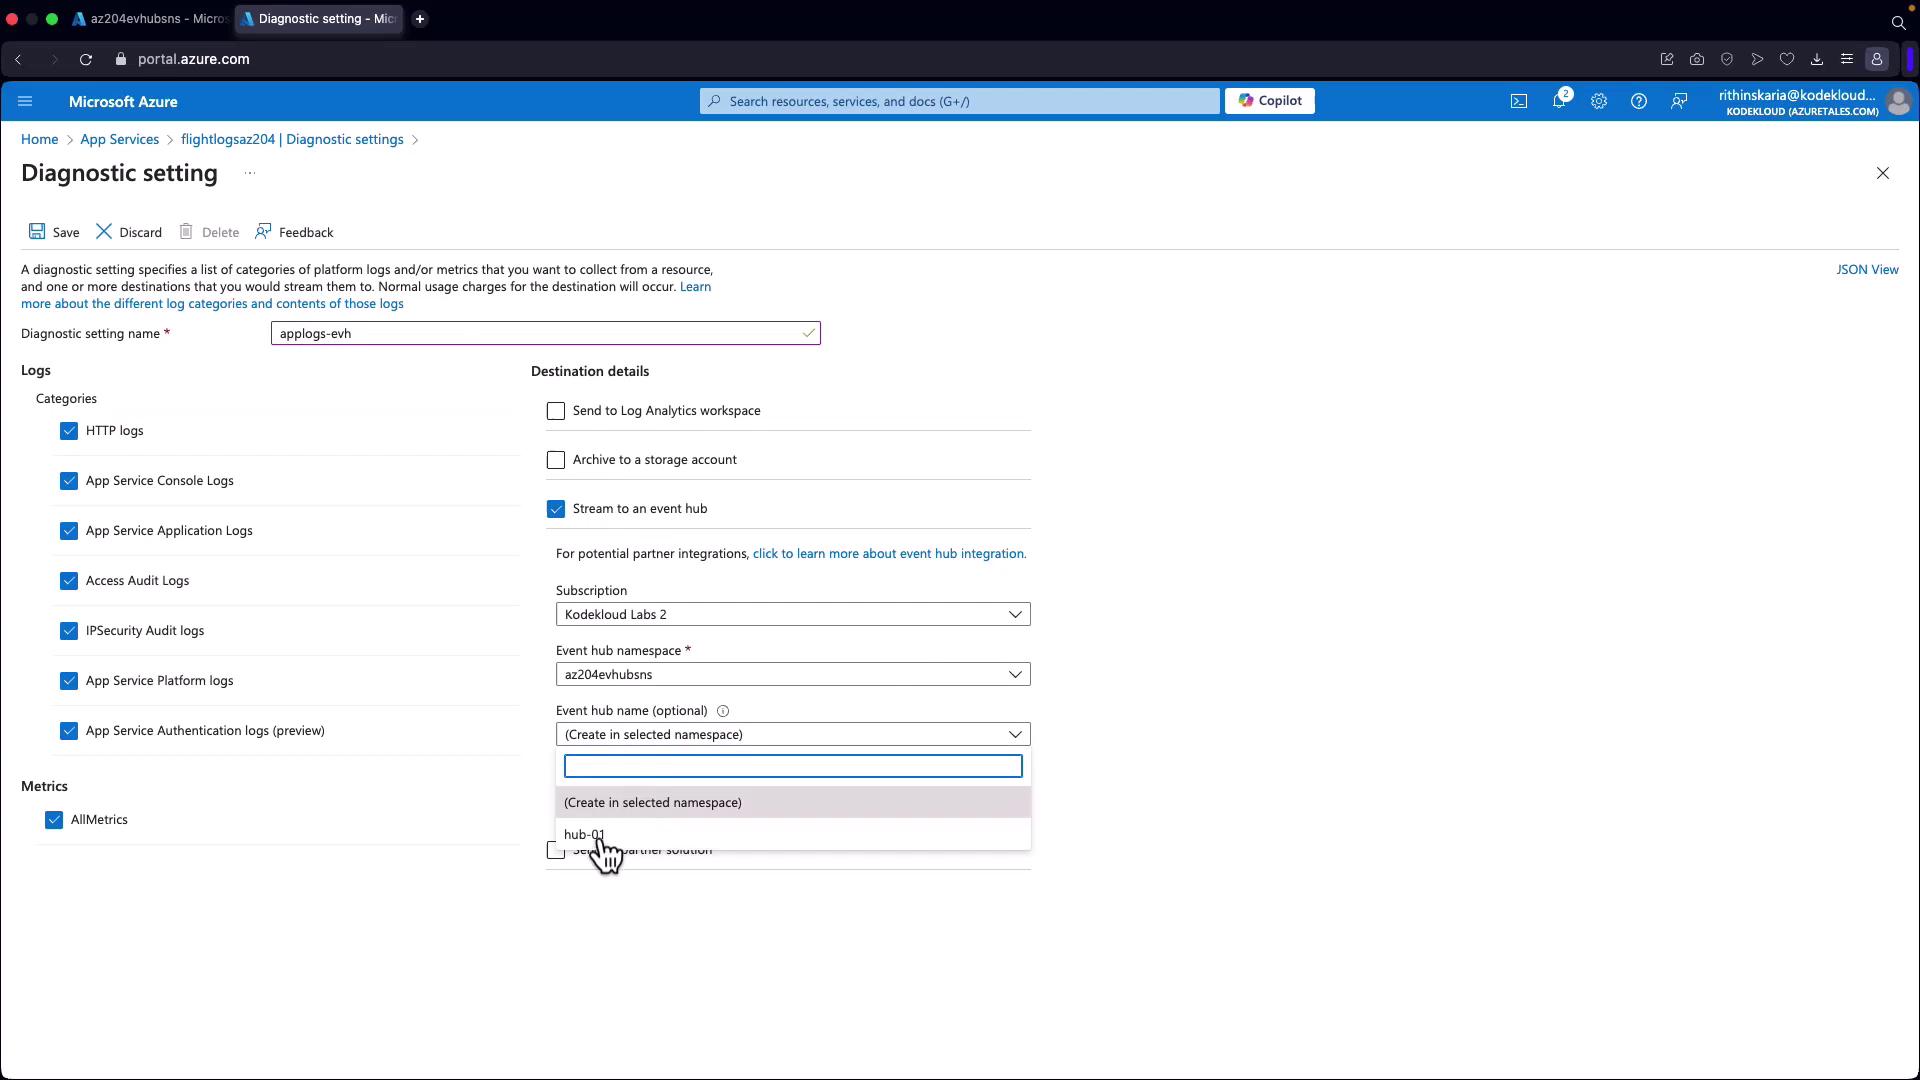
  1. Configure Diagnostic Settings for an App Service

    • Navigate to your App Service.
    • Expand "Diagnostic Settings" and configure it to capture logs and metrics.
    • Provide a name for the log stream (e.g., "app logs EVH").
    • Select "Hub01" as the destination using the root managed shared access key.

    The image shows a Microsoft Azure portal page for configuring diagnostic settings, where various log categories and destination details are selected for streaming to an event hub.

  2. Save and Stream Logs
    Once saved, all App Service requests and audit logs are streamed to your Event Hub.

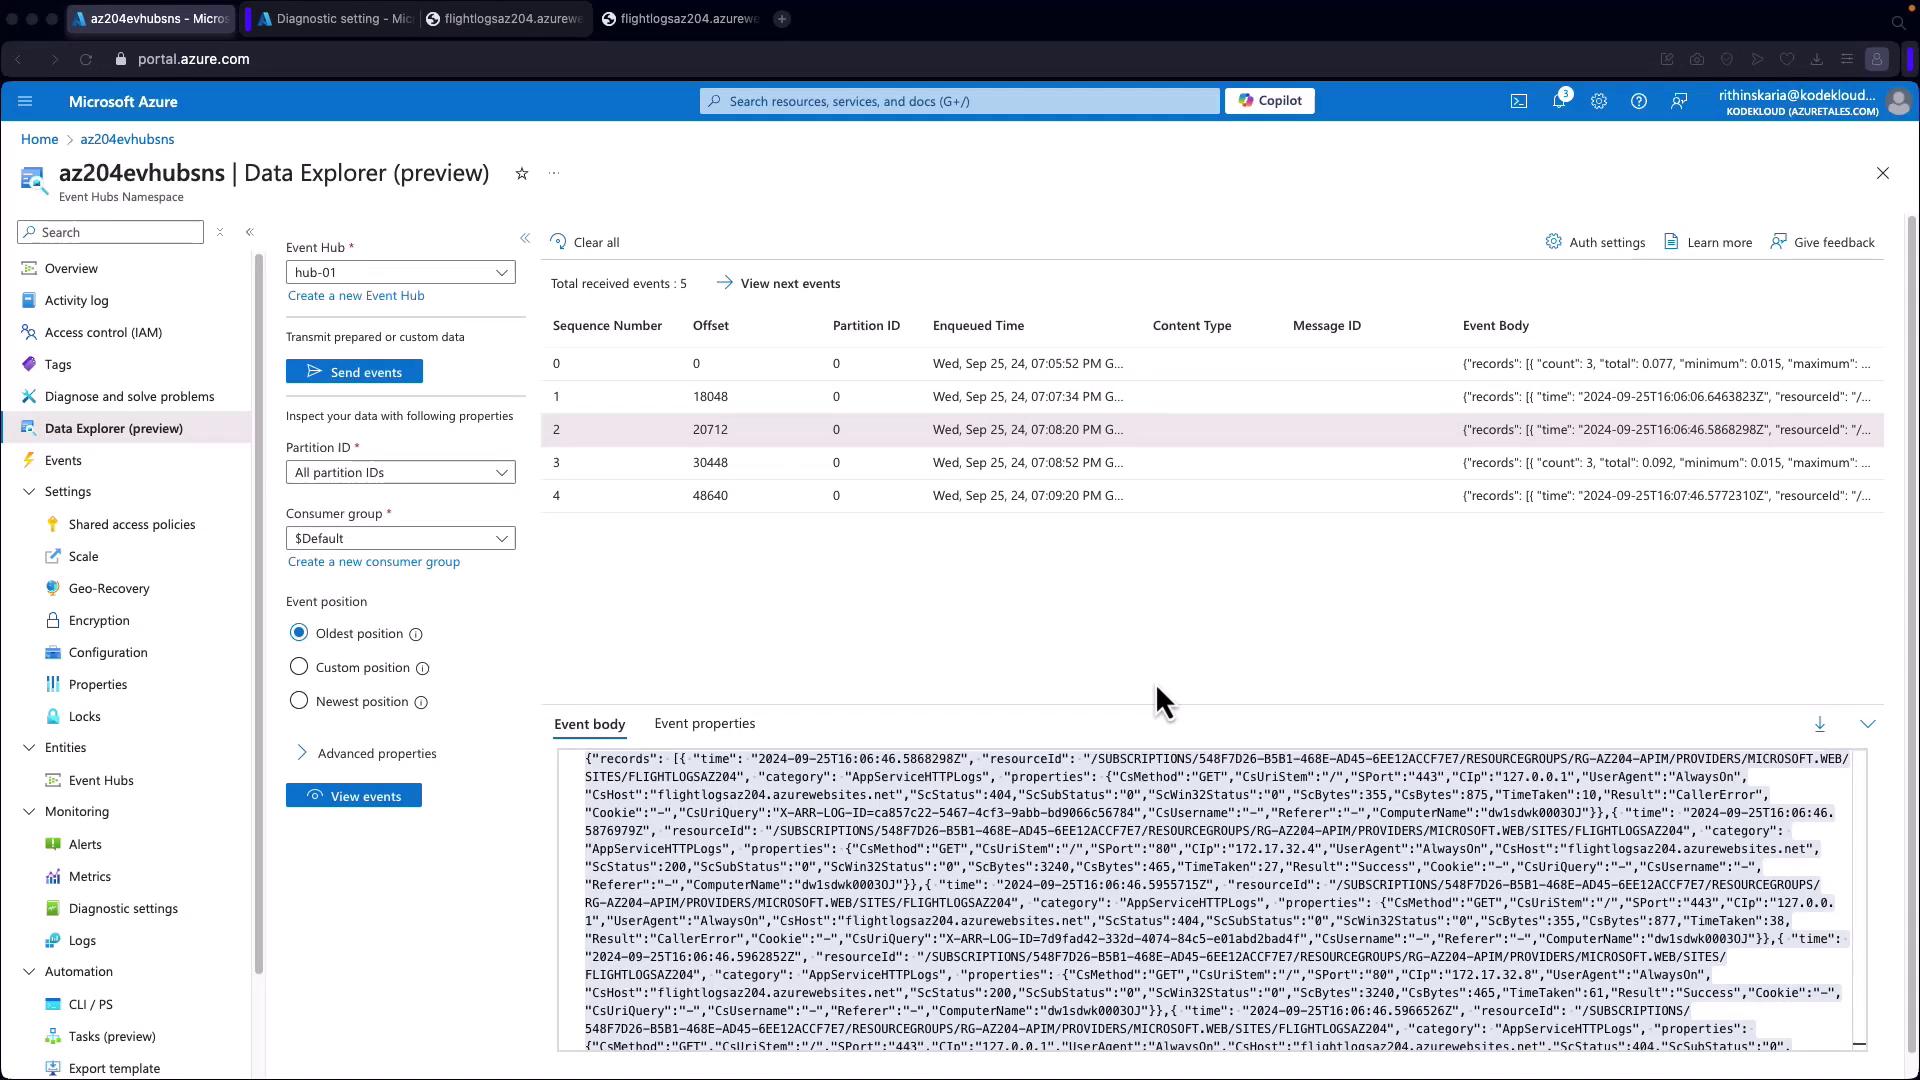
  3. View the Captured Events
    To review the events:

    • Navigate to the "View Events" section in the Event Hub's Data Explorer.
    • You will observe incoming events, including API requests and logs from your App Service.

    The image shows the Microsoft Azure portal interface for an Event Hubs namespace, displaying details such as resource group, status, location, and subscription, along with graphs for requests, messages, and throughput over time.

Below are sample events captured from the Flight Logs:

Sample Python Event

A sample event captured in Python format:

{
    'records': [
        {
            'time': '2024-09-25T16:06:06.64683232Z',
            'resourceId': '/SUBSCRIPTIONS/54B7D26-B5B1-468E-AD45-6E21EACF7E7/RESOURCEGROUPS/RG-AZ204-APIM/PROVIDERS/MICROSOFT.WEB/SITES/FLIGHTLOGSAZ204',
            'category': 'AppServiceApplogs',
            'operationName': 'Microsoft.Web/sites/log',
            'level': 'Information',
            'resultDescription': 'Application started. Press Ctrl+c to shut down..',
            'properties': {
                'preciseDateTime': '2024-09-25T16:06:06.64349200Z',
                'resource': 'flightlogsa224.azurewebsites.net',
                'source': 'Microsoft.Diagnostics.Tracing.ENTraceEventSource',
                'websiteInstanceId': 'null',
                'level': 'Information',
                'message': 'Application started. Press Ctrl+c to shut down..',
                'stackTrace': 'null'
            }
        }
    ]
}

Another example in JSON format demonstrating multiple App Service logs:

{
    "records": [
        {
            "time": "2024-09-25T16:06:06.684521Z",
            "resourceId": "/SUBSCRIPTIONS/5487D26-B51D-46BE-AD45-6E12ACCF7E7/RESOURCEGROUPS/RG-AZ204-APIM/PROVIDERS/MICROSOFT.WEB/SITES/FLIGHTLOGSAZ204",
            "category": "AppServiceAppLogs",
            "operationName": "Microsoft.Web/sites/log",
            "level": "Information",
            "resultDescription": "Hosting environment: Production",
            "properties": {
                "preciseDateTime": "2024-09-25T16:06:03.0637930+00:00",
                "resourceId": "flightlogsa204.azurewebsites.net",
                "source": "Microsoft.Diagnostics.Tracing.ETWTraceEventSource",
                "webSiteInstanceId": "",
                "level": "Information",
                "message": "Hosting environment: Production",
                "stacktrace": null
            }
        },
        {
            "time": "2024-09-25T16:06:06.684563Z",
            "resourceId": "/SUBSCRIPTIONS/5487D26-B51D-46BE-AD45-6E12ACCF7E7/RESOURCEGROUPS/RG-AZ204-APIM/PROVIDERS/MICROSOFT.WEB/SITES/FLIGHTLOGSAZ204",
            "category": "AppServiceAppLogs",
            "operationName": "Microsoft.Web/sites/log",
            "level": "Information",
            "resultDescription": "Content root path: C:\\home\\site\\wwwroot",
            "properties": {
                "preciseDateTime": "2024-09-25T16:06:03.0644247+00:00",
                "resourceId": "flightlogsa204.azurewebsites.net",
                "source": "Microsoft.Diagnostics.Tracing.ETWTraceEventSource",
                "webSiteInstanceId": "",
                "level": "Information",
                "message": "Content root path: C:\\home\\site\\wwwroot",
                "stacktrace": null
            }
        },
        {
            "time": "2024-09-25T16:06:06.684574Z",
            "resourceId": "/SUBSCRIPTIONS/5487D26-B51D-46BE-AD45-6E12ACCF7E7/RESOURCEGROUPS/RG-AZ204-APIM/PROVIDERS/MICROSOFT.WEB/SITES/FLIGHTLOGSAZ204",
            "category": "AppServiceAppLogs",
            "operationName": "Microsoft.Web/sites/log",
            "level": "Information",
            "resultDescription": "Application is shutting down...",
            "properties": {
                "preciseDateTime": "2024-09-25T16:06:03.0649820+00:00",
                "resourceId": "flightlogsa204.azurewebsites.net",
                "source": "Microsoft.Diagnostics.Tracing.ETWTraceEventSource",
                "webSiteInstanceId": "",
                "level": "Information",
                "message": "Application is shutting down...",
                "stacktrace": null
            }
        }
    ]
}

These examples demonstrate how multiple records can be captured together, highlighting the batch processing capabilities of Event Hubs Capture. For improved readability during debugging, consider copying the output into an editor like Visual Studio Code.


Verifying Capture Output in Storage

To verify that events are captured correctly, follow these steps:

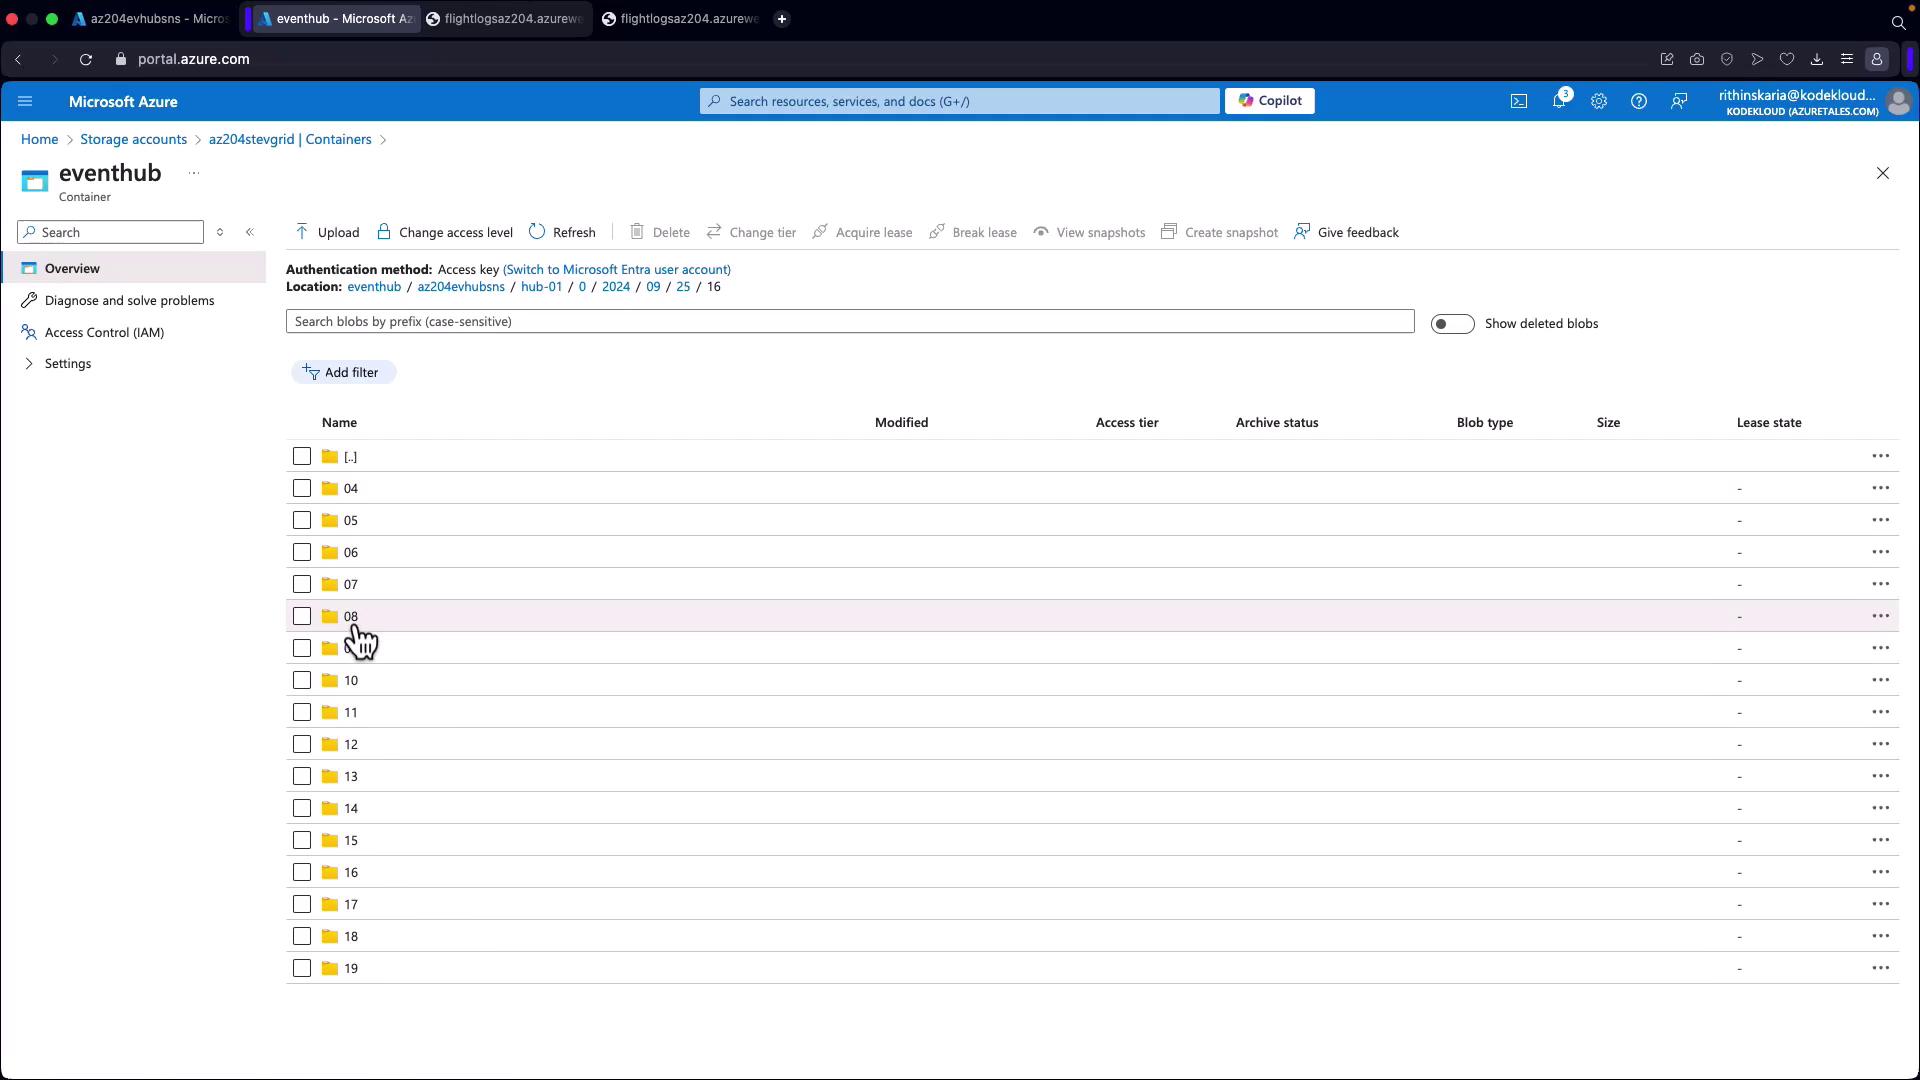
  1. Access the Storage Account
    Navigate to the Azure Portal and open your configured storage account. Under the "Containers" section, select the container associated with your Event Hub.

  2. Review the Capture Folders
    You will see folders generated based on the capture window configuration, typically named with timestamps. For example, you might see a folder labeled with a timestamp like "0-20-24, September 25th, four." Opening this folder will reveal an AVRO file containing your event records.

    The image shows the Microsoft Azure Data Explorer interface, displaying event data from an Event Hub. It includes details like sequence numbers, partition IDs, and event bodies in JSON format.

    The image shows the Microsoft Azure portal displaying a list of folders within a storage container named "eventhub." The interface includes options for managing the blobs, such as uploading, deleting, and changing access levels.

Capture Window Adjustment

Remember, adjusting the capture window size will influence the number of files generated. A smaller window will result in more files, making it useful for demonstration purposes.


Conclusion

In this guide, you've learned how Azure Event Hubs Capture seamlessly streams and stores event data, the advantages of its windowing and throughput mechanisms, and the steps required to set it up using the Azure Portal. This robust and scalable feature ensures that your event-driven applications can efficiently process data in near real-time, whether for live analysis or batch processing.

By integrating Event Hubs Capture into your solution, you can ensure reliable and efficient data ingestion that scales with your application's needs.

For additional resources, consider exploring the following:

Happy streaming!

Watch Video

Watch video content

Previous
Discovering Azure Event Hubs