Core Features of Application Insights
Live Metrics
Experience real-time monitoring without impacting application performance. Live Metrics lets you track critical metrics as they happen, giving immediate visibility into system health during active operations.Availability (Synthetic Transaction Monitoring)
Simulate user activity with synthetic transactions to ensure that your application endpoints are always reachable and performing optimally over time.GitHub or DevOps Integration
Integrate seamlessly with GitHub and Azure DevOps. Application Insights can automatically generate work items for detected performance issues, streamlining your workflow and enabling timely resolution directly from your development environment.Usage Analytics
Gain deep insights into user behavior and interaction patterns. Understand which features drive engagement and identify opportunities for improvement based on real user data.Smart Detection
Automatically detect anomalies and potential failures by harnessing telemetry data. Smart Detection helps you proactively address issues before they escalate, ensuring consistent application health.Application Map
Visualize your application’s architecture along with its dependencies. The Application Map provides a clear overview of service interactions, helping you quickly pinpoint bottlenecks or potential issues.Distributed Tracing
Trace the flow of requests across various components of your application. Distributed Tracing provides an end-to-end view of execution paths, enabling you to identify latency issues and optimize performance.
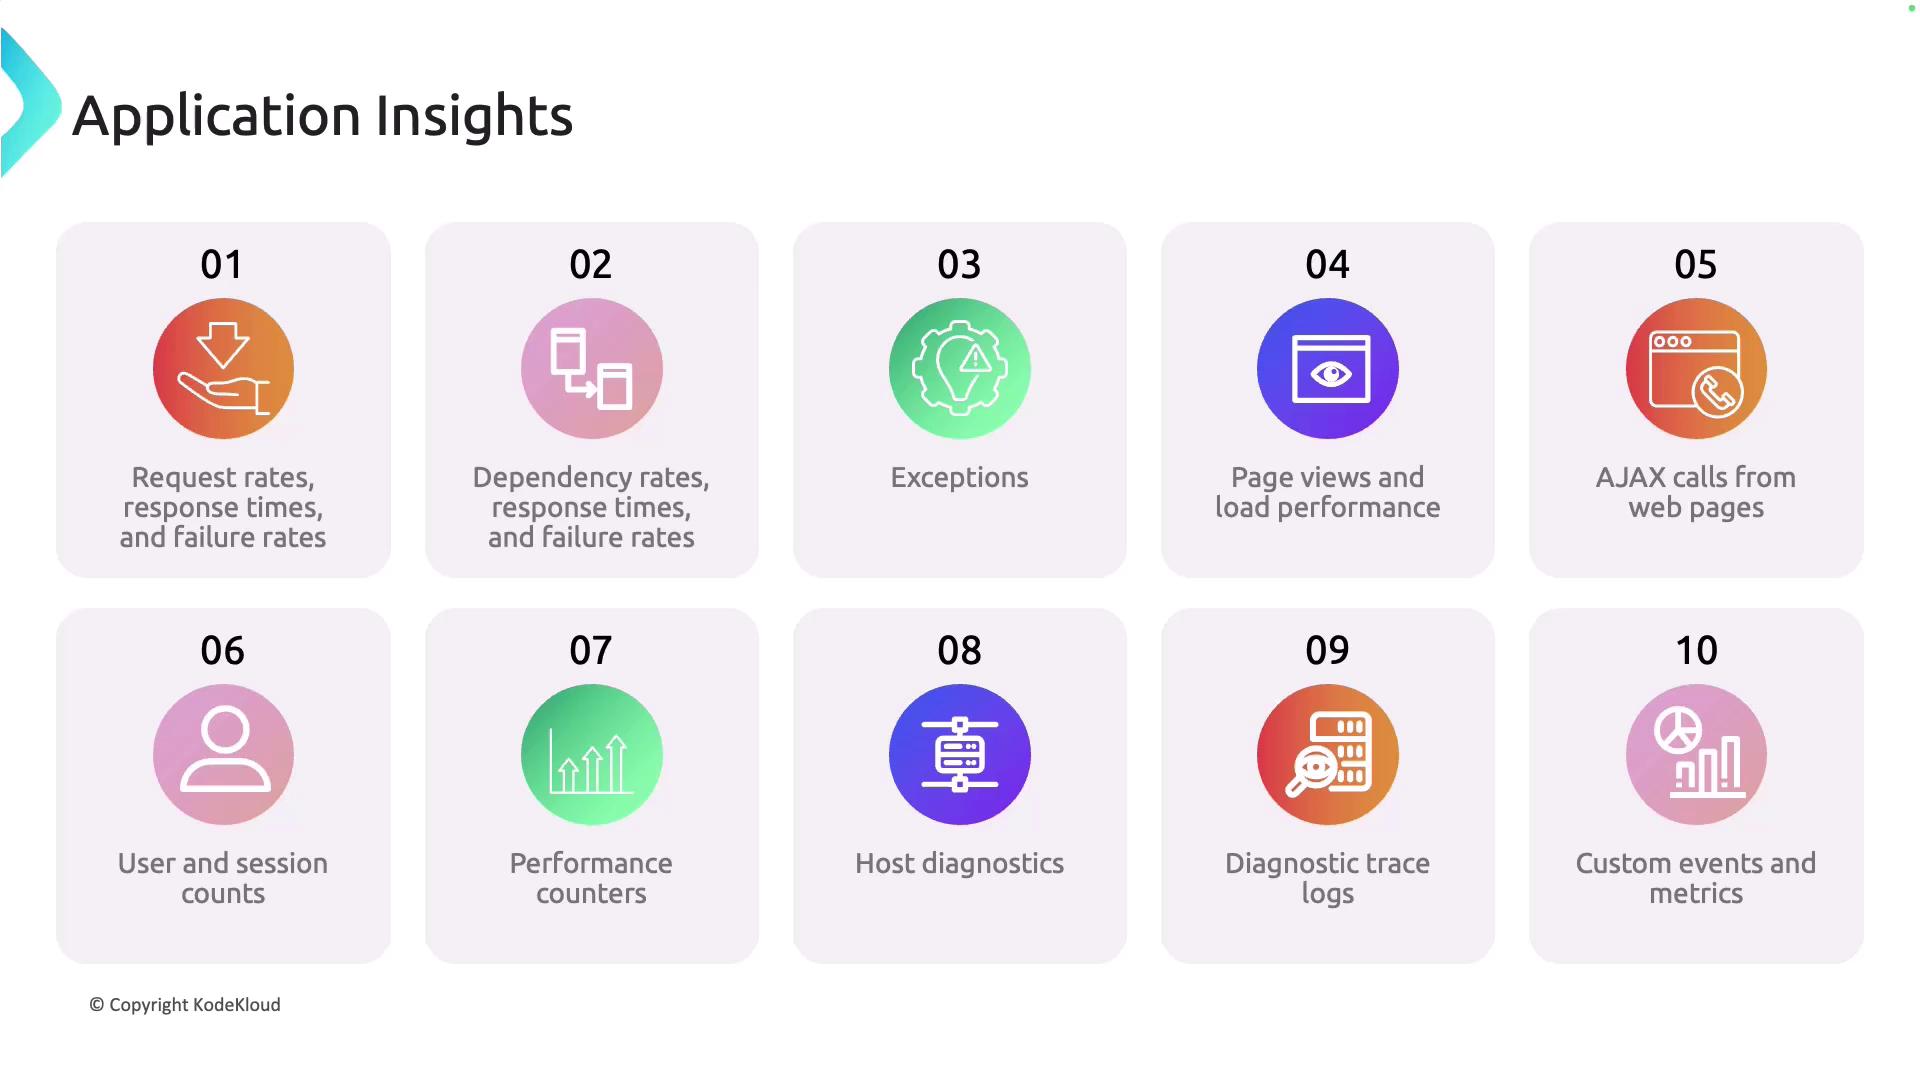
Metrics and Data Captured by Application Insights
Application Insights collects a wide array of performance indicators and diagnostic data to help you monitor and optimize your application. Key metrics include:- Request Rates, Response Times, and Failure Rates: Track how quickly your application responds and monitor error frequencies over time.
- Dependency Metrics: Measure the performance and reliability of external dependencies such as databases, storage accounts, and third-party services.
- Exceptions: Access detailed exception logs to diagnose and troubleshoot issues effectively.
- Page Views and Load Performance: Monitor web page traffic and load times to ensure an optimal user experience.
- AJAX Calls: Evaluate the performance of asynchronous calls to ensure smooth interactions on your webpages.
- User and Session Counts: Understand user engagement by analyzing the number of active users and their session behaviors.
- Performance Counters: Track system resources including CPU, memory, disk, and network usage for comprehensive performance monitoring.
- Host Diagnostics: Inspect the health of the underlying infrastructure that powers your application.
- Diagnostic Trace Logs: Follow detailed trace logs to pinpoint specific events or errors.
- Custom Events and Metrics: Capture unique business events to gain tailored insights into your application’s performance.
Integration Stages for Application Insights
Application Insights can be seamlessly integrated throughout the entire lifecycle of your application to ensure continuous monitoring and diagnostics:- At Runtime: Gather real-time telemetry data during your application’s operations for immediate diagnostics.
- During Development: Instrument your application from the start to capture vital telemetry and add tracking scripts to monitor user interactions right from your webpages.
- Mobile Applications: Incorporate Application Insights into mobile apps to monitor performance and usage patterns on the go.
- Availability Testing: Set up synthetic tests to simulate user interactions across various regions, verifying endpoint accessibility and ensuring consistent performance.
Integrating Application Insights at multiple stages of your development process not only enhances visibility but also accelerates troubleshooting and optimization.