Log-Based Metrics
Log-based metrics capture every event as it occurs, storing them as logs in Application Insights. This provides a highly granular view, allowing for detailed diagnostic analysis directly within the Azure Portal. While this approach is beneficial for troubleshooting and investigating individual events, keep in mind that high telemetry volume may result in significant data storage overhead.Use log-based metrics when detailed visibility into each event is necessary, especially during troubleshooting or performance analysis.
Pre-Aggregated Metrics
Pre-aggregated metrics compile telemetry data into summarized time series, retaining only the key dimensions needed for monitoring. This significantly reduces storage requirements and is ideal for applications that generate large volumes of telemetry. Modern SDKs support pre-aggregation by default, ensuring efficient data collection. Even if your chosen SDK does not support pre-aggregation, Application Insights can automatically aggregate incoming events.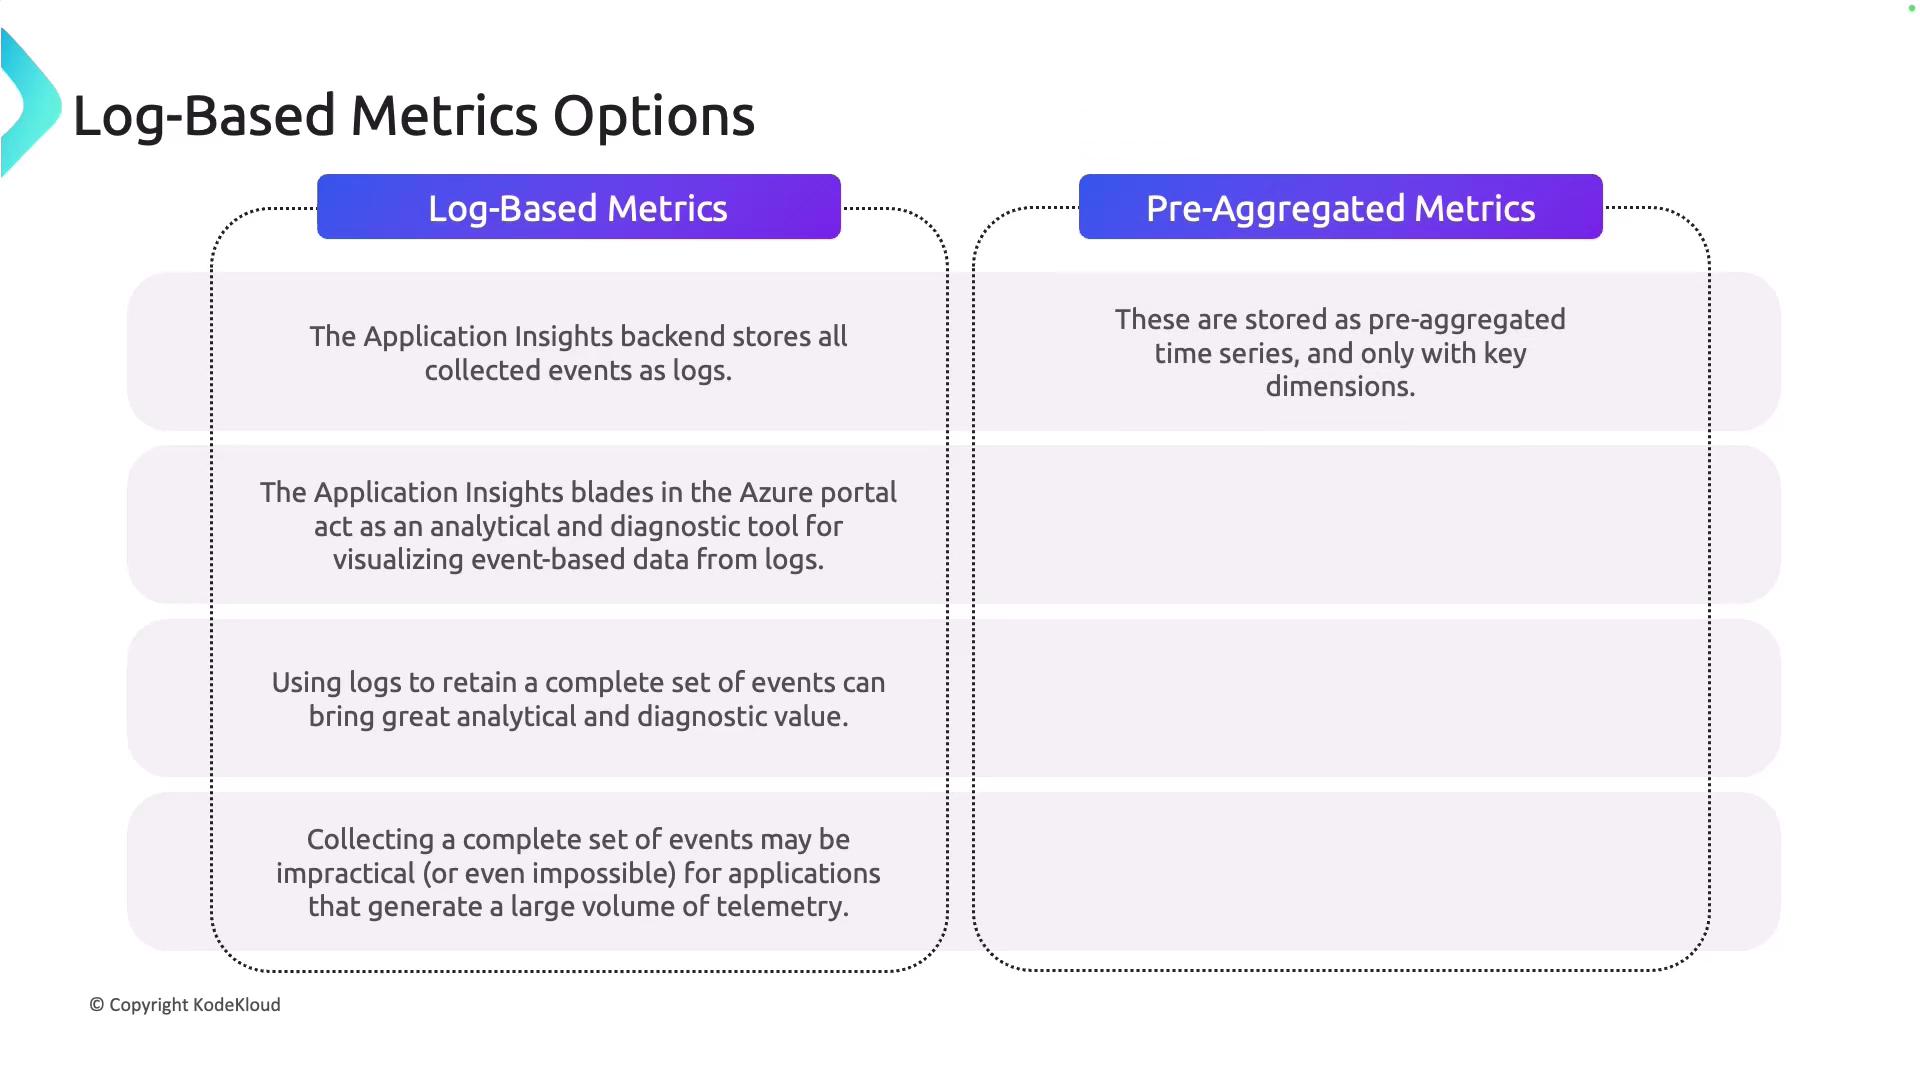
Instrumenting Your Application
Monitoring begins with proper instrumentation. Application Insights offers two main approaches: auto-instrumentation and distributed tracing. Both methods help ensure comprehensive visibility into your application’s behavior.Auto-Instrumentation
Auto-instrumentation enables telemetry collection without modifying your application code. This method is particularly useful for quickly setting up monitoring across various frameworks and environments such as .NET, Java, Node.js, Python, and numerous Azure services. For instance, in a .NET application you can enable auto-instrumentation via the Application Insights SDK without altering your codebase. Similarly, Azure App Service or Function App users can easily activate Application Insights by configuring the agent, which automatically gathers telemetry data like metrics, requests, dependencies, and logs.Distributed Tracing
Distributed tracing is essential for observing microservices and complex distributed systems. It tracks the progress of a request as it flows through multiple services, allowing you to visualize transaction paths, spot performance bottlenecks, and diagnose issues spanning multiple components. You can enable distributed tracing by instrumenting your application with the Application Insights SDK for .NET, Java, Node.js, or Python. Additionally, libraries like OpenCensus can integrate with Application Insights to offer comprehensive tracing across distributed environments.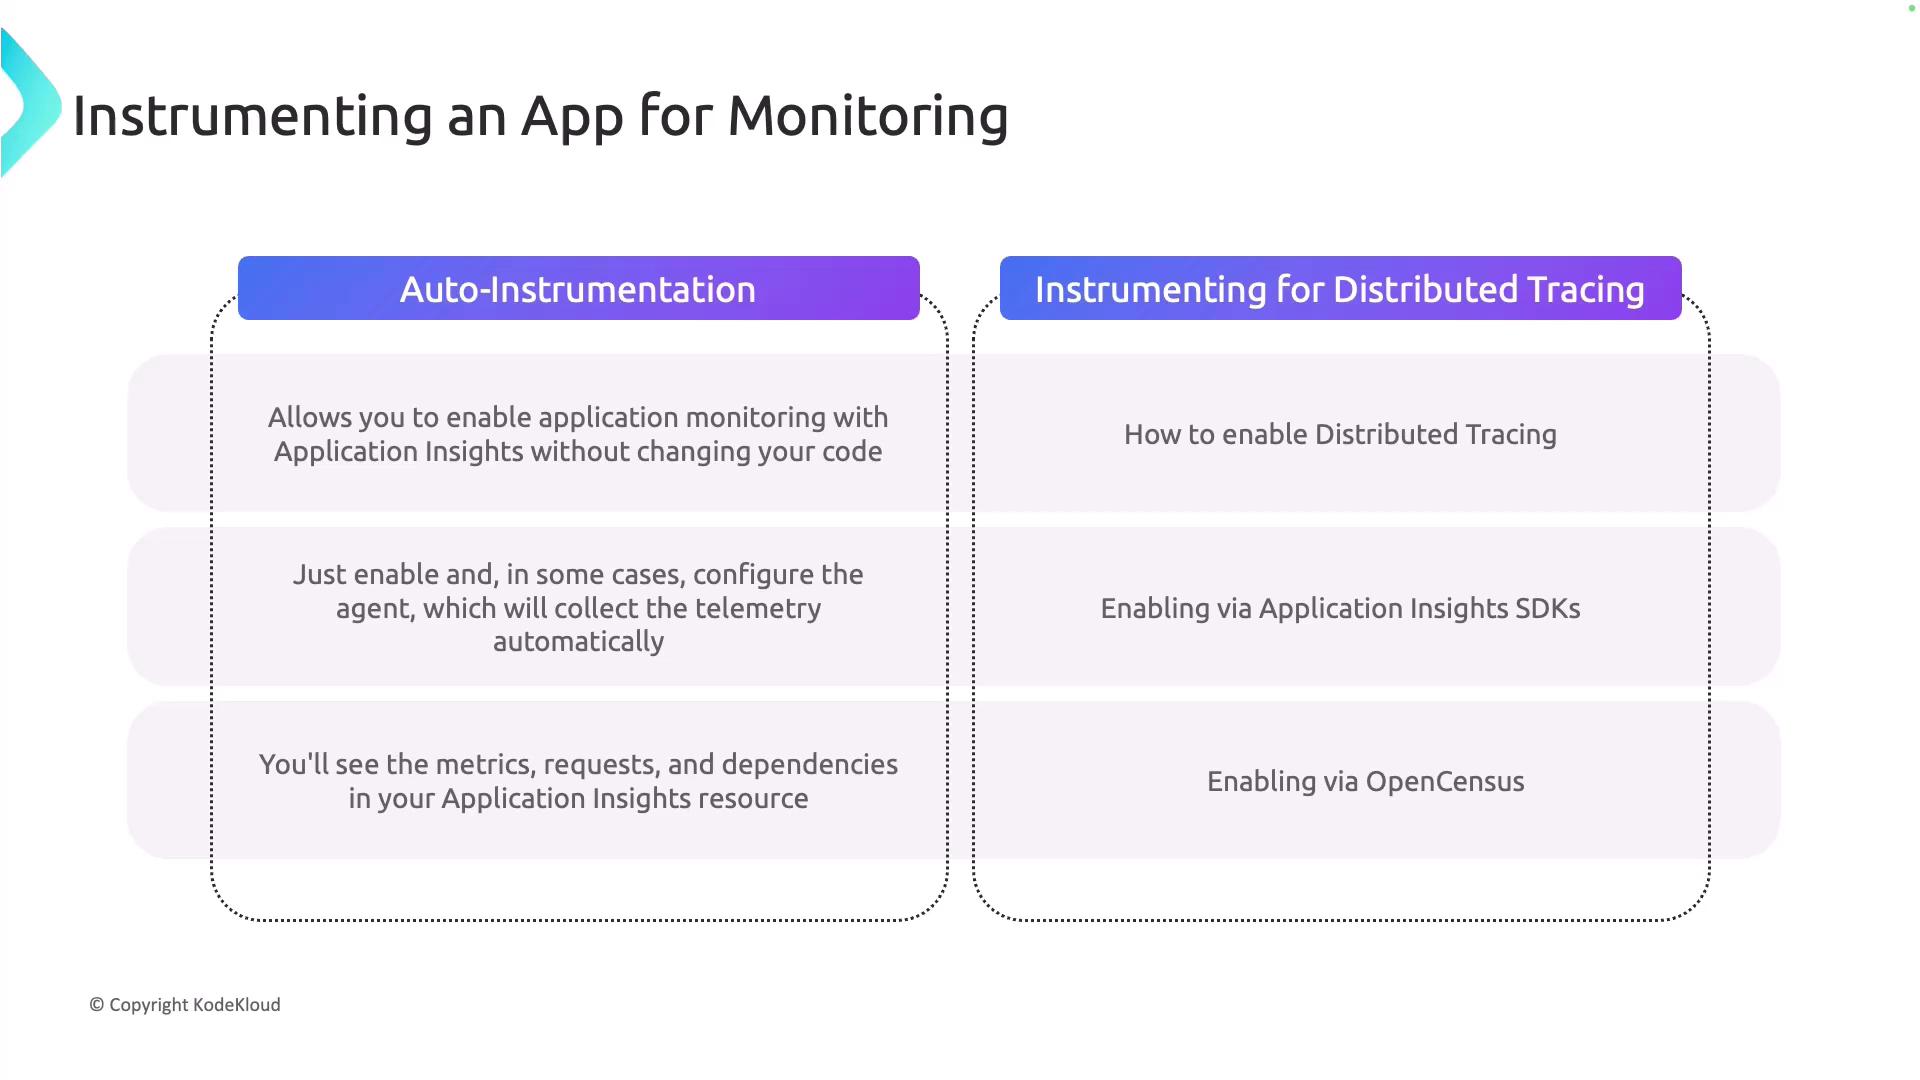
Use Application Maps in Application Insights to visualize interconnected components of your application. This tool helps pinpoint performance bottlenecks and identify failing dependencies quickly.