Troubleshooting App Performance by Using Application Map
This article explores troubleshooting application performance issues using the Application Map feature in Application Insights.
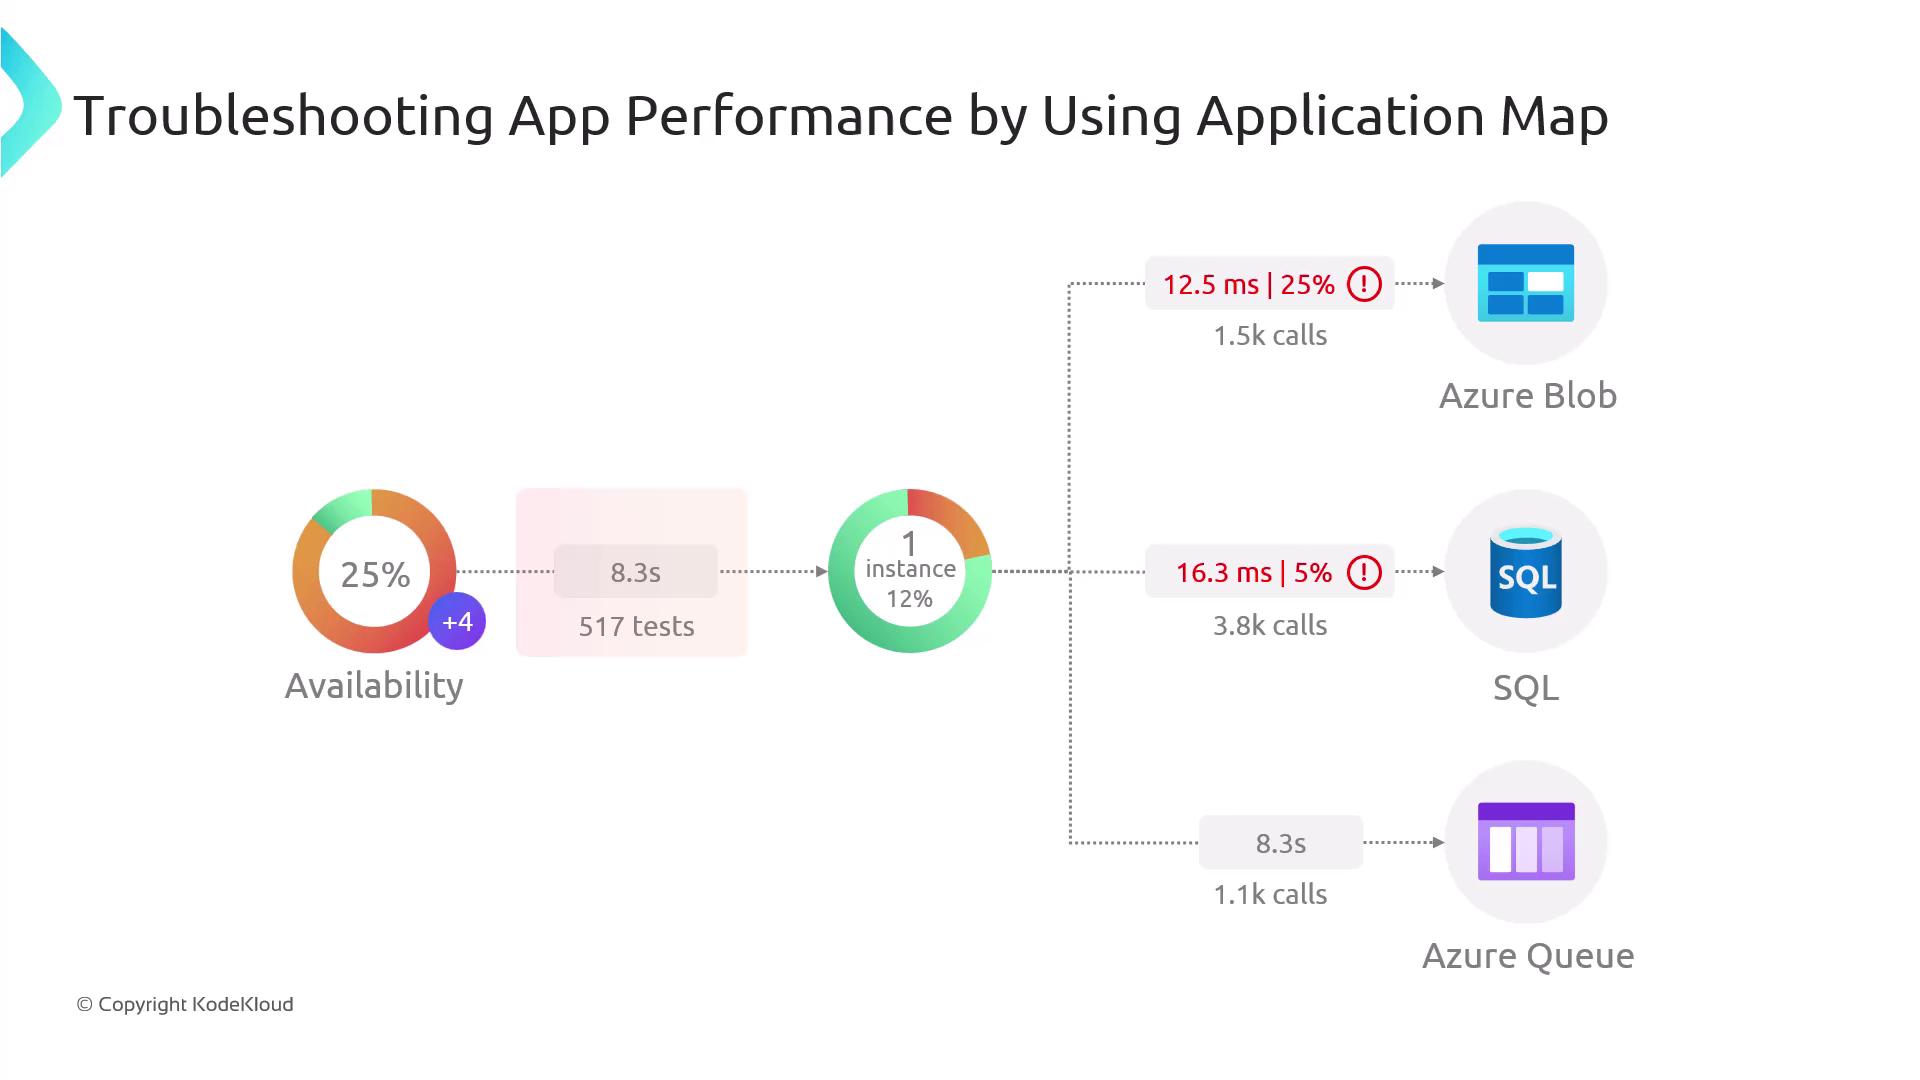
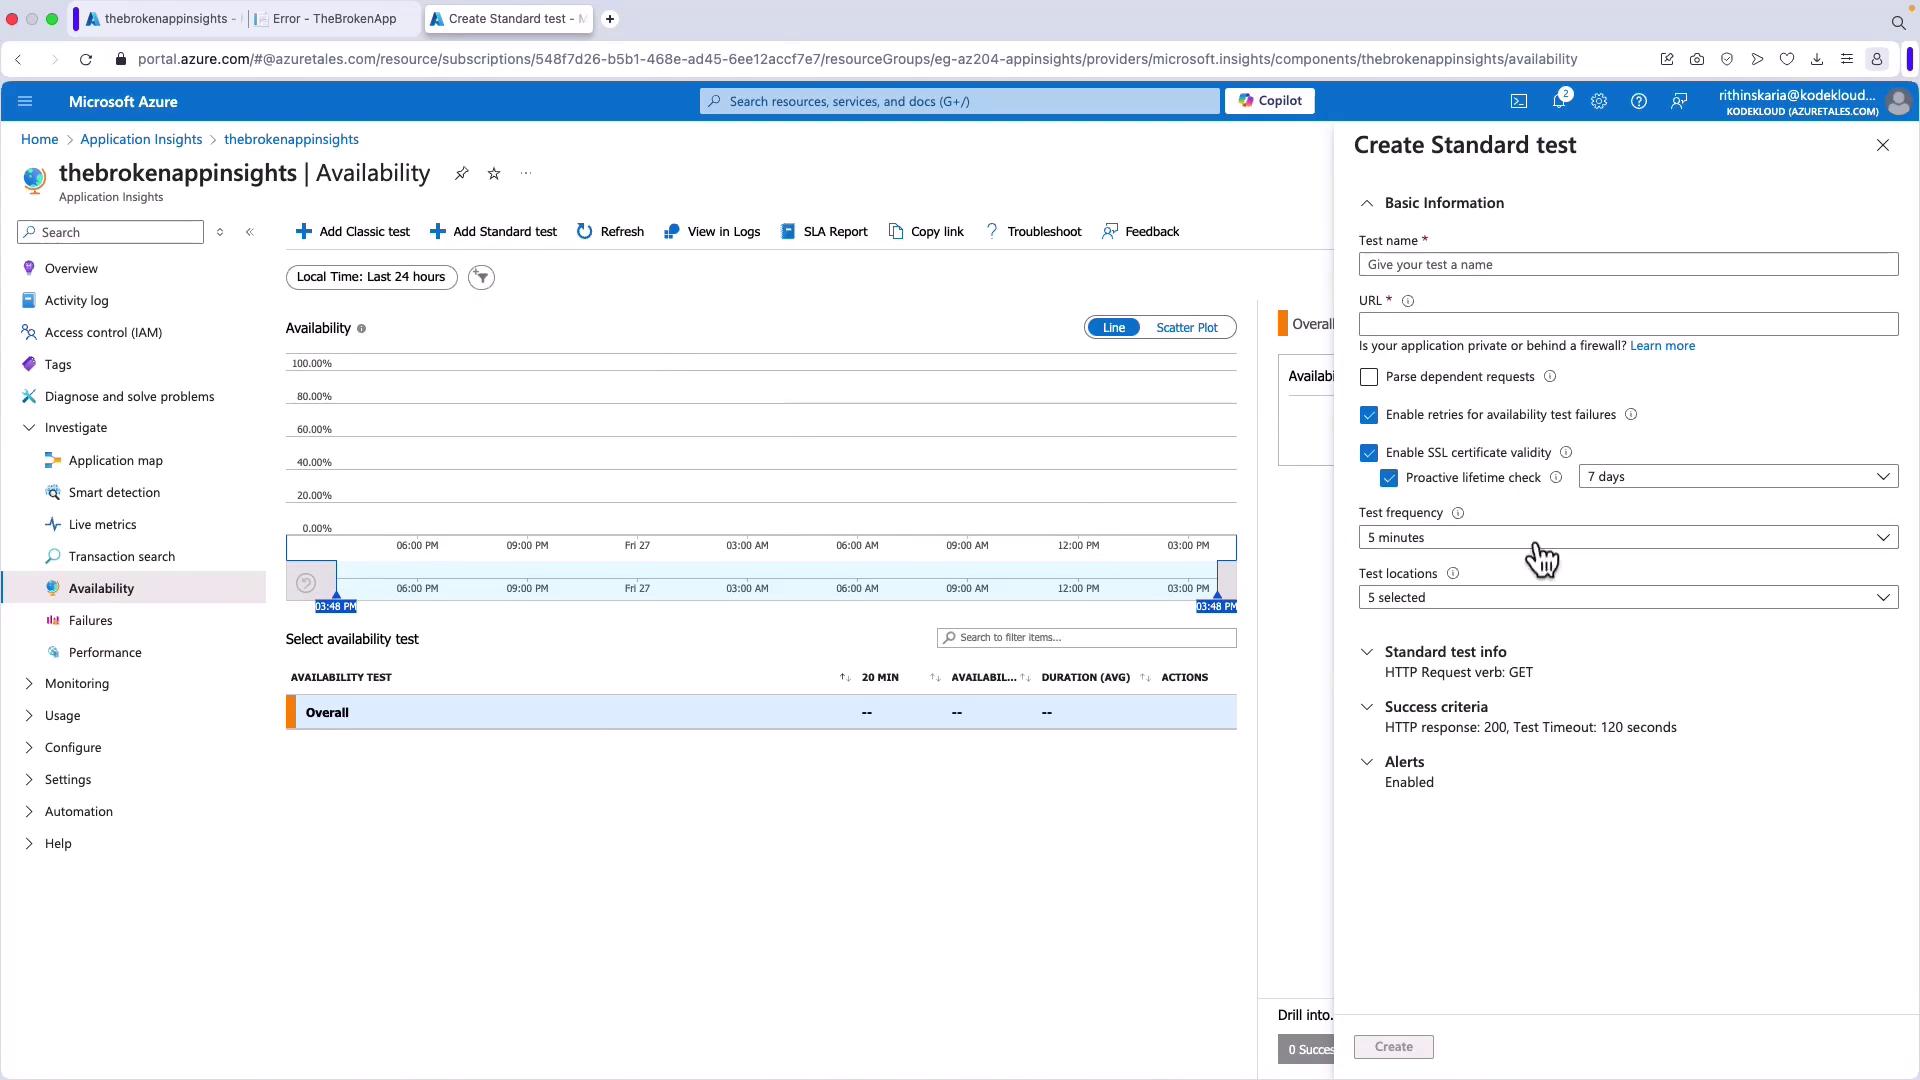
In this lesson, we’ll explore how to troubleshoot application performance issues with the Application Map feature in Application Insights. Application Map gives you a high-level visual overview of how different components within your application interact. This tool enables you to quickly pinpoint performance bottlenecks and identify failing services through a clear depiction of dependencies.Let’s start by reviewing an overview diagram of Application Map:At the center of the map is a circle that represents one instance of the application handling 12% of the total load. Surrounding this central instance are several connected components—including Azure Blob Storage, SQL, and Cube—that display their own performance metrics. Notice the availability circle on the left, illustrating an overall system availability of 25%. Application Insights allows you to set up an Availability Test, which in this case shows 517 tests conducted with an average response time of 8.3 seconds. This feature lets you test any HTTP or HTTPS endpoint without modifying the target website. It is particularly useful when monitoring dependencies like REST APIs, even if the site isn’t owned by you. Typically, you can create up to 100 Availability Tests per Application Insights resource. A red availability metric indicates that the application is not consistently available.
Observing the diagram further, on the right side, the application interacts with various services:
Azure Blob Storage: Displays 1.5k calls with an alert indicating a response time of 12.5ms and approximately 25% failed calls—suggesting a potential bottleneck.
SQL Database: Handles about 3.8k calls with a 16.3ms response time and 5% call failures, which needs further investigation to avoid database performance issues.
Azure Queue Storage: Shows 1.1k calls with an 8.3-second response time, but with no critical errors, indicating acceptable performance.
Using Application Map, you can inspect all dependencies and click on individual items for detailed diagnostics and a comprehensive understanding of request flows.
After exploring the Application Map, we will now demonstrate how to capture exceptions and monitor performance issues using Application Insights directly in the Azure Portal.
Deploying a Web Application with Application Insights
In this demonstration, we will deploy an Azure App Service using Application Insights to monitor performance and capture telemetry data. Follow these steps in the Azure Portal:
Navigate to App Services and create a new Web App.
Select an existing App Service plan (for example, one that already runs flight logs and other APIs) and create a new resource group named “RGAZ204 App Service”.
Name the app “Broken Application Insights”.
Choose .NET 8 and deploy in the Canada Central region.
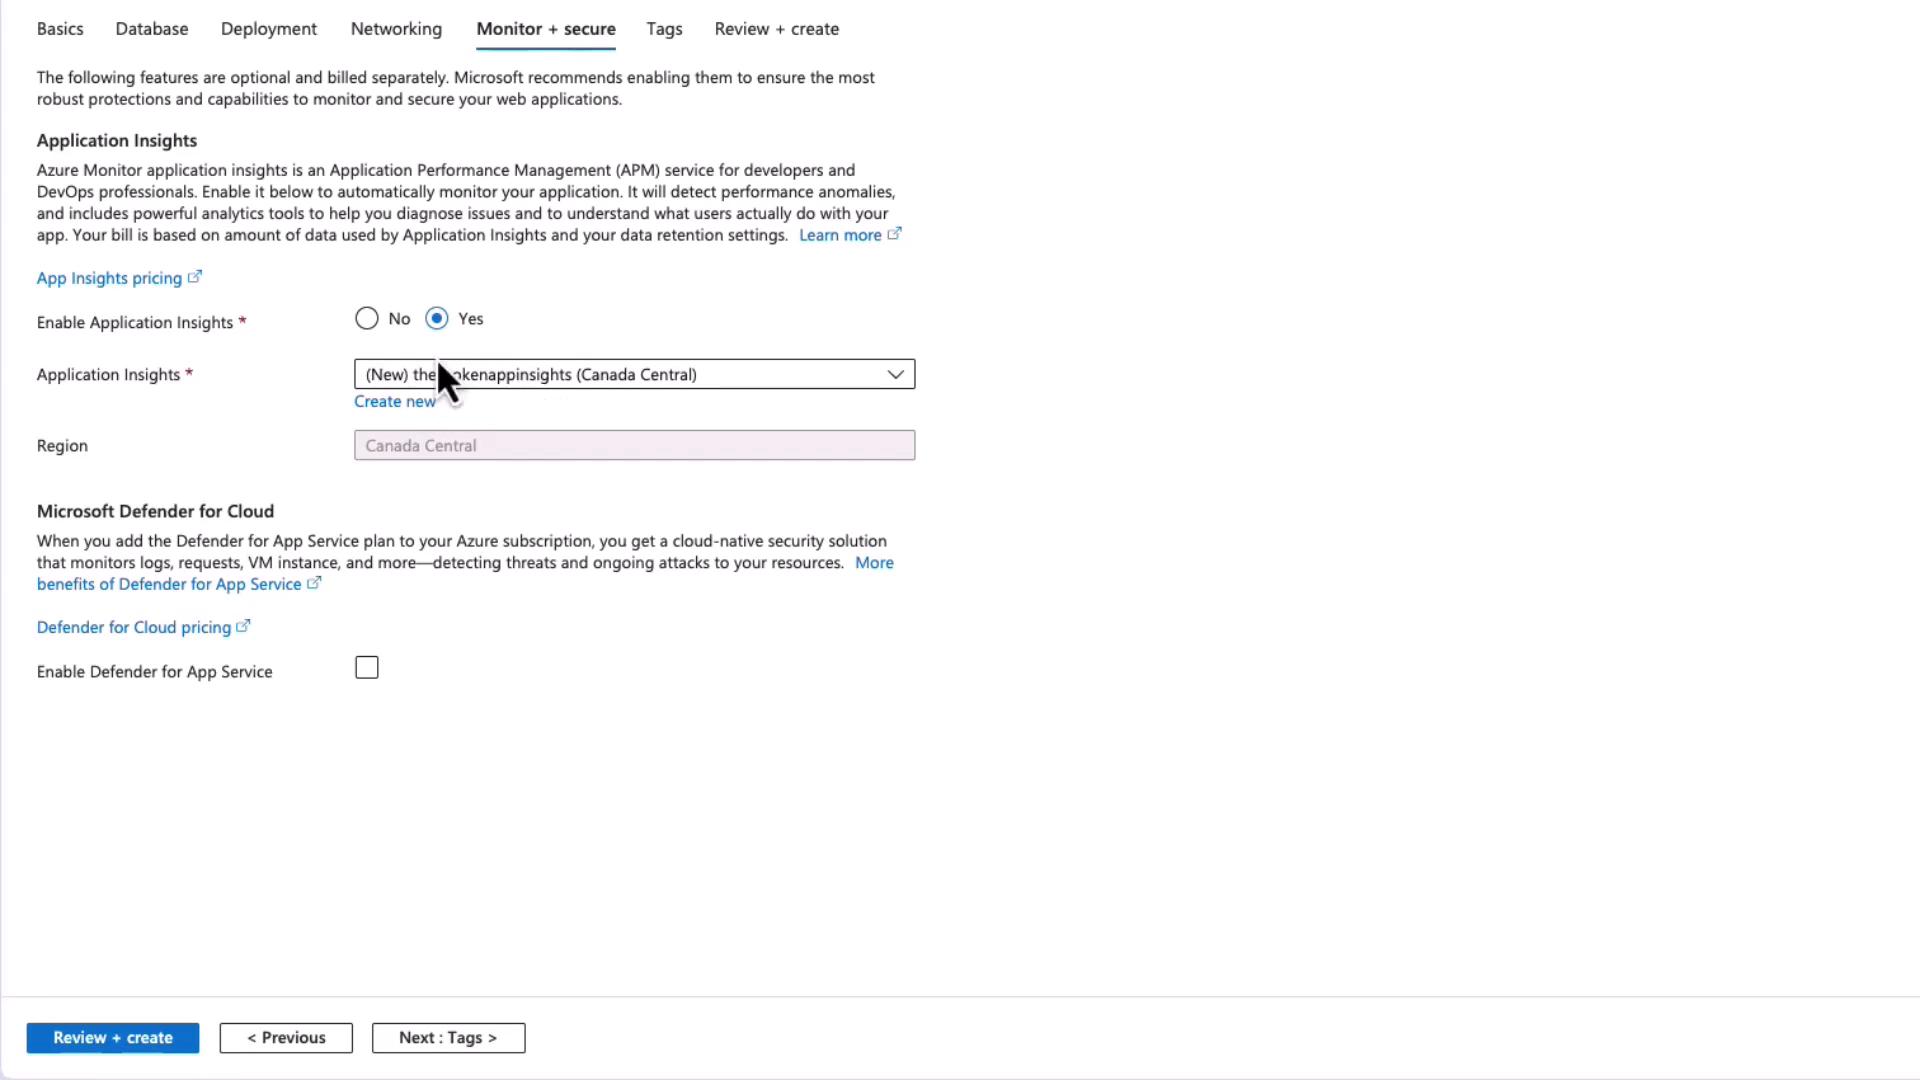
Even though a database isn’t required, enable Application Insights by selecting “Yes” on the configuration screen under the Monitor plus Secure section.
After clicking on “Review and Create”, the web app is deployed. Once completed, click “Go to Resource” to confirm that Application Insights is enabled and connected. You can later adjust telemetry data collection by selecting the Recommended option, which includes:
Application Insights SDK Interop: Loads the Application Insights extension along with your SDK for seamless telemetry data collection.
Profiler: Records detailed traces to analyze where time is spent in your code, helping to diagnose performance issues.
Snapshot Debugger: Captures call stacks and local variables when exceptions occur to aid in root cause analysis.
SQL Commands: Monitors SQL queries, showing compiled commands and associated parameters during web requests to identify inefficient queries.
Click “Apply” to set the desired monitoring settings for your application.
The demonstration application, known as the Broken App, is specifically designed to simulate several common exceptions for testing Application Insights. The landing page includes buttons to trigger different exception types:
The following code samples show how various exceptions are triggered within the app:
Copy
// Trigger DivideByZeroExceptionpublic IActionResult OnGetDivideByZero(){ int zero = 0; var result = 1 / zero; return Page();}// Trigger a Custom Exceptionpublic IActionResult OnGetCustomException(){ throw new InvalidOperationException("This is a custom exception for demo purposes.");}// Trigger a Broken Database Connectionpublic IActionResult OnGetDatabaseError(){ string connectionString = "Server=tcp:brokenserver.database.windows.net;Database=NonExistentDB;User Id=baduser;Password=badpassword;"; try { using (SqlConnection connection = new SqlConnection(connectionString)) { connection.Open(); } } catch (SqlException ex) { throw new InvalidOperationException("Database connection failed.", ex); } return Page();}
The main page also handles a Null Reference Exception as demonstrated below:
Copy
using Microsoft.AspNetCore.Mvc;using Microsoft.AspNetCore.Mvc.RazorPages;using System;using System.Data.SqlClient;public class IndexModel : PageModel{ public void OnGet() { } // Trigger NullReferenceException public IActionResult OnGetNullReference() { string? nullString = null; var length = nullString.Length; return Page(); } // Trigger DivideByZeroException public IActionResult OnGetDivideByZero() { int zero = 0; var result = 1 / zero; return Page(); }}
Below is an example run log of the Broken App:
Copy
TheBrokenApp> dotnet runBuilding.../Users/rithinskaria/Projects/TheBrokenApp/Pages/Index.cshtml.cs(16,22): warning CS8602: Dereference of a possibly null reference. [/Users/rithinskaria/Projects/TheBrokenApp/TheBrokenApp.csproj]info: Microsoft.Hosting.Lifetime[14] Now listening on: http://localhost:5196info: Microsoft.Hosting.Lifetime[0] Application started. Press Ctrl+C to shut down...info: Microsoft.Hosting.Lifetime[0] Hosting environment: Developmentinfo: Microsoft.Hosting.Lifetime[0] Content root path: /Users/rithinskaria/Projects/TheBrokenApp/TheBrokenAppinfo: Microsoft.AspNetCore.Hosting.Diagnostics[2] Request starting HTTP/1.1 GET http://localhost:5196/ [/Users/rithinskaria/Projects/TheBrokenApp/TheBrokenApp]info: Microsoft.AspNetCore.Hosting.Diagnostics[1] Request finished in 16.1776ms 200
After deploying the Broken App, navigate to its overview in the Azure Portal and click on Application Insights to verify that telemetry is being captured. Telemetry records include 500 errors corresponding to the simulated exceptions: Null Reference Exception, Divide By Zero Exception, Custom Exception, and Broken Database Connection. Clicking on each error reveals a complete call stack and diagnostic details, including specific information about the non-existent database during the database error scenario.Additionally, Application Insights provides Live Metrics that enable you to monitor incoming requests and real-time exceptions. You can also use the Application Map to view your application instance, the database service (which, in this demo, does not return insights due to connection failure), and other related metadata services.
With Application Insights configured and exceptions captured, you now have a comprehensive view of your application’s performance, dependencies, and issues. This monitoring setup allows you to diagnose problems quickly and optimize performance in your production environment.For more details on Application Insights, please refer to the Microsoft Azure Documentation.