Data Collection from Multiple Sources
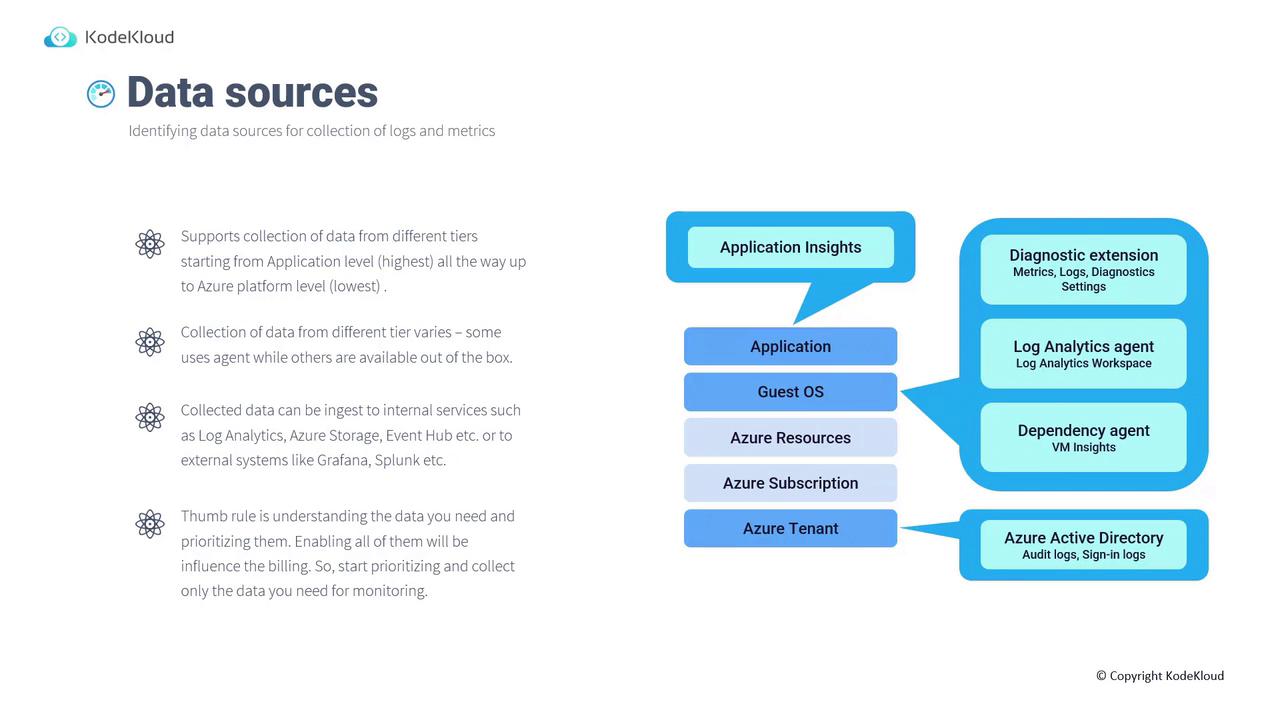
Identifying and prioritizing the right data sources is essential for efficient monitoring. Azure Monitor supports data collection across several tiers:-
Application Level:
Use Application Insights to collect application performance data. -
Guest Operating System:
Utilize diagnostic extensions, the Log Analytics agent, or the Dependency agent to gather metrics, logs, and perform dependency analysis. -
Azure Resources, Subscription, and Tenant:
- For Azure resources, configure diagnostic settings to collect logs and metrics.
- The subscription-level Activity Log is available by default and records all operations on Azure Resource Manager without extra configuration.
- At the tenant level, integrate with Azure Active Directory (Azure AD) to collect audit and sign-in logs.
Selecting the appropriate data collection method—whether agent-based or out-of-the-box—depends on your monitoring needs. Ensure you only collect the data you require, as unnecessary data can lead to higher billing costs.
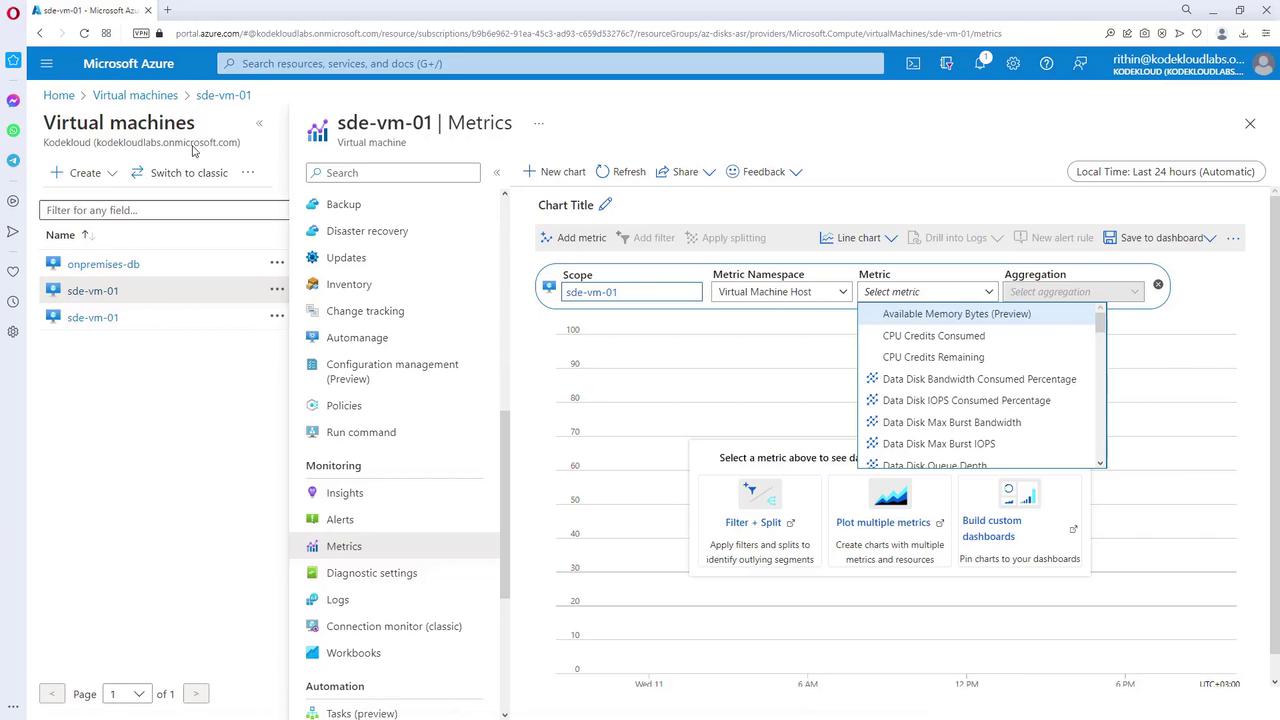
Configuring Monitoring on Virtual Machines
Configuring monitoring for a Virtual Machine (VM) in Azure is straightforward. By accessing a VM’s Insights section in the Azure portal (which requires an installed agent), you can enable monitoring. Once activated, the VM’s data is sent to a configured Log Analytics workspace, where you can review monitoring configurations and performance metrics.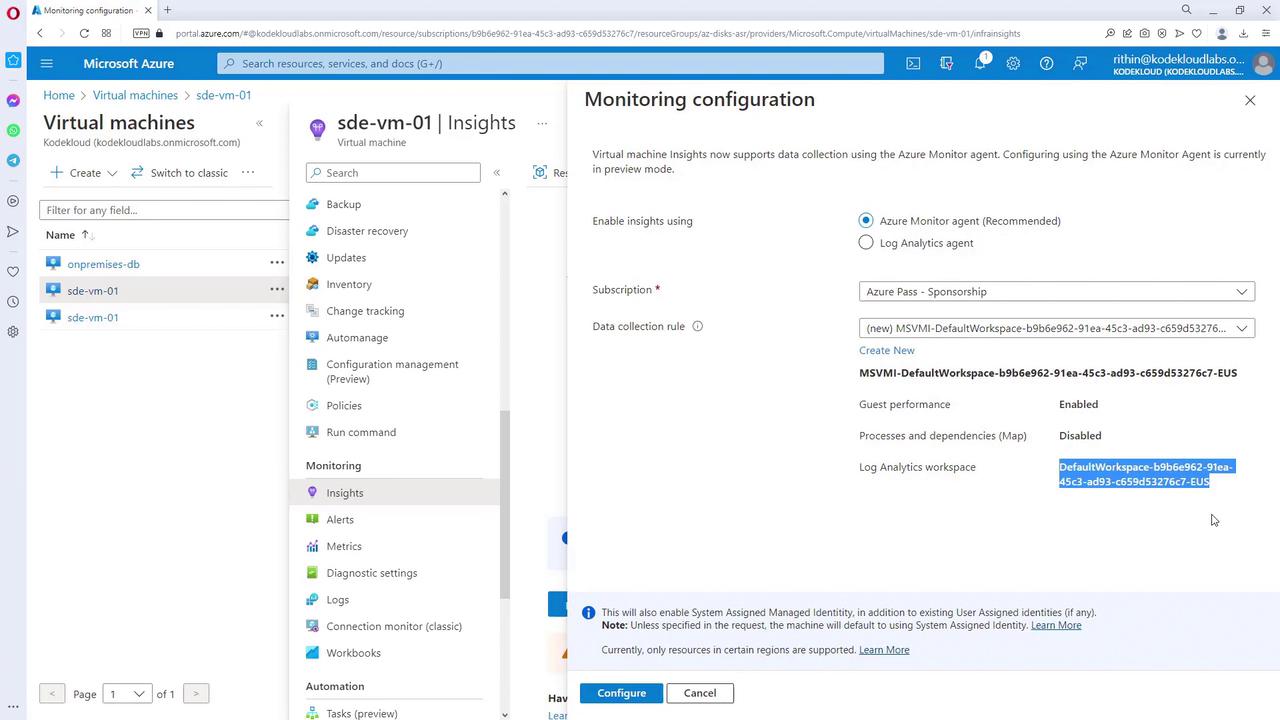
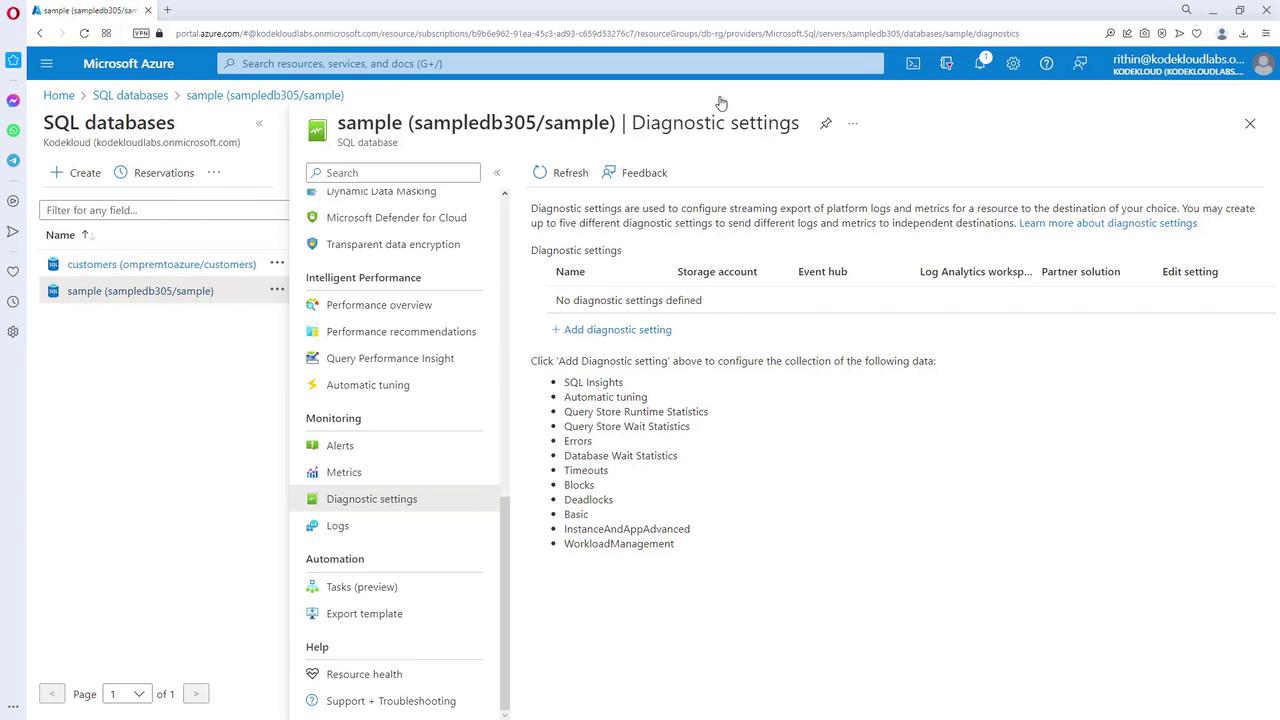
Diagnostic Settings for SQL Databases
For resources such as SQL databases, diagnostic settings provide enhanced logging capabilities. By accessing these settings, you can add new diagnostics and choose from various log categories and destinations. For example, if you only need security audit logs, enable just that category. Keep in mind that adding more log categories increases the ingested data volume, which can affect billing.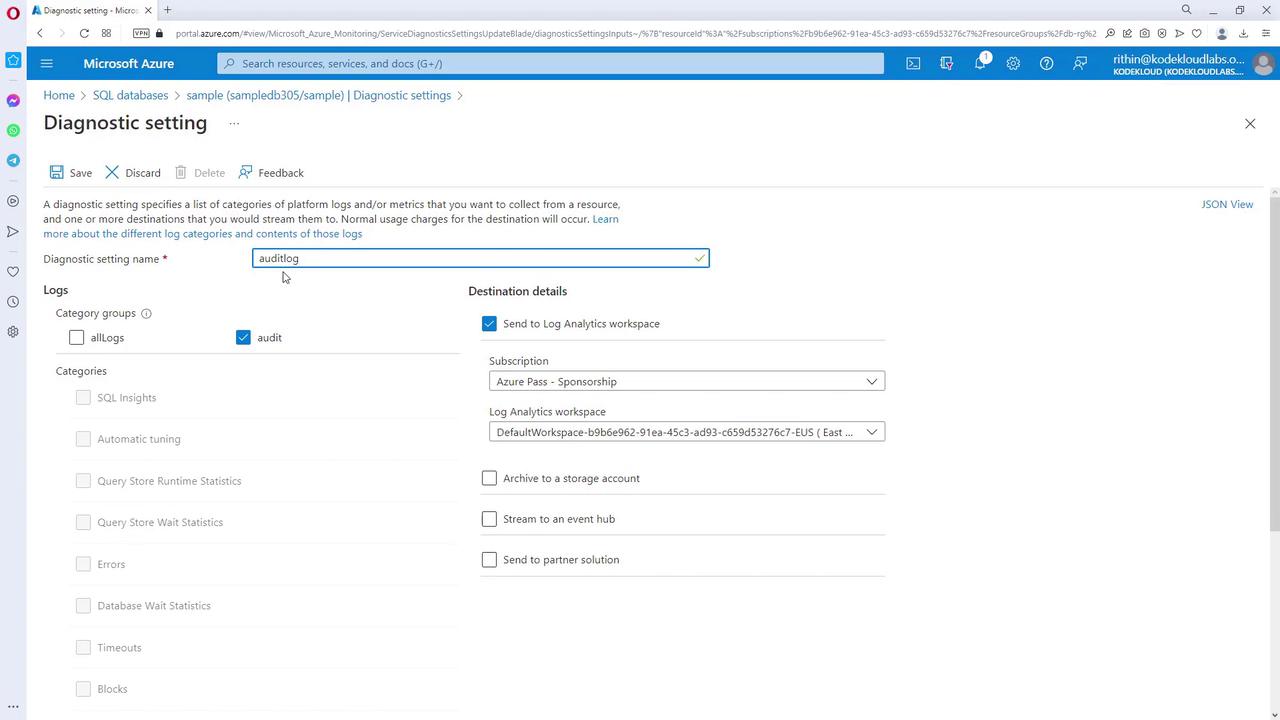
Monitoring Data Collection Methods
Below is a summary table outlining the various data collection methods available within Azure Monitor:| Data Source Type | Data Collection Method | Example/Tool |
|---|---|---|
| Application Level | Application Insights | Application performance monitoring |
| Guest Operating System | Diagnostic extensions, Log Analytics agent, Dependency agent | Metrics and dependency analysis |
| Azure Resources | Diagnostic settings | Log collection for Azure resources |
| Subscription and Tenant Levels | Activity Log, Azure AD integration | Audit and sign-in logs |