What is Log Analytics?
Log Analytics is a fully managed service within Azure Monitor that empowers you to collect, analyze, and visualize data from Azure resources, on‑premises systems, and non‑Azure environments. By onboarding your resources to a Log Analytics workspace, data from diagnostic settings and configurations is centralized and stored in tables, which can then be queried using the powerful Kusto Query Language (KQL).Data Collection
Data from a wide range of resources—whether hosted on Azure, on‑premises, or in other environments—can be ingested into a Log Analytics workspace. Any diagnostic settings configured in Azure Monitor send their collected data to the designated workspace. For instance, performance logs from hundreds of virtual machines could be stored in a table namedperf, while syslogs from Linux systems would be held in a syslog table.
Querying and Consolidation
Kusto Query Language (KQL) is the tool used to query and analyze this collected data, facilitating the creation of detailed reports and visualizations. Consider the following example, which queries theperf table to extract performance data related to SQL-related resources:
Learning KQL is highly recommended as it equips you with a powerful tool for troubleshooting, diagnostics, and generating rich workbooks.
Data Residency
To meet specific data residency requirements, you can create multiple Log Analytics workspaces in different Azure regions. This functionality is particularly useful for organizations that must comply with regulatory mandates or prefer localized data storage.Pricing and Data Retention
When designing a Log Analytics solution, it’s essential to consider both the pricing model and data retention policies:-
Pricing:
Choose between per-gigabyte pricing—where you pay based on data ingestion volume—or capacity pricing, which involves pre-purchasing a fixed daily data ingestion capacity (e.g., 100 GB per day). For high-volume environments, capacity pricing may offer significant cost advantages. -
Data Retention:
By default, data is retained for 30 days at no additional charge. Extended retention beyond 30 days incurs additional costs.
Data Capping
If you need to restrict the volume of ingested data, data capping rules can be applied. For instance, if you want to limit data ingestion to 1 GB per day, you can configure your data mapping rules to enforce this cap.Access Control and Data Mapping
Log Analytics workspaces structure data into various tables for different log types such as Windows event logs, Linux syslogs, performance counters, custom logs, and alerts. You can query these tables with KQL. For example:Designing Workspace Access Control
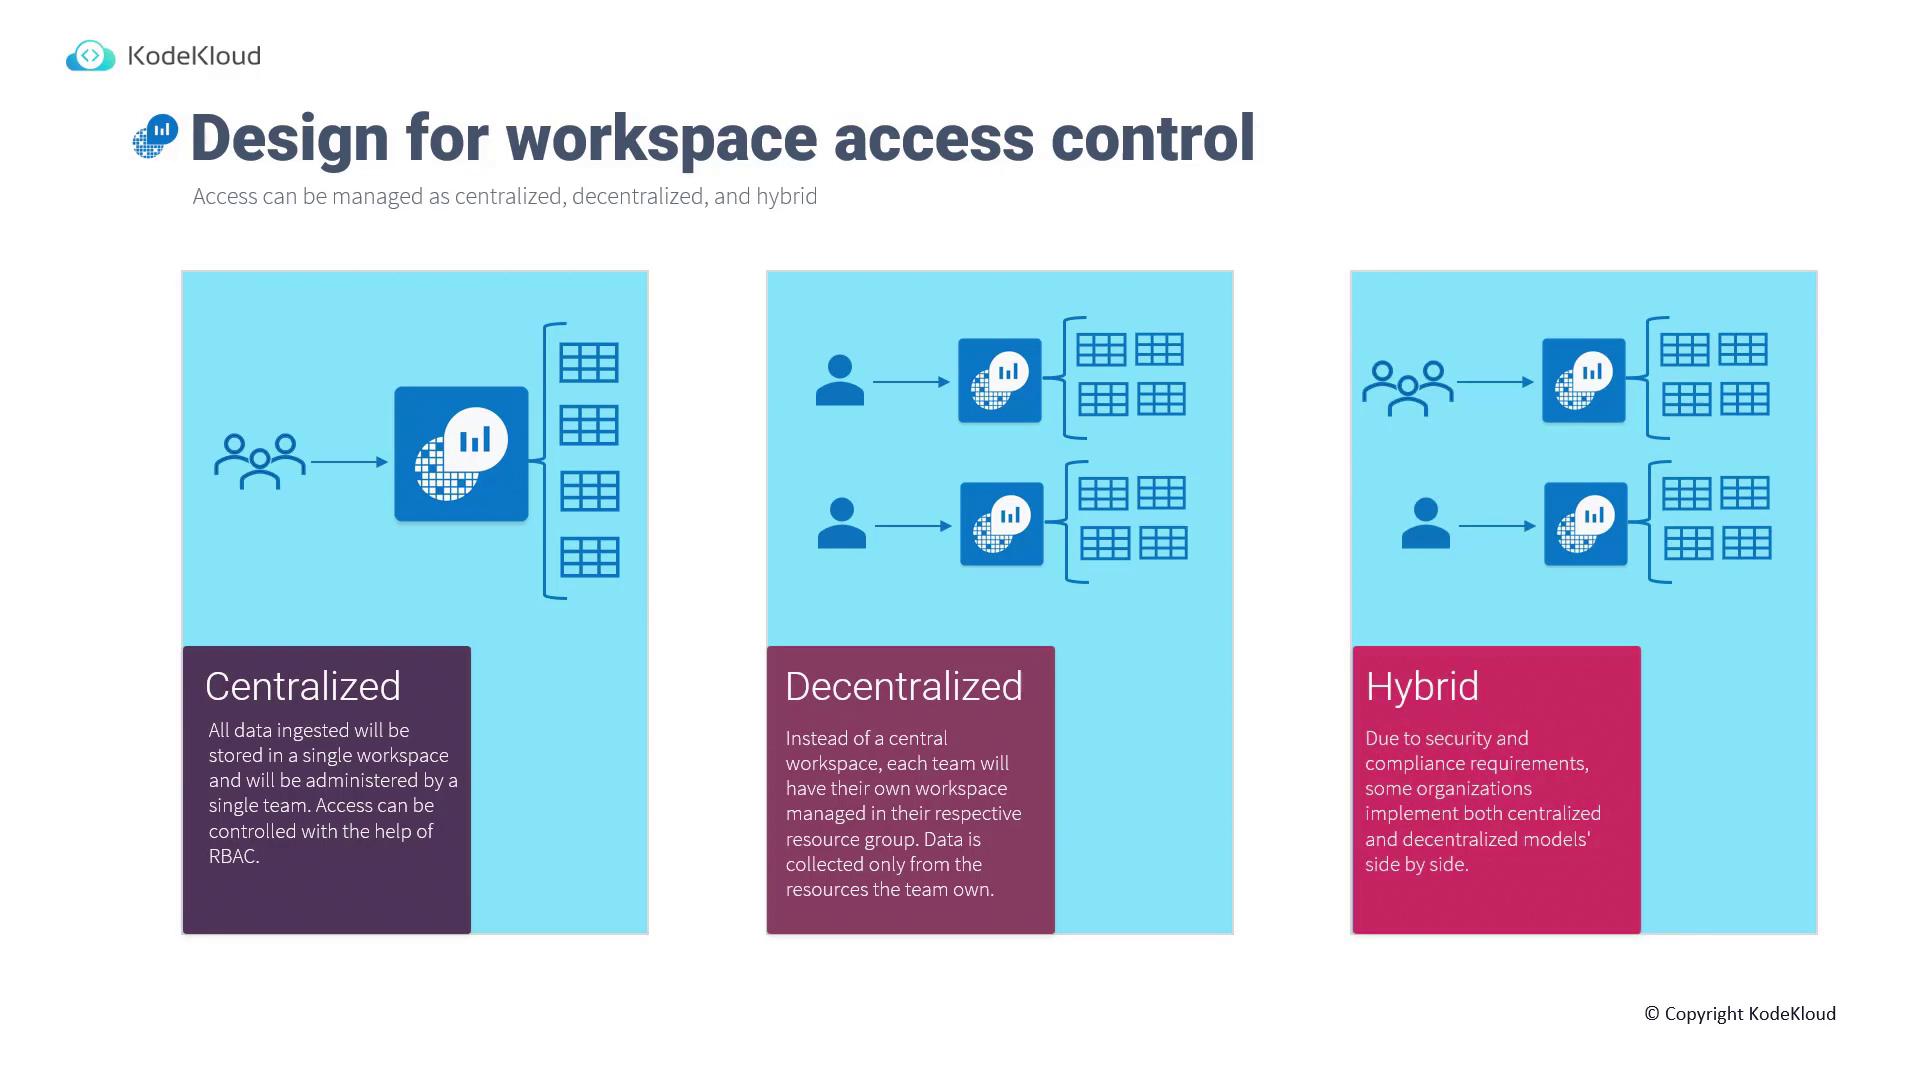
Access control for a Log Analytics workspace can be managed using one of the following models:-
Centralized:
All data from various resources is collected into a single workspace. This central repository is managed by a dedicated team with access to all data, ensuring streamlined administration. -
Decentralized:
Individual teams manage their own workspaces within their respective resource groups, gathering data solely from resources under their control. Although billing is based on overall ingestion volume and retention requirements, each team is responsible for managing their own data. -
Hybrid:
For organizations with stringent security and compliance requirements, a hybrid model is ideal. In this configuration, all resource logs are forwarded to a centralized workspace, while critical or sensitive workloads also have their logs ingested into separate, dedicated workspaces.
Detailed Access Control Models
-
Centralized Model:
With workspace-level access, you can run queries across all tables within the workspace. This model is ideal for central administration of data. -
Decentralized Model:
Query scopes are limited to specific resources for which you have read access. This approach suits application teams managing their own resources.
Onboarding Resources to Log Analytics
Onboarding resources to a Log Analytics workspace is well-documented in our AZ-104: Microsoft Azure Administrator course. For a practical demo environment that allows you to test Log Analytics and practice KQL, visit aka.ms/LA-demo. The diagram below, courtesy of KodeKloud, compares the centralized and decentralized models, detailing access, permissions, and scope: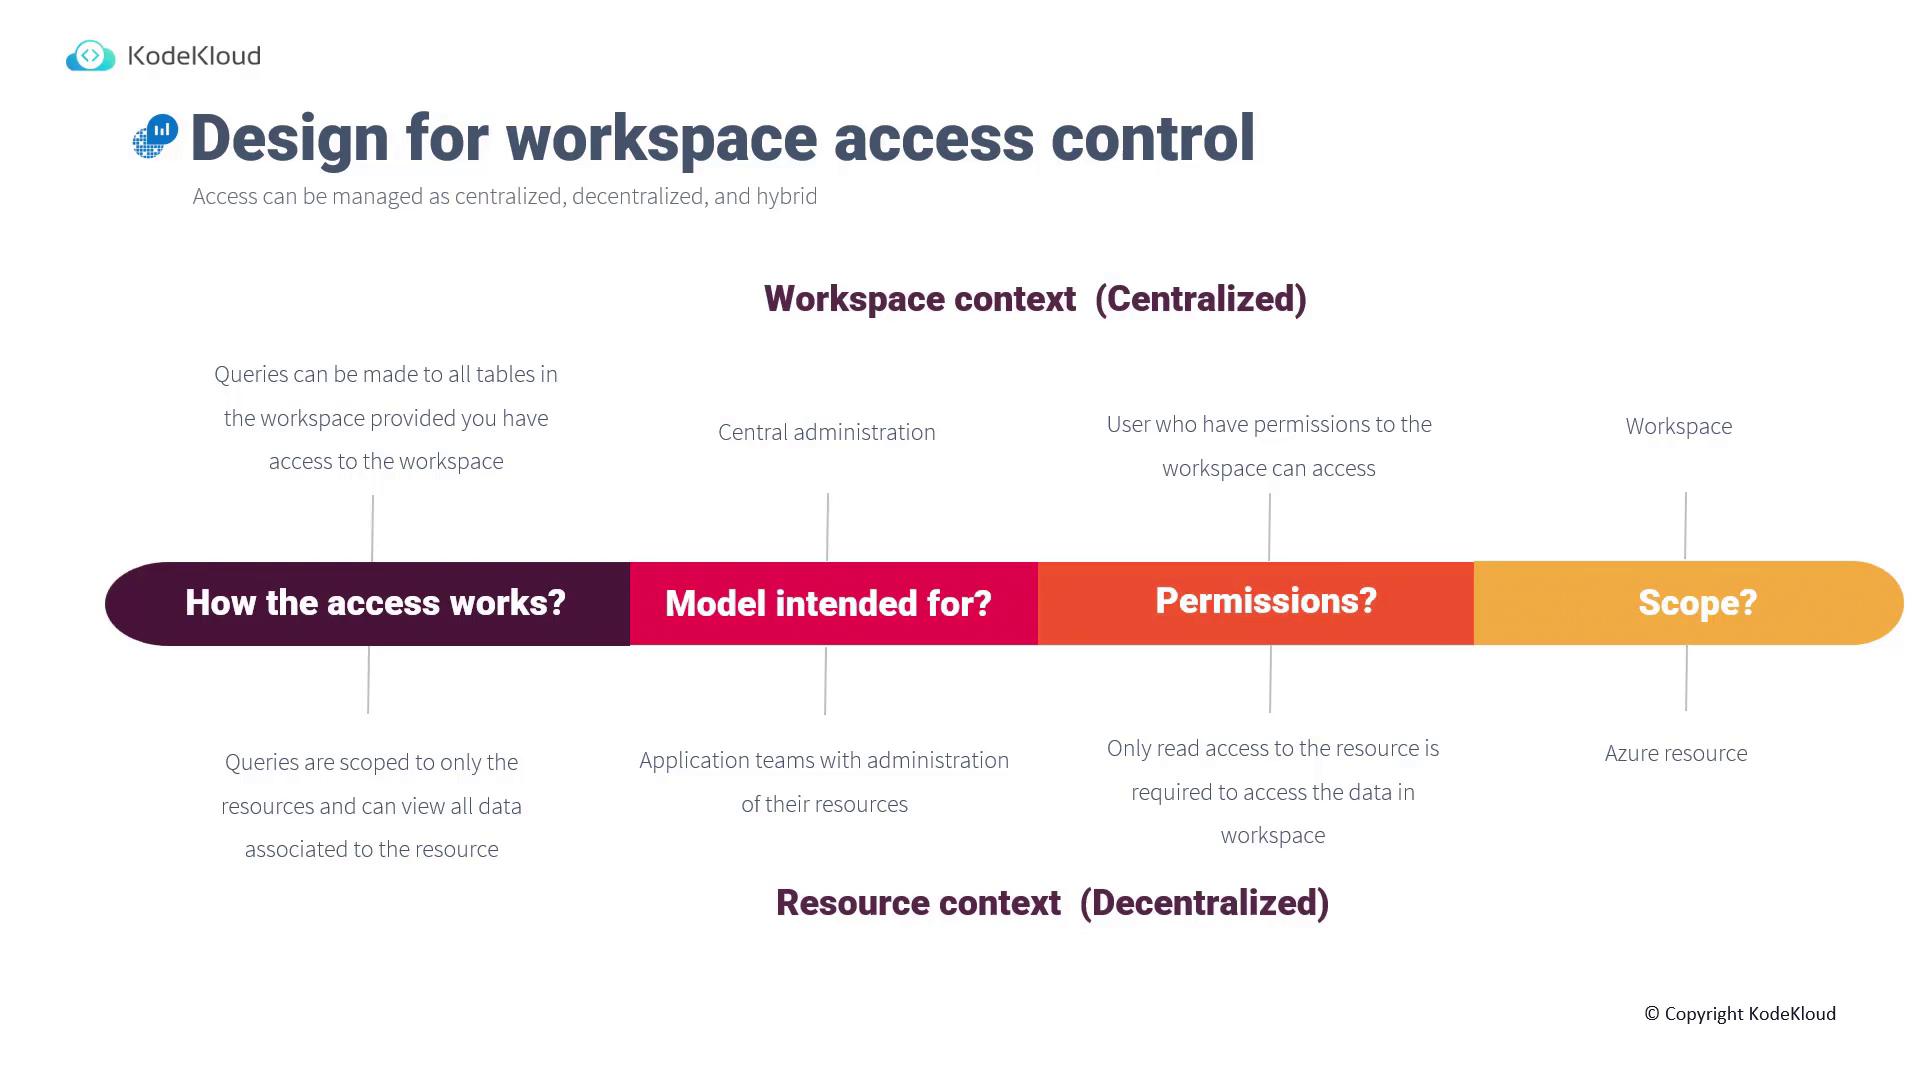
Configuring Log Analytics Workspaces in the Azure Portal
Log Analytics workspaces can be easily managed and configured directly from the Azure portal. Upon opening your workspace, you’ll notice an “access mode” setting that allows you to choose between resource-level permissions or workspace-level permissions. The screenshot below shows the Azure portal interface for a Log Analytics workspace, displaying key details such as the workspace name, ID, status, location, and subscription information. The left-hand sidebar provides access to various settings and options: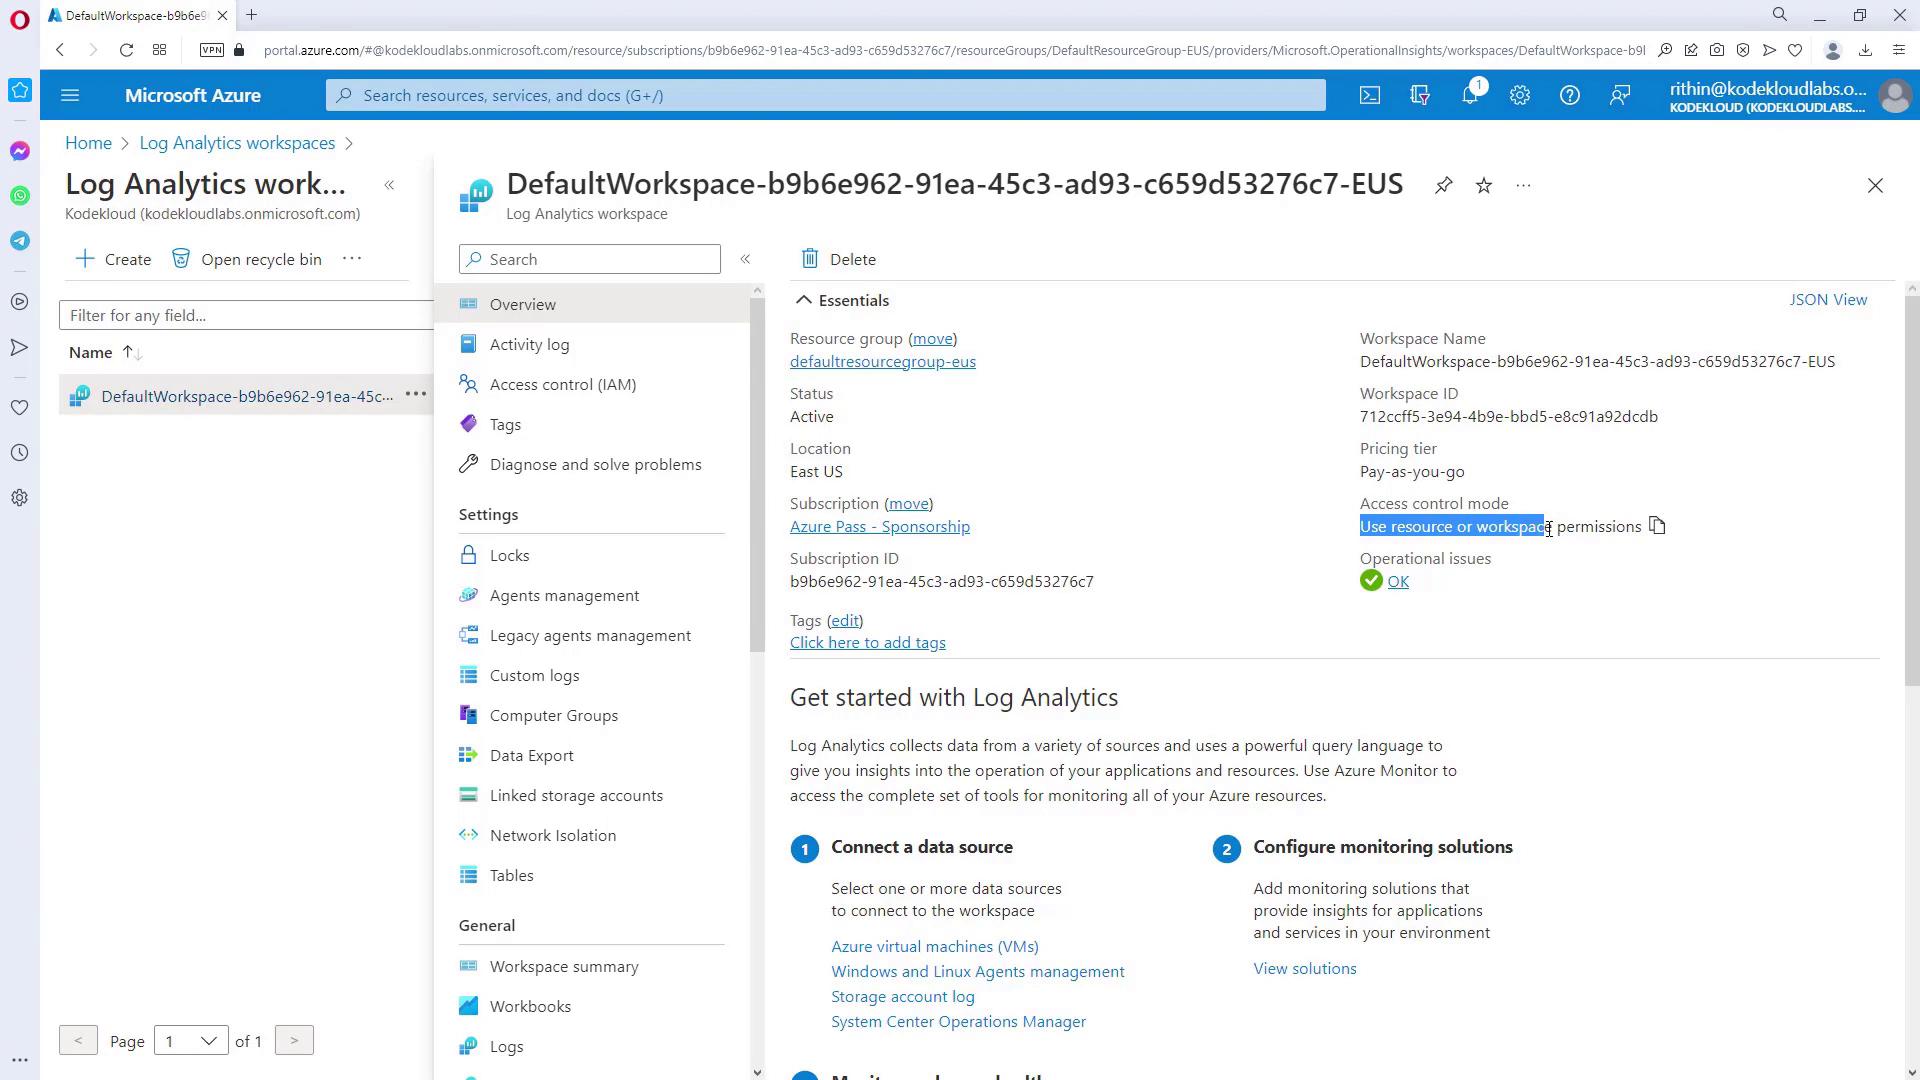
- Selecting “workspace permissions only” means that access to the workspace alone is sufficient for viewing data.
- Opting for “resource or workspace permissions” requires permission for both the specific resource and the workspace.