AZ-305: Microsoft Azure Solutions Architect Expert

Design a logging and monitoring solution

Design for Azure workbooks and Insights

This lesson explains how to design effective Azure Workbooks and use Azure Insights to monitor and visualize your resources. Azure Workbooks is a flexible service that lets you create rich, interactive visual reports incorporating text, parameters, links, queries, metrics, and more. These reports can be shared across teams to enhance collaboration and provide deeper insights into your resource performance.

The image is a presentation slide titled "Design for Azure Workbooks" by KodeKloud, explaining features like data visualization, multiple sources, and metrics and queries, alongside a screenshot of the Azure Workbooks interface.

Workbooks allow you to combine both metrics and queries from diverse sources. You can easily integrate resource metric data and leverage various query languages and tools such as Log Analytics queries, Azure Resource Graph, Resource Manager, REST API queries, and Data Explorer. Sharing your workbook is simple—just click the share button at the top of the interface to distribute your report.

The image is a presentation slide about designing for Azure Workbooks, highlighting features like data visualization, multiple sources, metrics and queries, and sharing. It includes a screenshot of the Azure Workbooks interface and a list of features on the left.


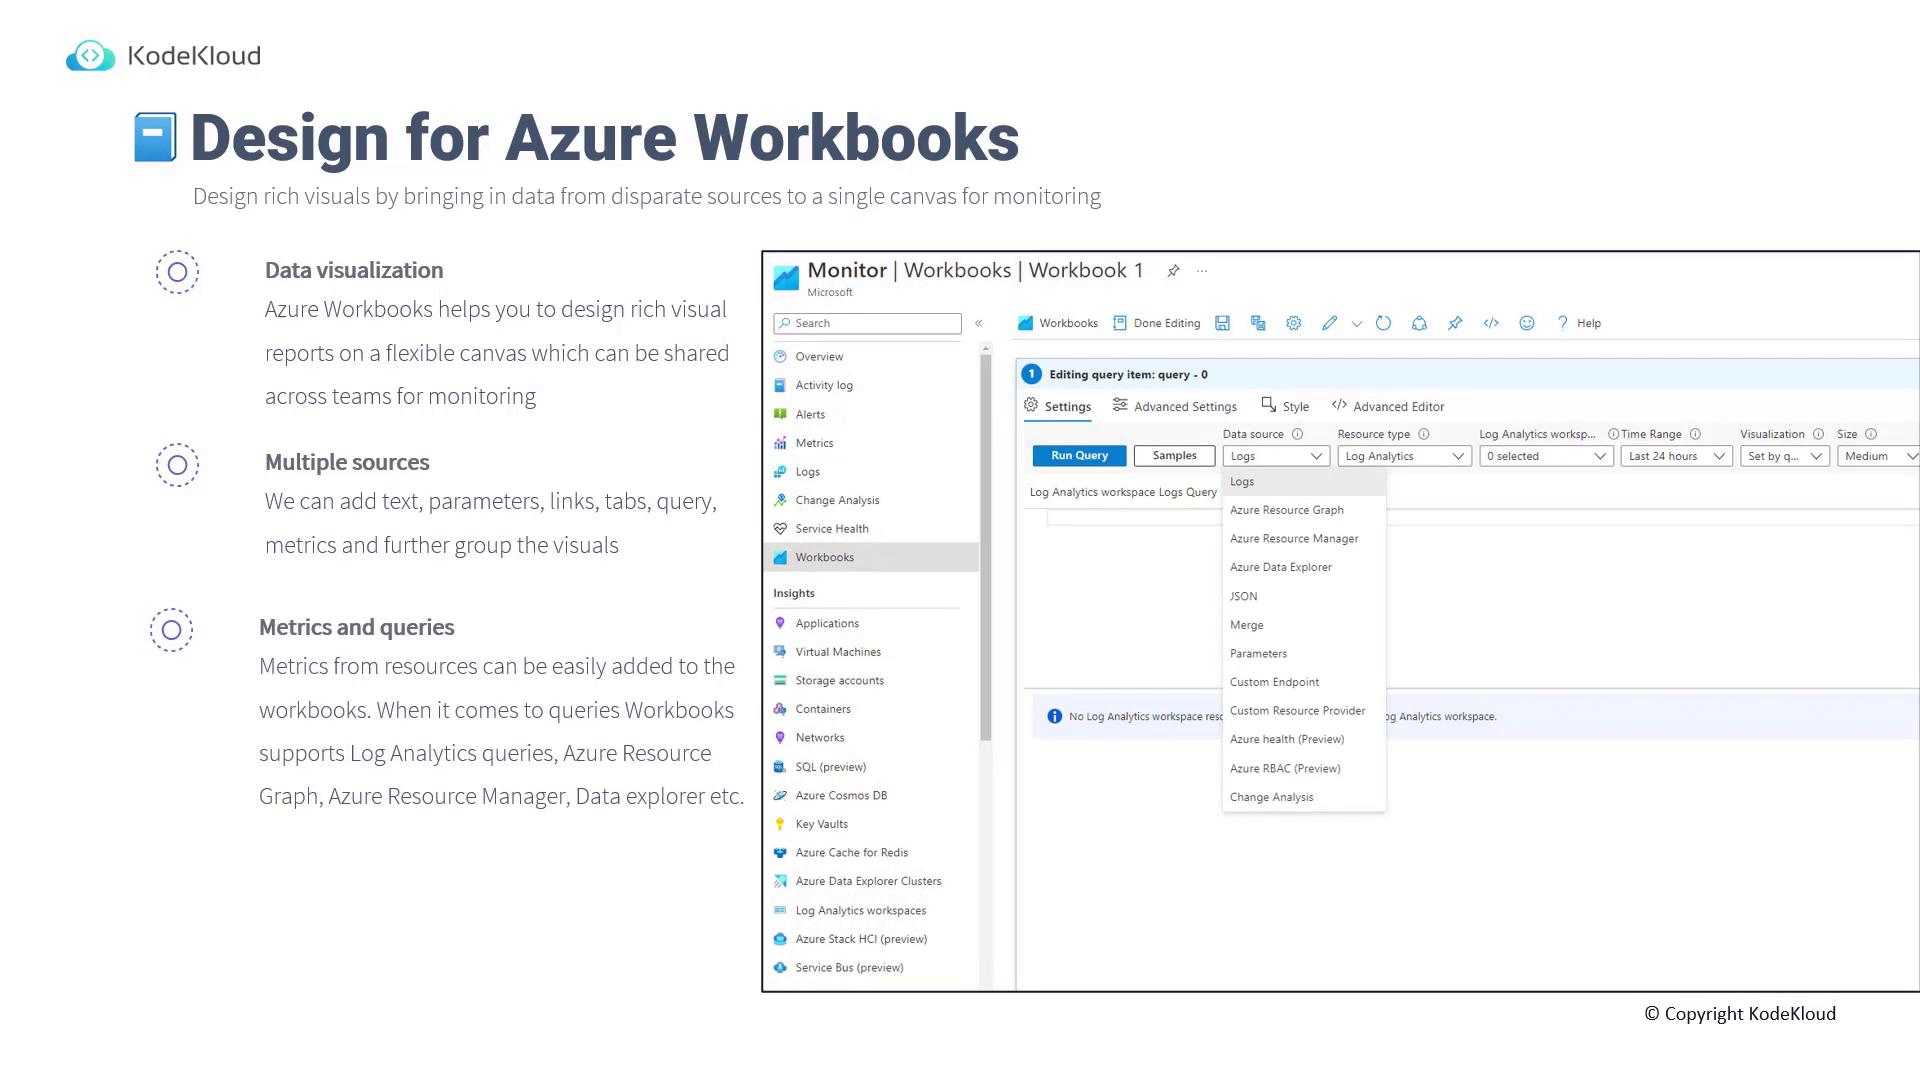
Creating a VM Performance Workbook in the Azure Portal

In this section, you will learn to build a simple workbook that monitors virtual machine (VM) performance. Follow these steps to create a dynamic dashboard showing performance metrics like CPU usage, network statistics, and disk performance.

Step 1: Adding a Markdown Heading

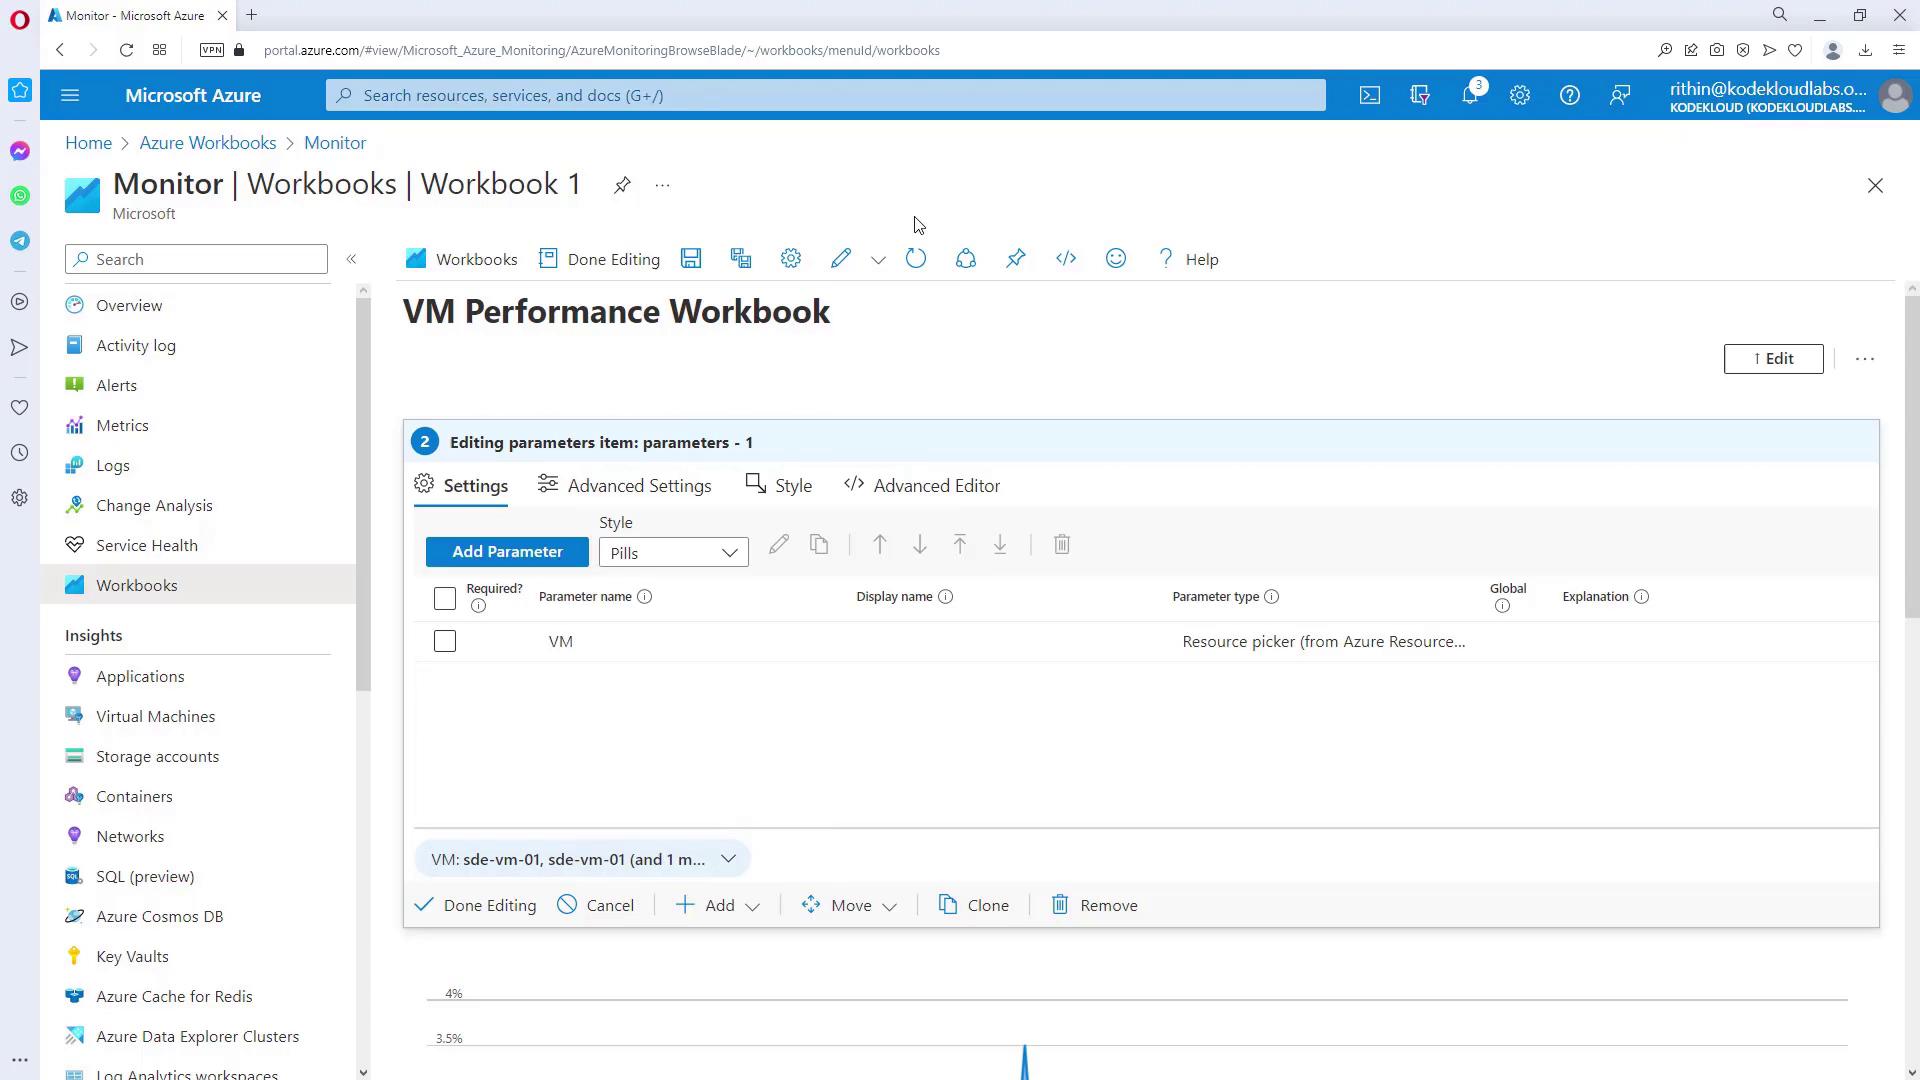
Begin by adding a Markdown text block to label your workbook. This heading identifies the purpose of your report:

# VM Performance

After clicking "Done Editing," the heading will be displayed on the canvas.

Step 2: Adding a Parameter for VM Selection

Next, add a parameter to create a drop-down menu for VM selection. This parameter can be set up using options such as drop-down, time range, resource picker, resource type picker, or location picker.

The image shows a Microsoft Azure Monitor interface with a "New Parameter" window open, allowing users to configure settings for a VM Performance Workbook.

You can choose between a subscription picker or a resource picker. For our example, we’ll use the resource picker with a Resource Graph query to list all available Virtual Machines.

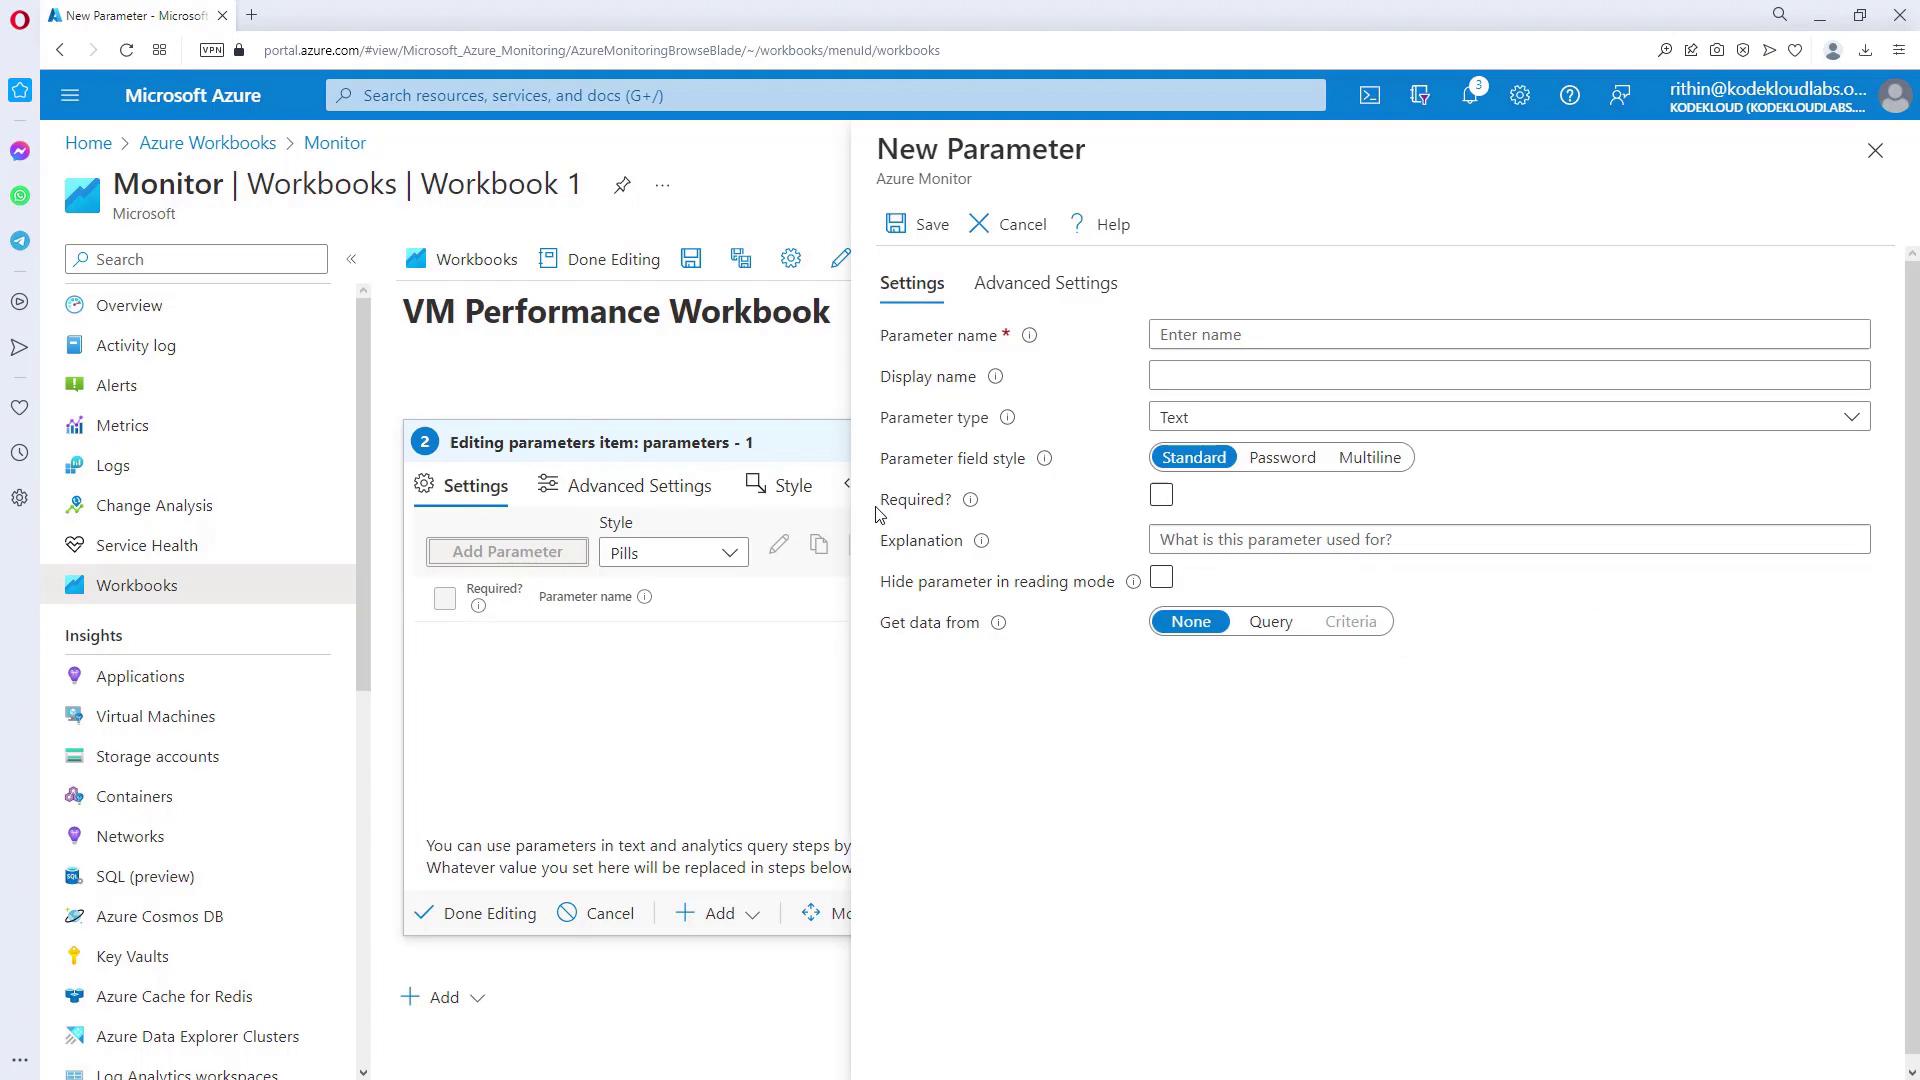
Step 3: Setting Up the Resource Graph Query

Utilize the Kusto Query Language (KQL) to list all Virtual Machines with a concise query. Instead of using multiple repetitive queries, implement the refined query below:

resources
| where type == 'microsoft.compute/virtualmachines'

Running this query with all subscriptions selected will populate the drop-down with all Virtual Machines. Click "Save" and then "Done Editing" to apply the configuration.

Step 4: Adding Performance Metrics

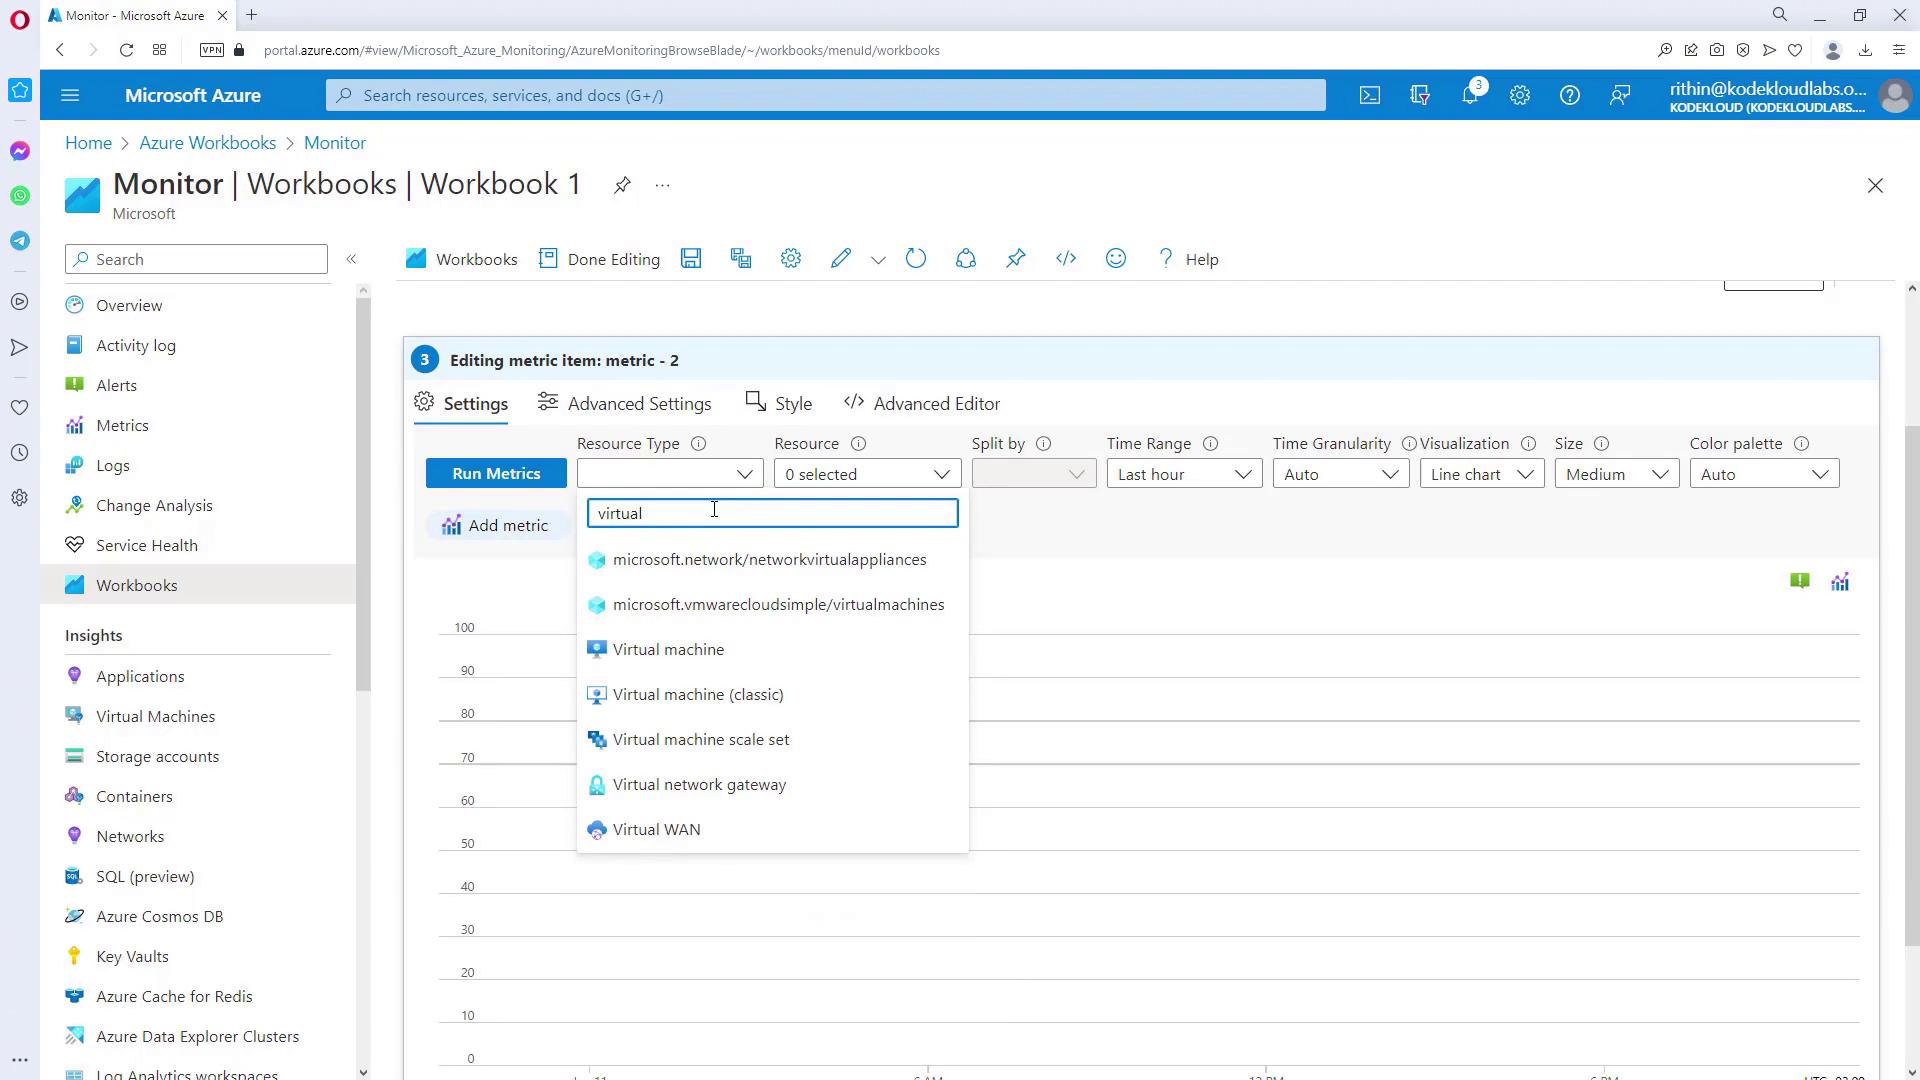
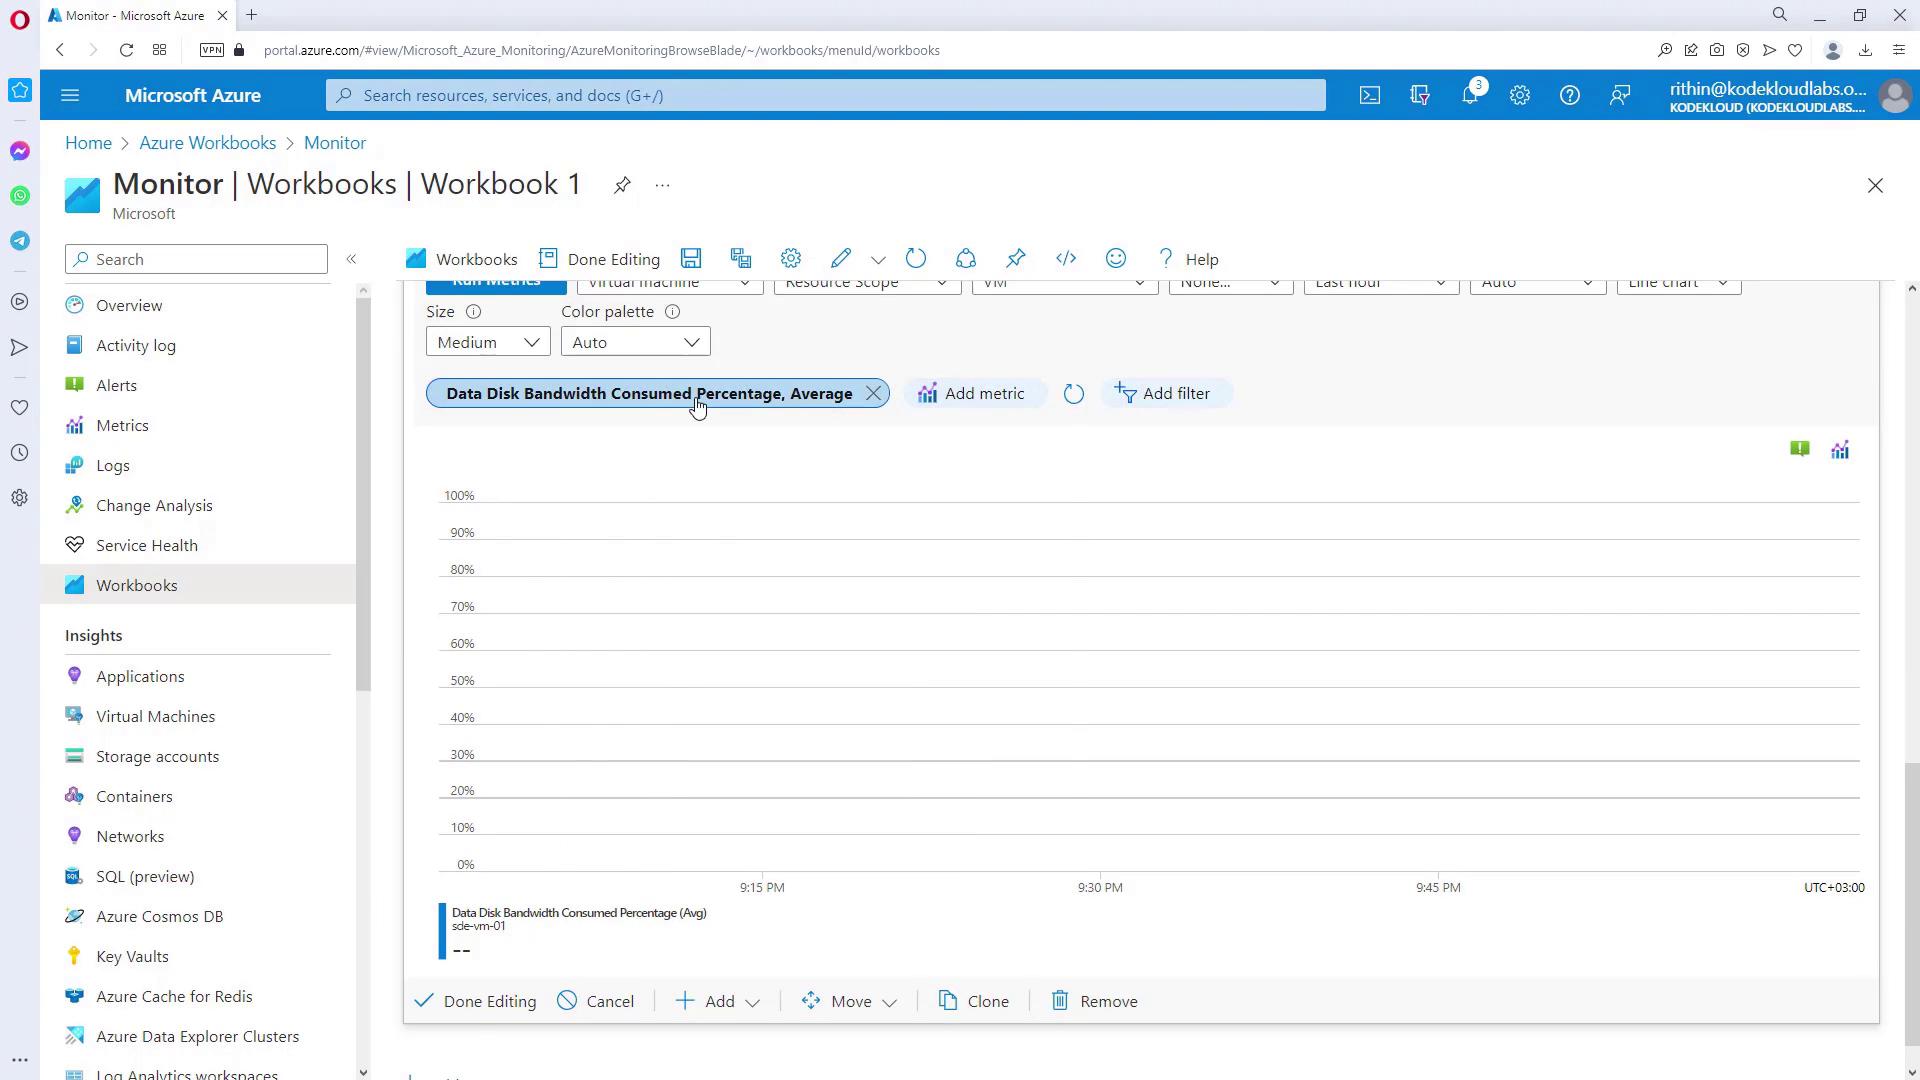
Now, add performance metrics to visualize the data for the selected VMs. Follow these steps:

  1. Click "Add Metric" and configure the resource type to Virtual Machine, linking it to the previously defined parameter for dynamic selection.
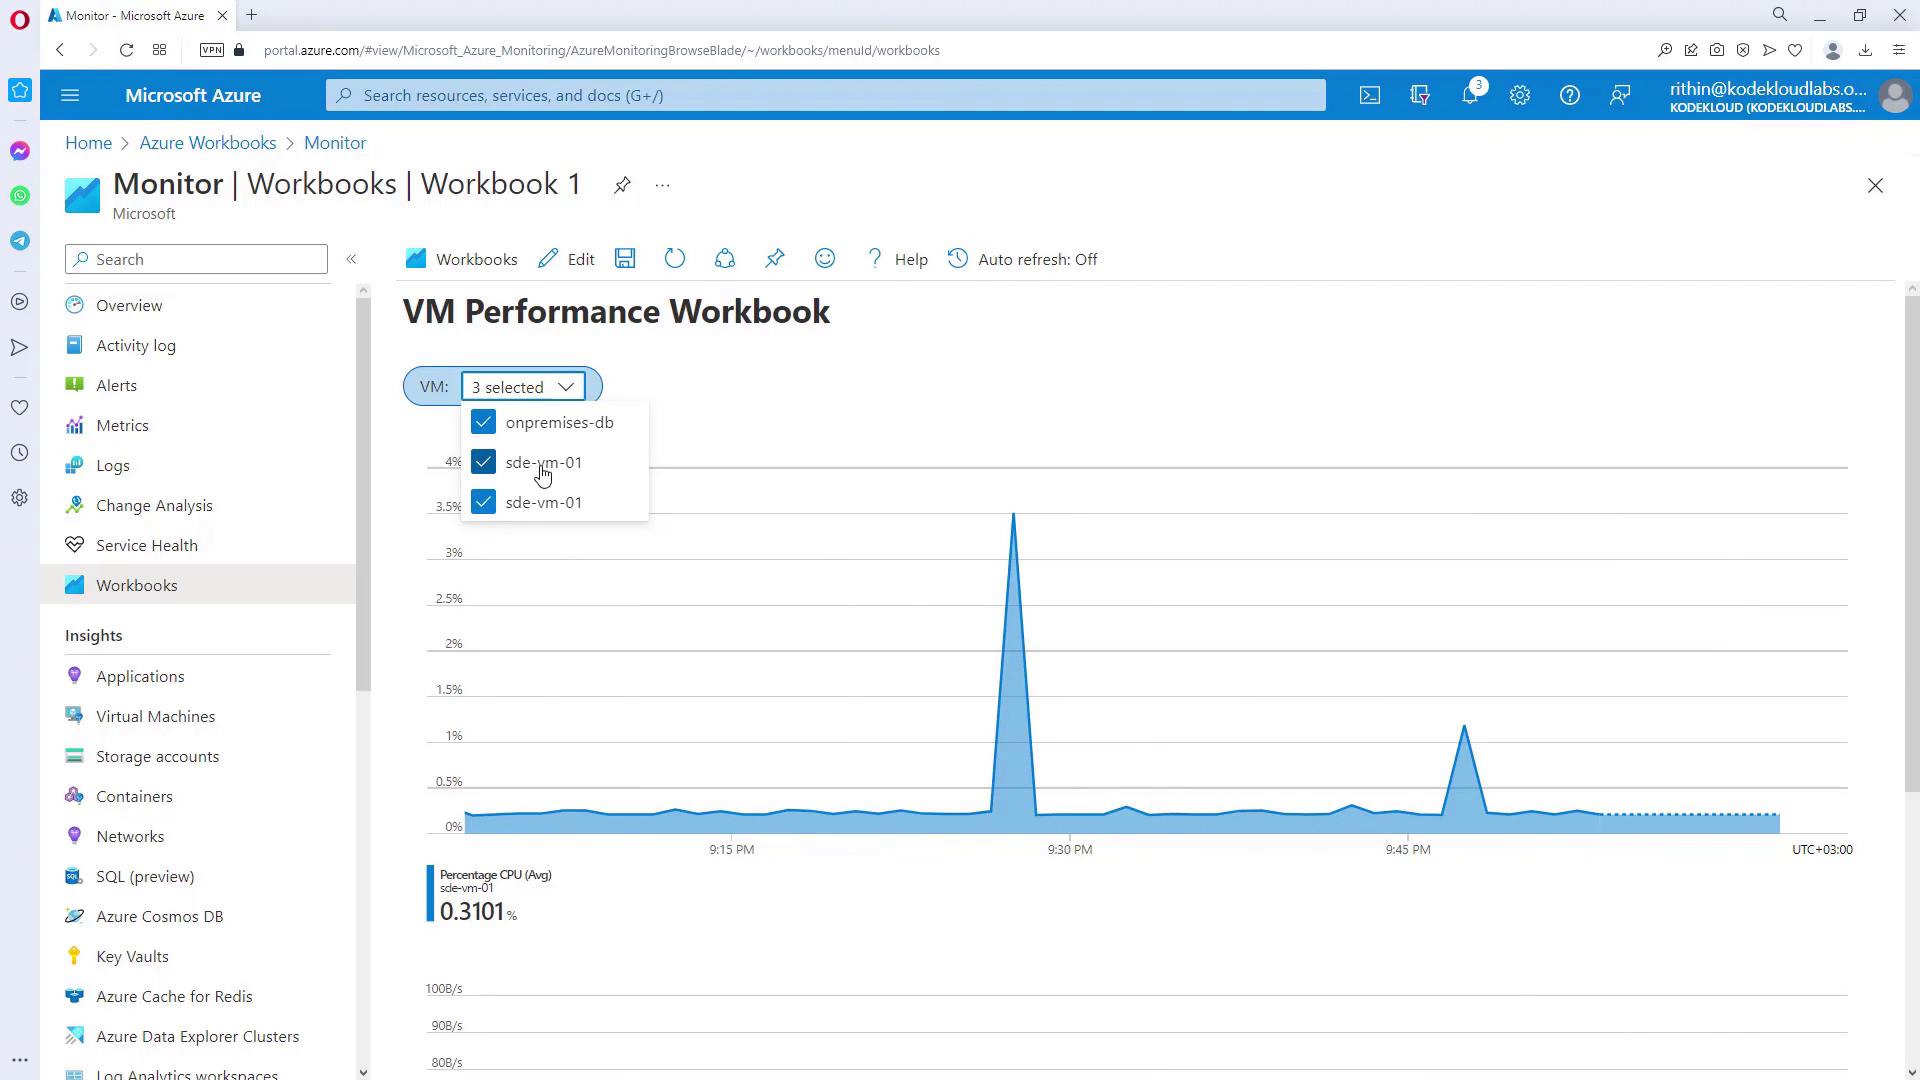
  2. Choose the metric you want to display (e.g., CPU percentage) and set the aggregation method (such as Average).
  3. Click "Run Metrics" to generate the visualization. You can adjust the visualization type (bar chart, area chart, etc.) and the graph size as needed.

The image shows a Microsoft Azure Monitor Workbook interface, where a user is editing a metric item and selecting a resource type related to virtual machines. The interface includes options for settings, visualization, and time range.

For additional insights, try adding another metric related to the disk performance. If a selected metric does not show data, switch to another metric with available values.

The image shows a Microsoft Azure Monitor workbook interface displaying a line chart for "Data Disk Bandwidth Consumed Percentage, Average" over time. The left panel includes navigation options like Overview, Activity log, Alerts, and more.

Once satisfied with your metrics, click "Done Editing" to finalize your workbook. You can also modify parameter settings to enable multi-selection if required.

The image shows a Microsoft Azure portal interface displaying a "VM Performance Workbook" with options to edit parameters and settings. The left sidebar includes navigation options like Overview, Activity log, Alerts, and Workbooks.

The image shows a Microsoft Azure Monitor dashboard displaying a VM Performance Workbook with a graph of CPU usage over time for selected virtual machines. The sidebar includes options like Overview, Activity log, Alerts, and more.

Tip

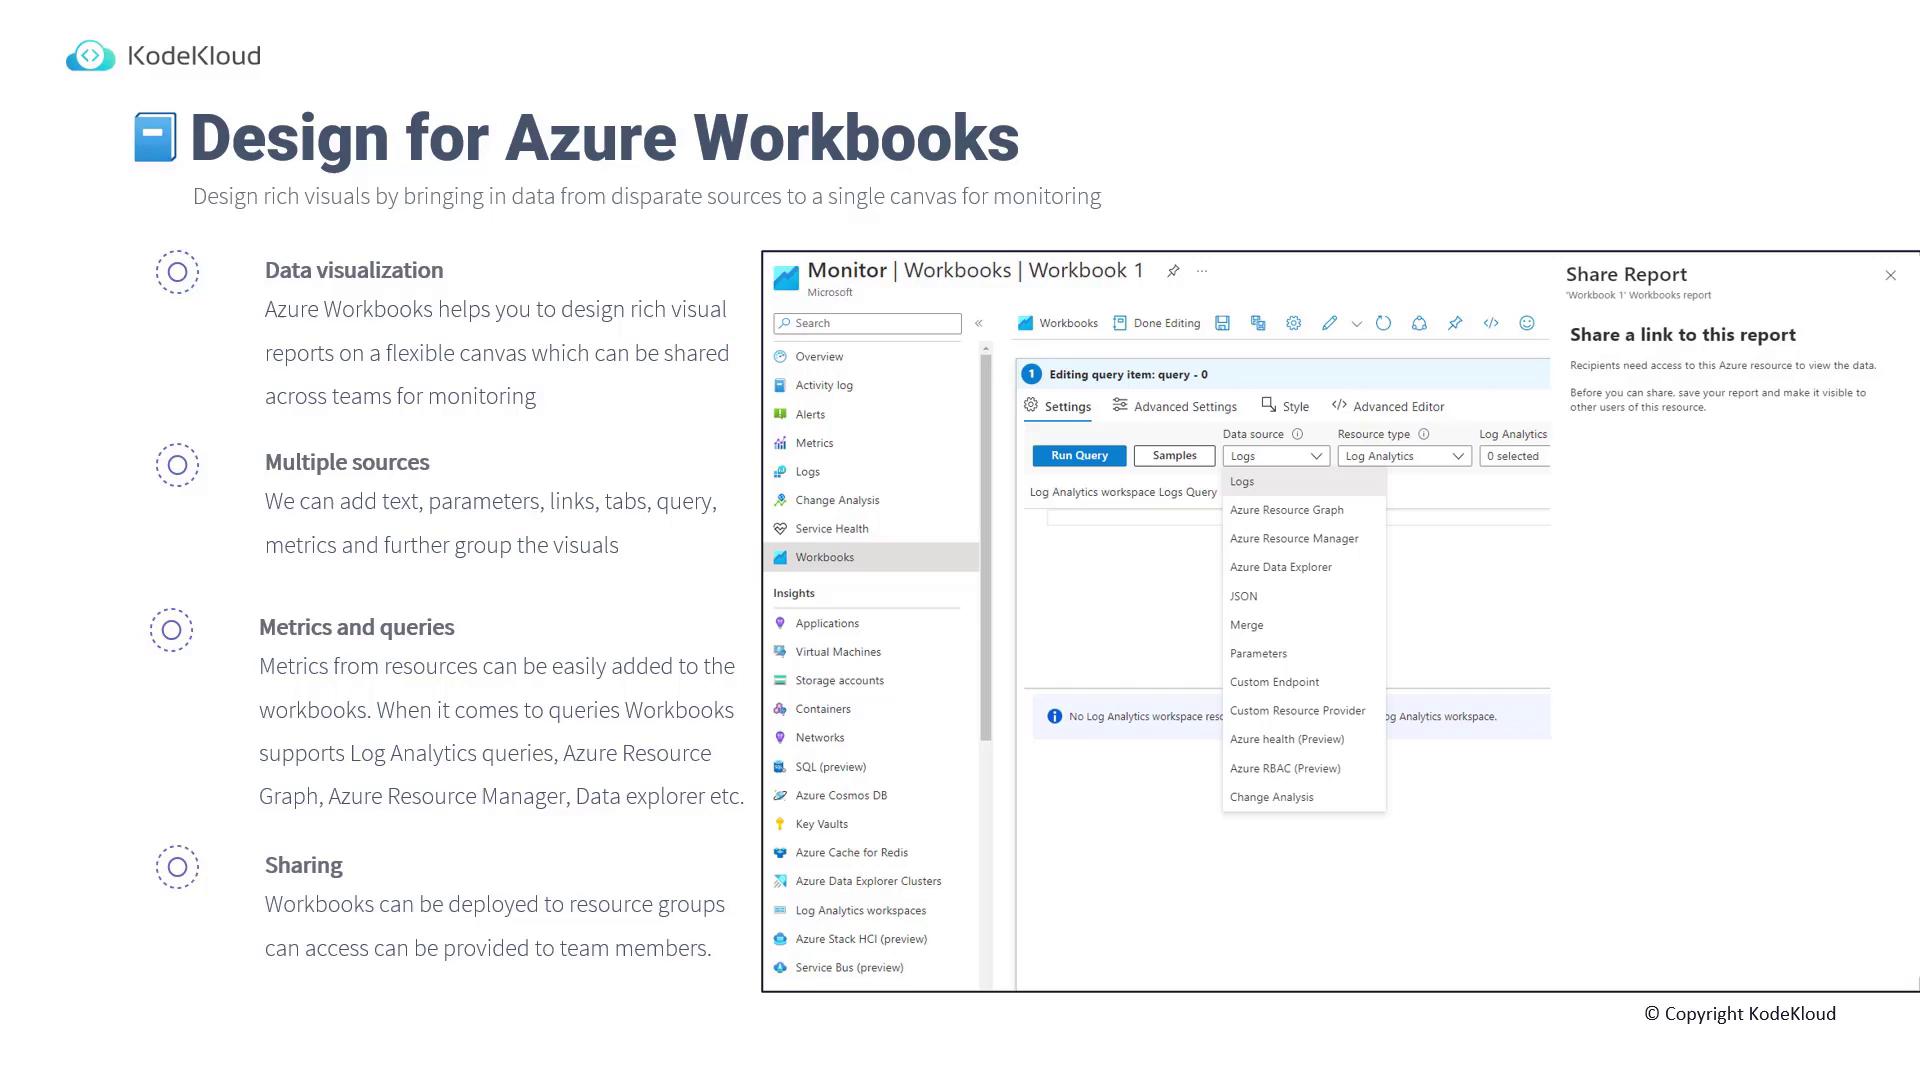
Remember to save and share your workbook when you’re done to enable team-wide collaboration.


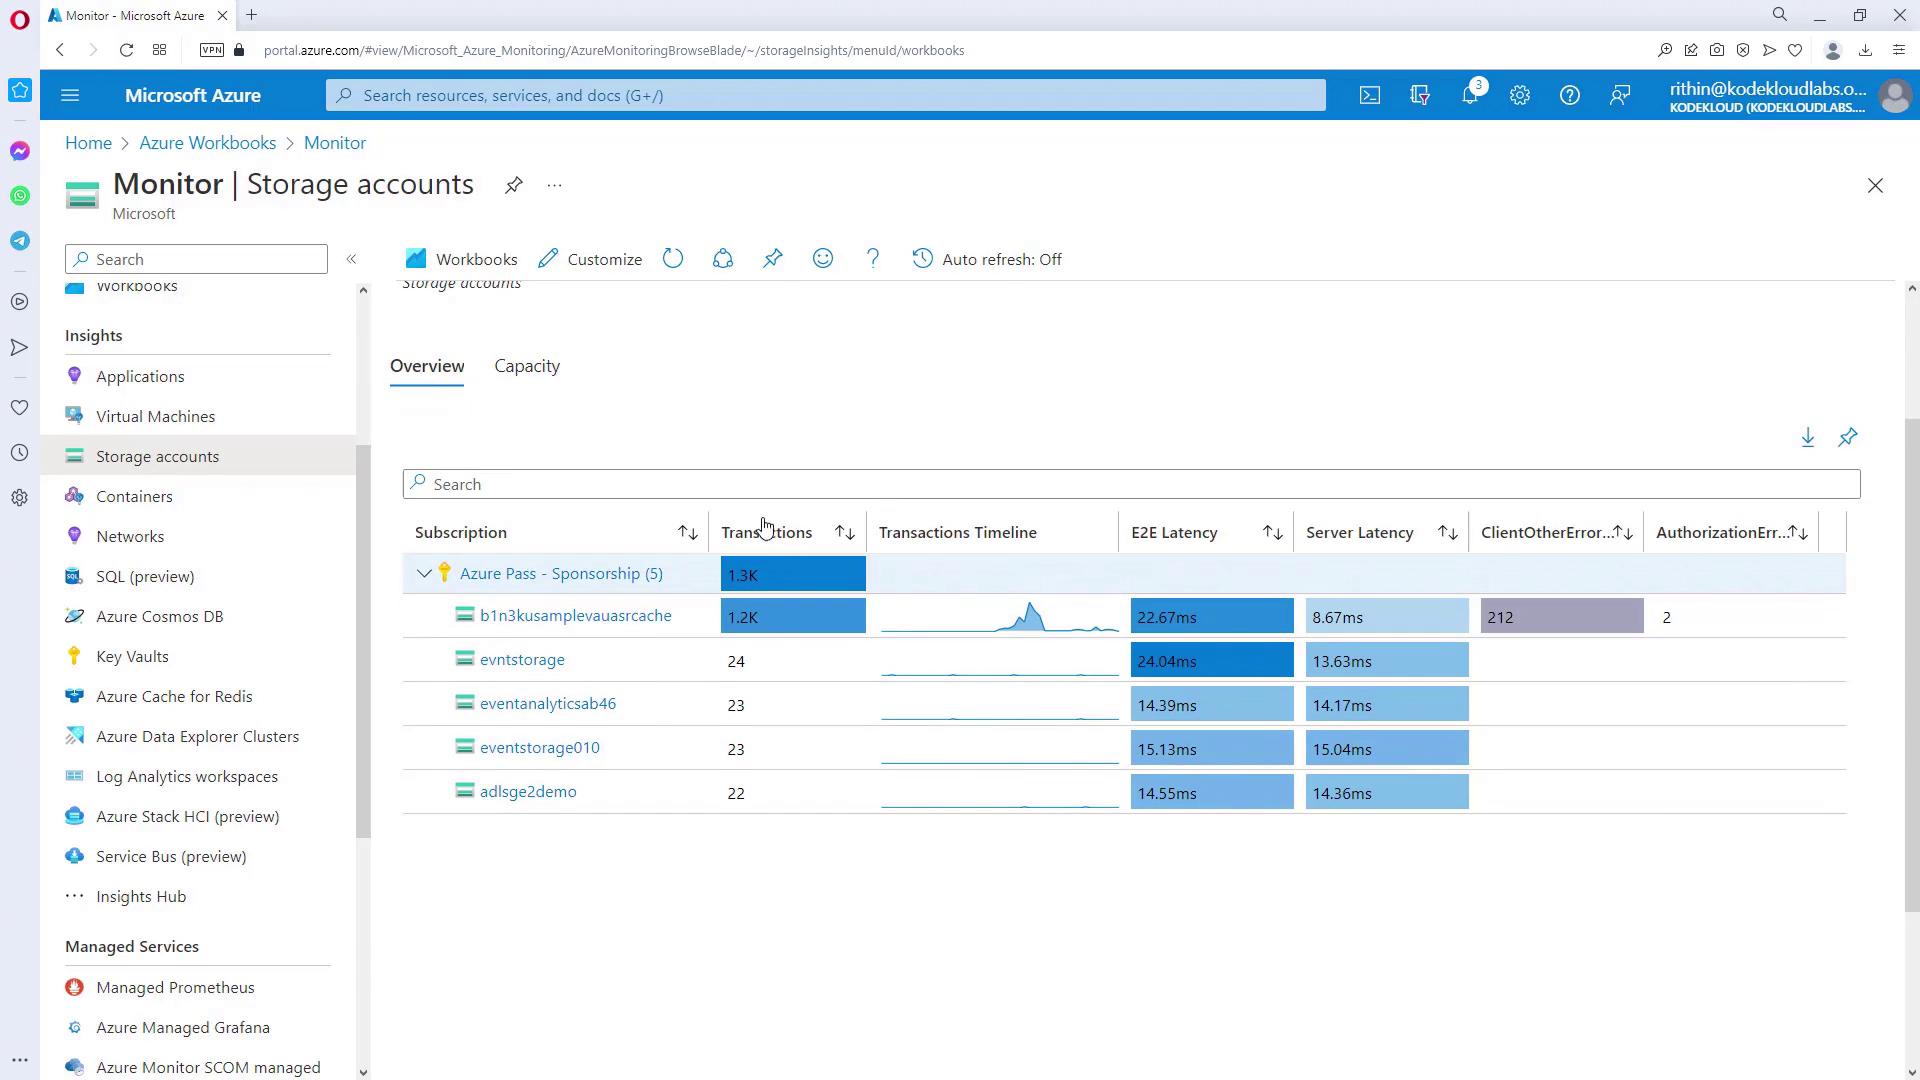
Designing for Azure Insights

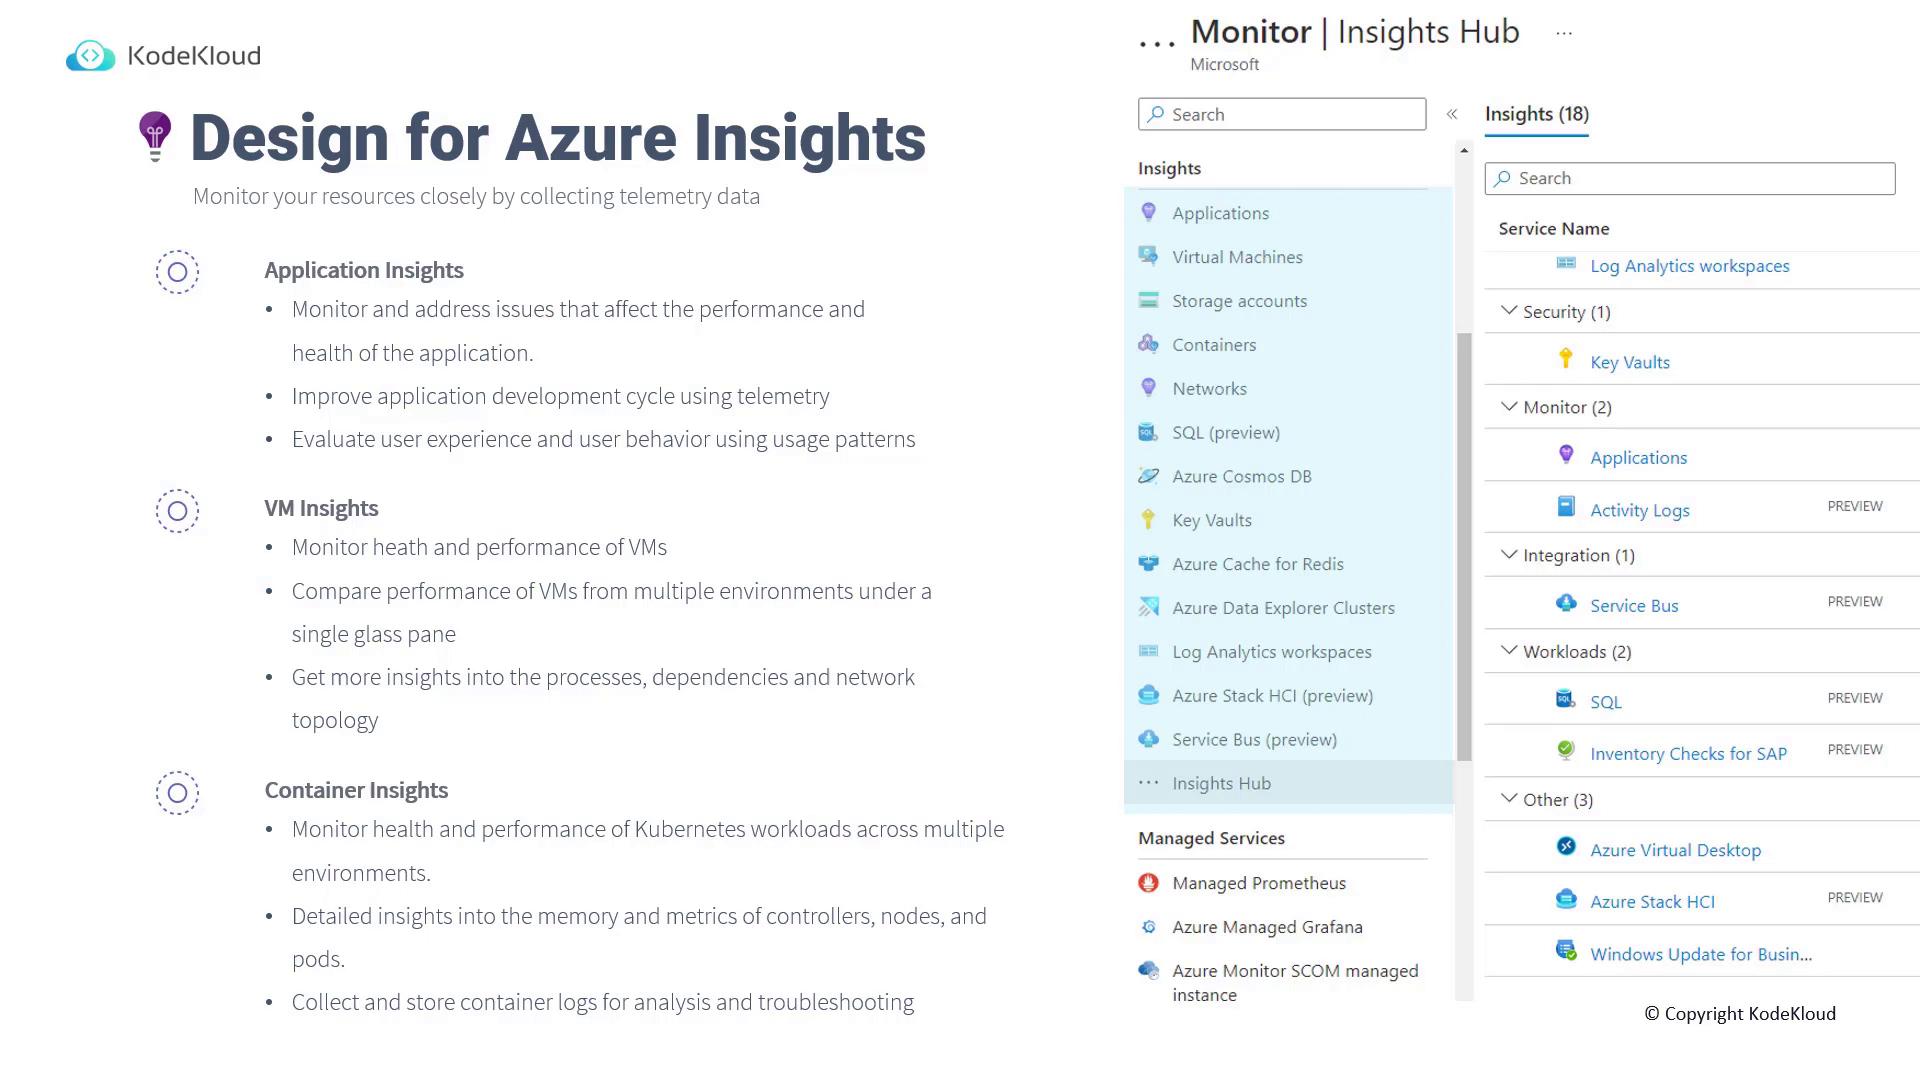
Azure Insights extends your monitoring capabilities by providing telemetry data for a broad range of services. In the Azure Monitor, Insights are available for services such as applications, virtual machines, storage accounts, containers, networks, and SQL databases. For exam purposes, focus on the following three core services:

  • Application Insights
  • VM Insights
  • Container Insights

Application Insights

Application Insights is designed to help you monitor and troubleshoot your application's performance and health. It enables you to track:

  • Query and request volumes along with their sources.
  • Metrics like availability, performance, latency, and dependency health.
  • User behavior and engagement patterns to identify areas for improvement.
  • Overall application stack performance through in-depth telemetry data.

VM Insights

VM Insights offers a detailed overview of the health and performance of your virtual machines. With VM Insights, you can:

  • Compare the performance of multiple VMs across different environments.
  • Access information on VM properties, running processes, dependencies, and network topology.

Container Insights

Tailored for Kubernetes workloads, Container Insights monitors containerized environments by providing:

  • Detailed performance and memory usage metrics for controllers, nodes, and pods.
  • Centralized log collection to facilitate troubleshooting and analysis.

The image is a presentation slide from KodeKloud about "Design for Azure Insights," detailing how to monitor resources using telemetry data, with sections on Application, VM, and Container Insights. It also includes a screenshot of the Azure Monitor Insights Hub, listing various services and features.

To access these insights, navigate to the Monitor section in the Azure portal. For Virtual Machines, ensure they are onboarded to send telemetry data to the configured workspace. For storage accounts, you can monitor metrics such as transactions, latency, errors, and capacity.

The image shows a Microsoft Azure portal interface displaying a monitoring dashboard for storage accounts, with metrics such as transactions, latency, and errors. The dashboard includes a list of subscriptions and their corresponding performance data.

Azure Insights provides a rich, holistic view of your resource performance through detailed telemetry.


With these guidelines and steps, you now understand how to design robust Azure Workbooks and implement Azure Insights for monitoring resource performance and gathering actionable telemetry data. This approach not only enhances visibility into your environment but also empowers your team to make informed decisions based on real-time metrics and trends.

Next, we will move on to the final topic: Design for Azure Data Explorer.

Watch Video

Watch video content

Previous
Design for Log Analytics