The Kubernetes Dashboard provides a web-based UI for monitoring and managing Kubernetes clusters while emphasizing the importance of security measures.
The Kubernetes Dashboard is a powerful web-based UI designed to give you a visual overview of your Kubernetes cluster. It enables you to monitor cluster activities, manage resources, and deploy new applications directly from the dashboard interface. However, with its ability to display sensitive information, including secrets, it is essential to implement proper security measures to protect access and prevent unauthorized usage.
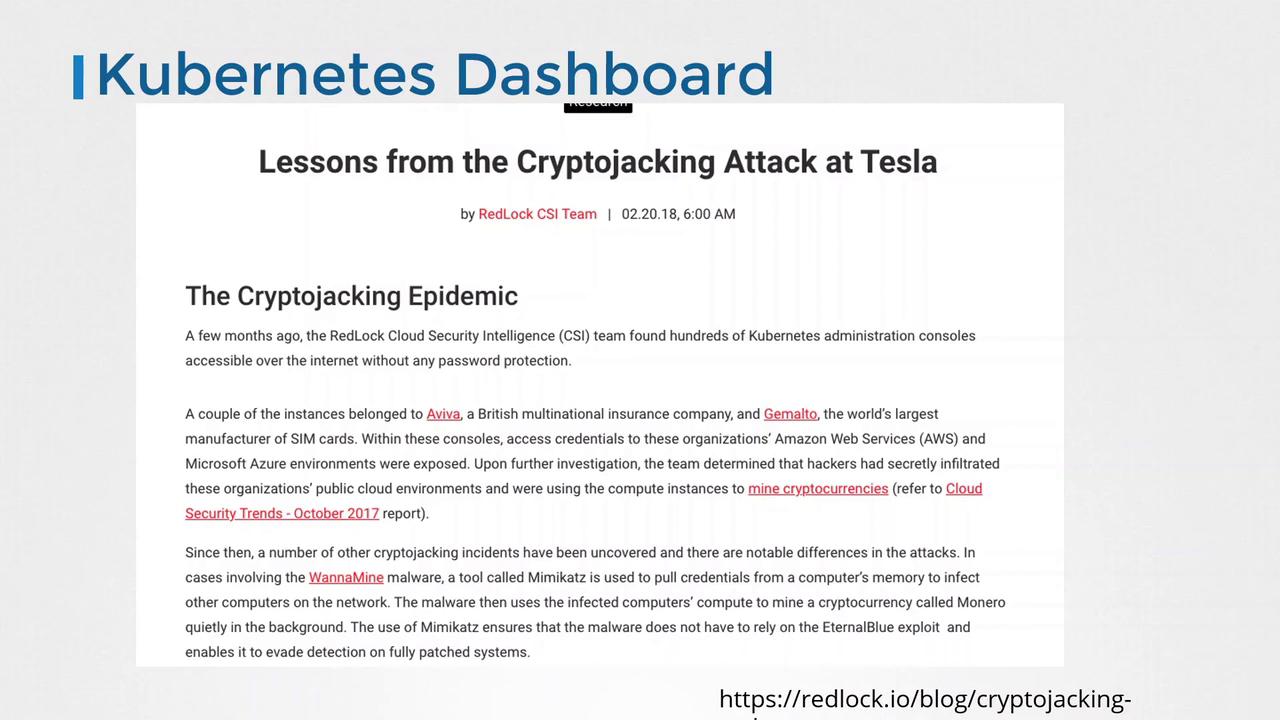
Older versions of the Kubernetes Dashboard did not enforce strict access control. This vulnerability led to high-profile security incidents, such as the one reported by the RedLock cloud security team at Tesla, where an unsecured dashboard was exploited to mine cryptocurrencies.
The Kubernetes Dashboard is deployed by applying the recommended configuration available in its GitHub repository. When deployed, a dedicated namespace named kubernetes-dashboard is created, and several objects are set up, including:
Resource Type
Description
Deployment
Hosts the dashboard UI server.
Service
Exposes the dashboard internally within the cluster.
ConfigMaps
Stores various dashboard settings.
Secrets
Holds certificates and other sensitive configurations.
Below is an example configuration for a deployment using a rolling update strategy:
By default, the dashboard service is set up as a ClusterIP, restricting access to within the cluster only. You can review the service configuration with:
Copy
kubectl describe service kubernetes-dashboard -n kubernetes-dashboard
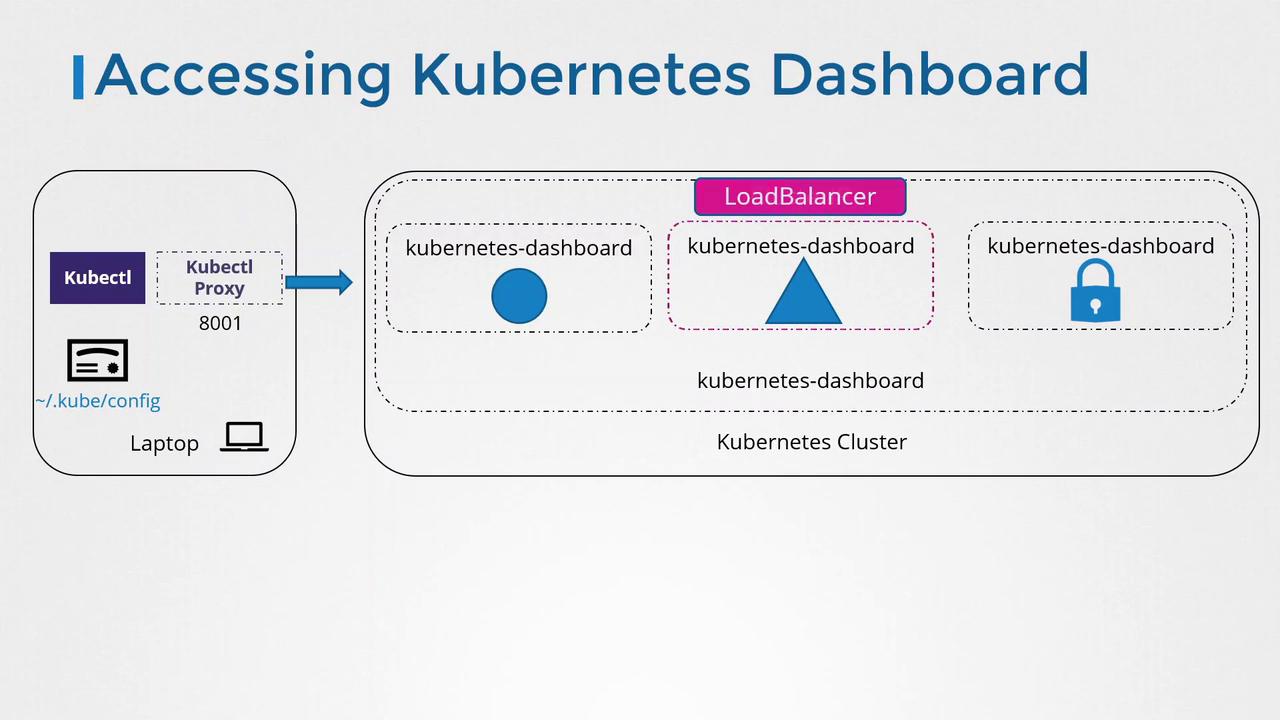
Since Kubernetes cluster nodes typically lack a graphical user interface, accessing the dashboard directly from the nodes is not possible. Instead, use the kubectl proxy command to create a secure tunnel from your local machine to the API server. Once the proxy is running, navigate to the dashboard using:
This method is ideal for individual access. For team-wide access, implement additional authentication and authorization measures to ensure only permitted users can access or modify the dashboard.
The Proxy method is recommended as the default service configuration employs ClusterIP. Altering the service to LoadBalancer or NodePort for external access is possible but comes with enhanced security risks. Always evaluate your security posture before making such changes.
Changing the service type can expose the dashboard beyond the cluster boundaries:
LoadBalancer: Suitable in a cloud environment, this exposes the dashboard externally but is not recommended due to security risks.
NodePort: Makes the dashboard accessible on specific node ports. While feasible in a secure environment, it demands stringent network security controls.
Authentication Proxies: Tools such as OAuth2 Proxy can be deployed to enforce user authentication before requests are forwarded to the dashboard. This setup, however, is more complex and beyond the scope of this article.
For further insights on securing your Kubernetes Dashboard and implementing advanced authentication mechanisms, refer to expert resources such as those provided by Kubernetes authorities like Joe Beda.
In our next article, we will explore detailed authentication mechanisms available for securing the Kubernetes Dashboard, ensuring a safer operating environment for your Kubernetes clusters.For more information, consider referring to: