Chaos Engineering
Chaos Engineering on Availability Zone
Running the Experiment
In this guide, we'll walk through executing a targeted power interruption against an Amazon RDS Aurora cluster using AWS Fault Injection Simulator (FIS). You’ll learn how to:
- Establish and verify steady state conditions
- Launch a multi-step fault injection experiment
- Observe automated failover in RDS
- Measure application resilience with CloudWatch
Prerequisites
Make sure you have the following in place before you begin:
- AWS CLI configured with sufficient permissions
- An Aurora multi-AZ cluster behind an Application Load Balancer
- AWS FIS permissions and the Easy Power Interruption experiment template
1. Establish Steady State
Before introducing any faults, generate consistent load and confirm that your application and database are stable.
- Open your browser or use a load testing tool to send continuous requests to the pet adoption site for ~10 minutes.
- Collect baseline metrics from AWS X-Ray and CloudWatch.
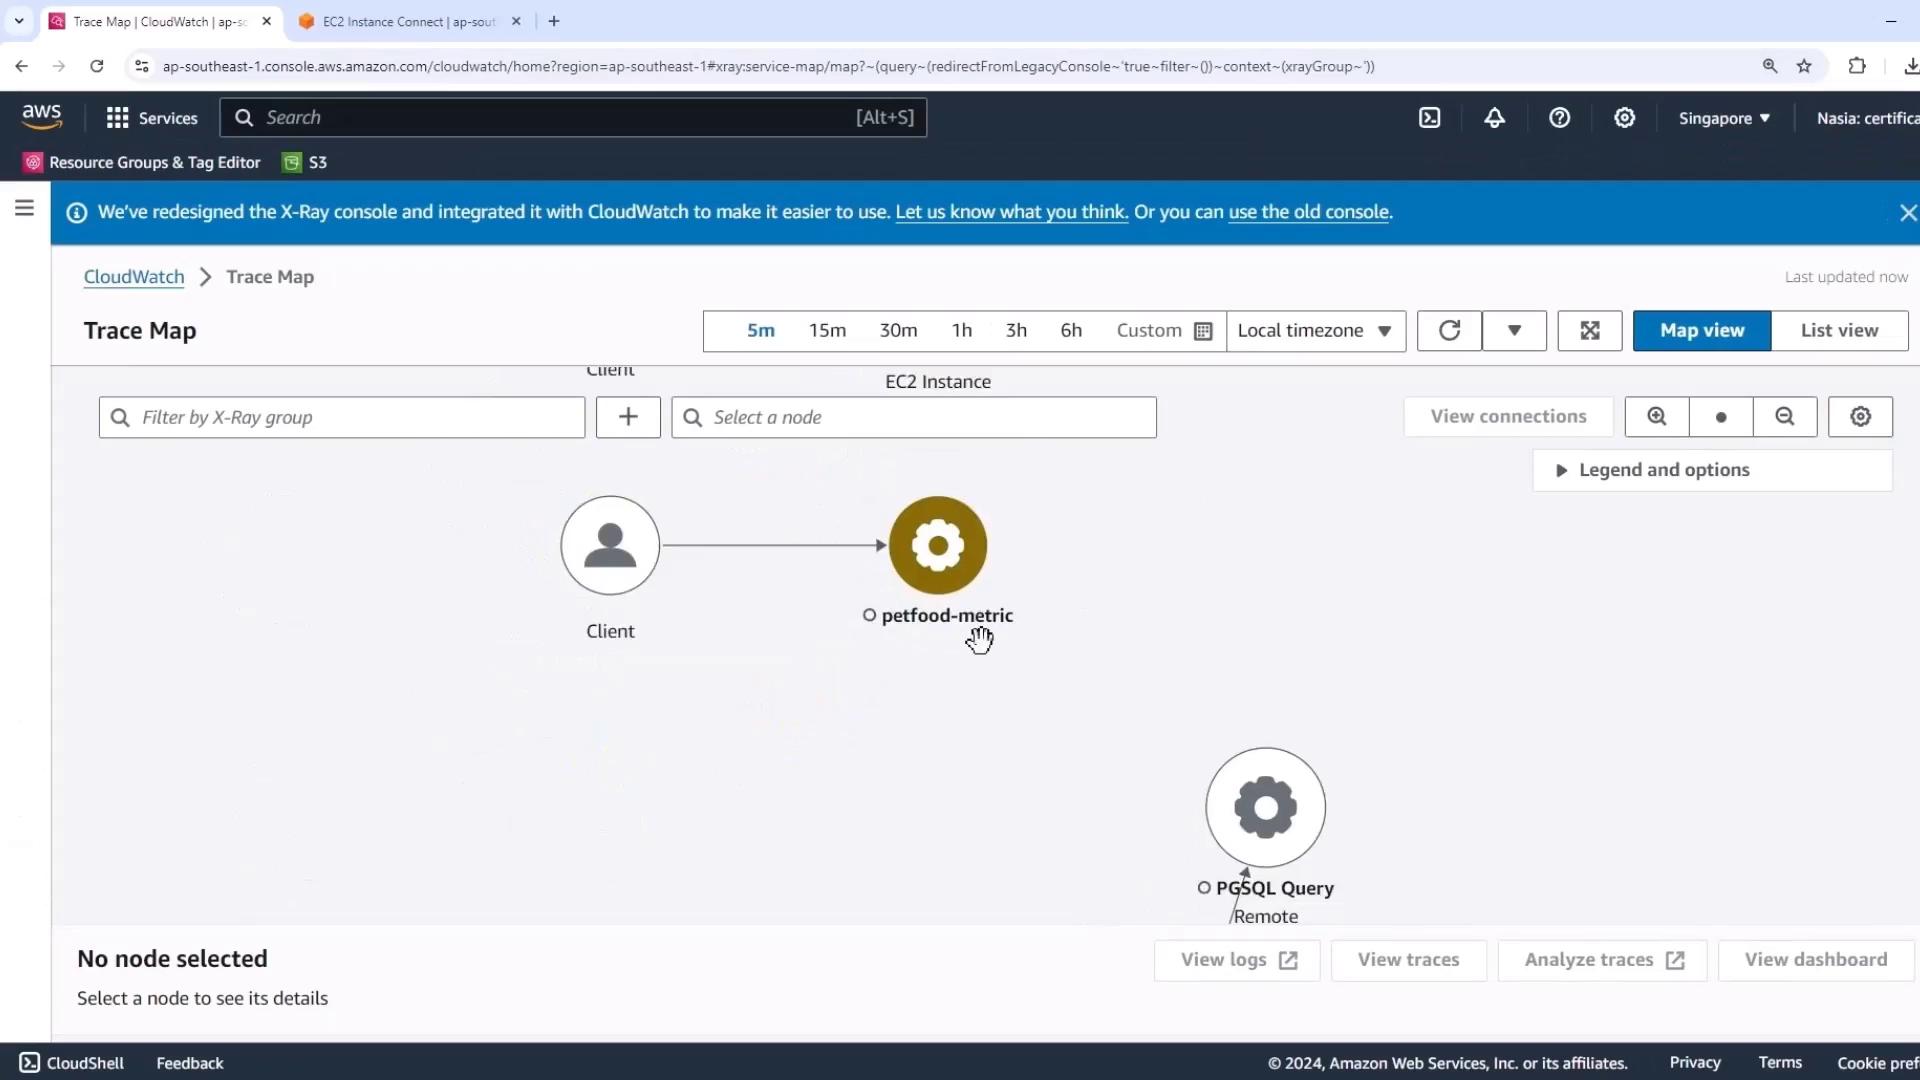
1.1 Verifying with X-Ray Trace Map
- In the AWS Console, navigate to AWS X-Ray → Trace Map.
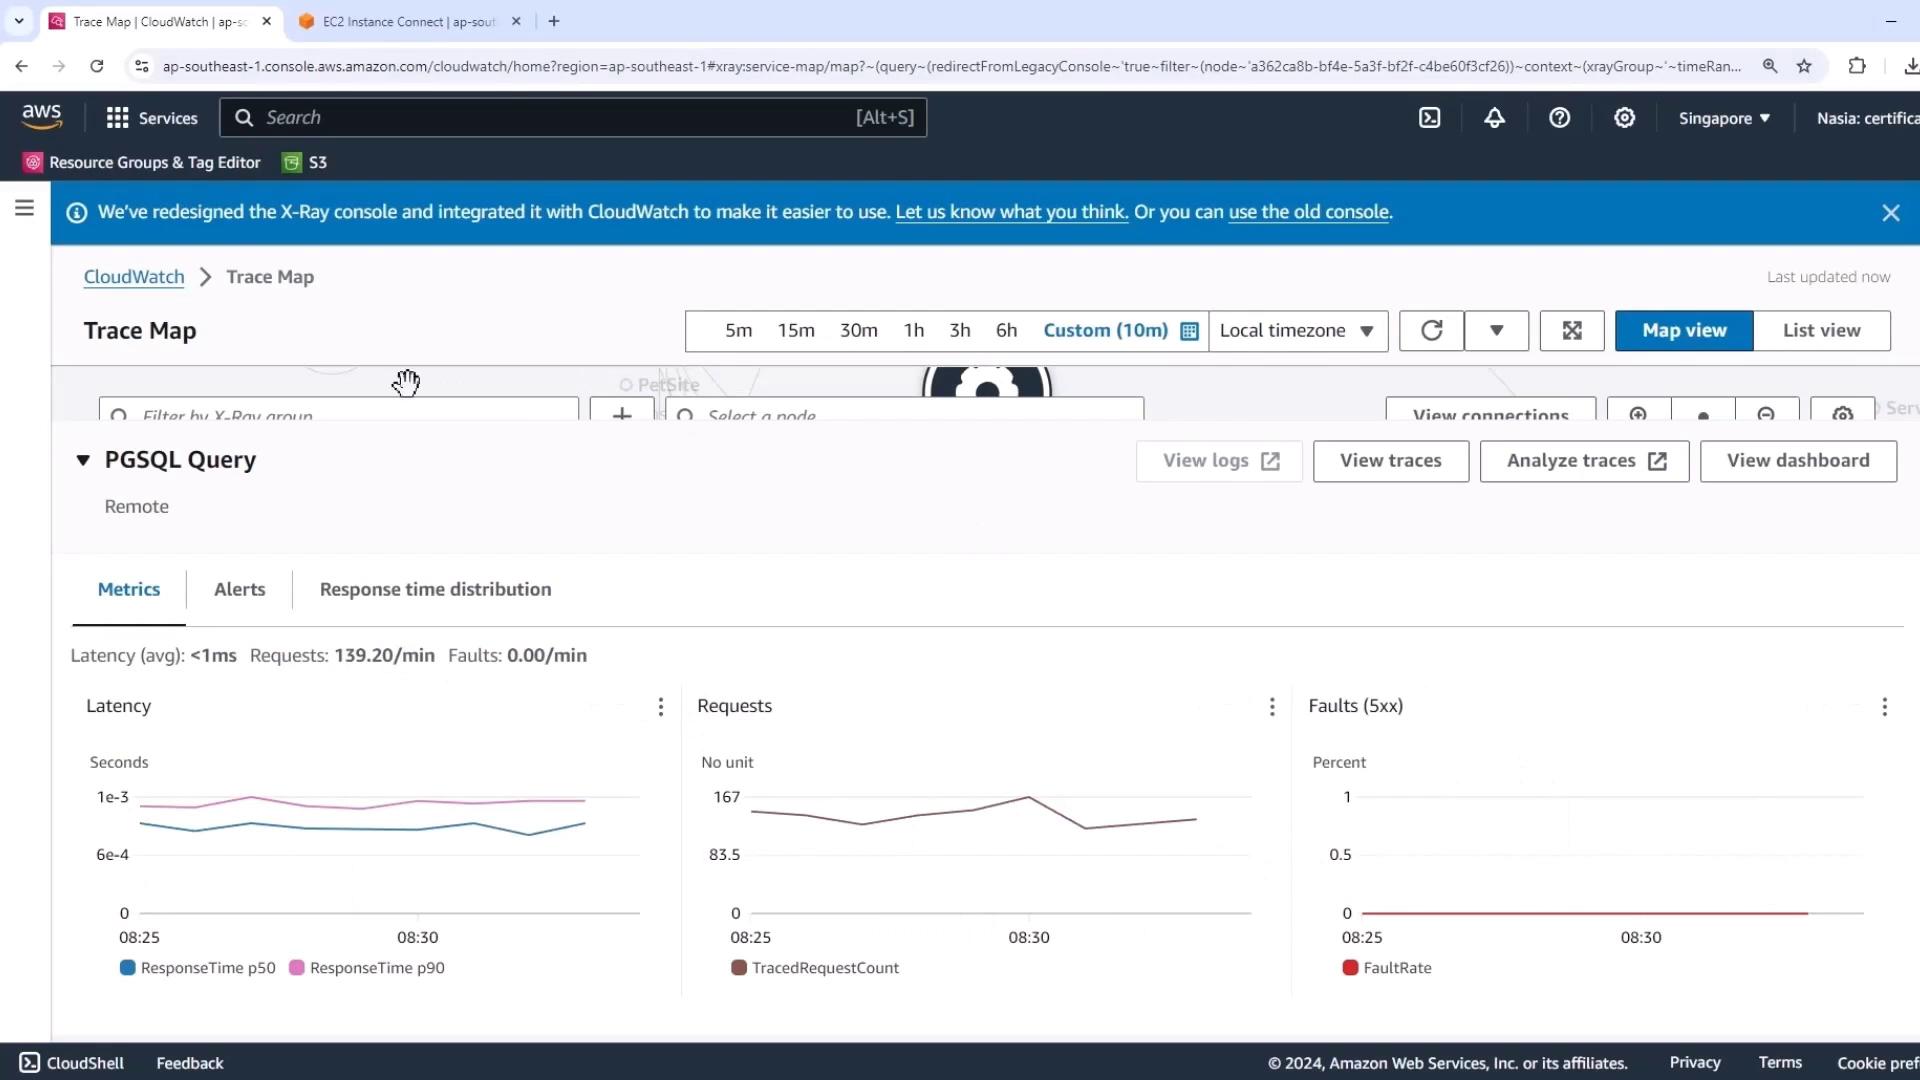
- Filter on the PGSQL Query service node and set the time window to the last 10 minutes.
You should observe:
- Sub-millisecond latencies
- ~139 requests per minute
- Zero faults
1.2 Monitoring Database Metrics in CloudWatch
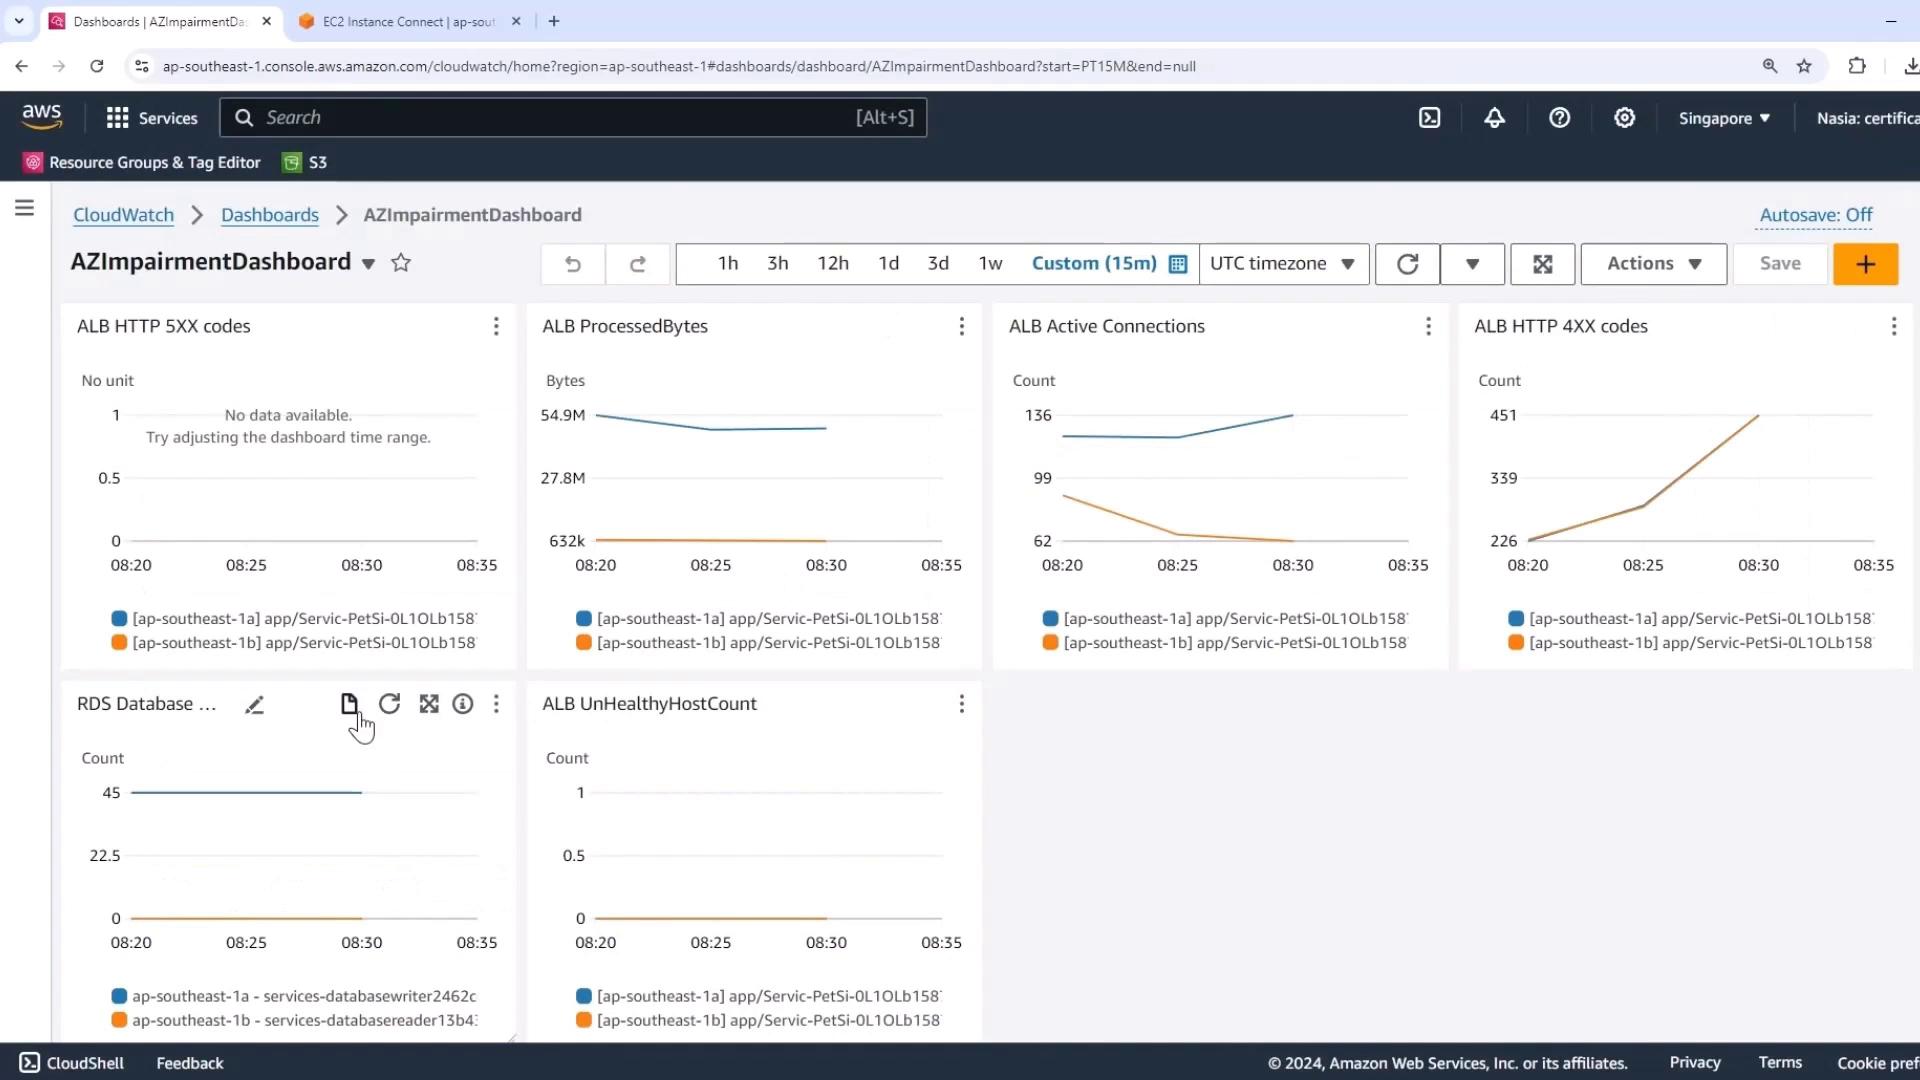
Open your custom Easy Impairment Dashboard in CloudWatch. Set the time range to 15 minutes and verify:
| Metric | Console Widget | Expected Steady State |
|---|---|---|
| RDS Writer Connections | RDS Database connections (blue line) | Steady at writer node only |
| RDS Reader Connections | RDS Database connections (orange line) | Zero reader connections |
| UnHealthyHostCount | ALB UnHealthyHostCount | Zero |
| Latency / Fault Rate | PGSQL Query metrics | <1 ms latency; 0% faults |
2. Launch the Power Interruption Experiment
Now that baseline metrics are confirmed, we’ll execute the fault injection using AWS FIS.
- Go to AWS Fault Injection Simulator in the console.
- Select the Easy Power Interruption template.
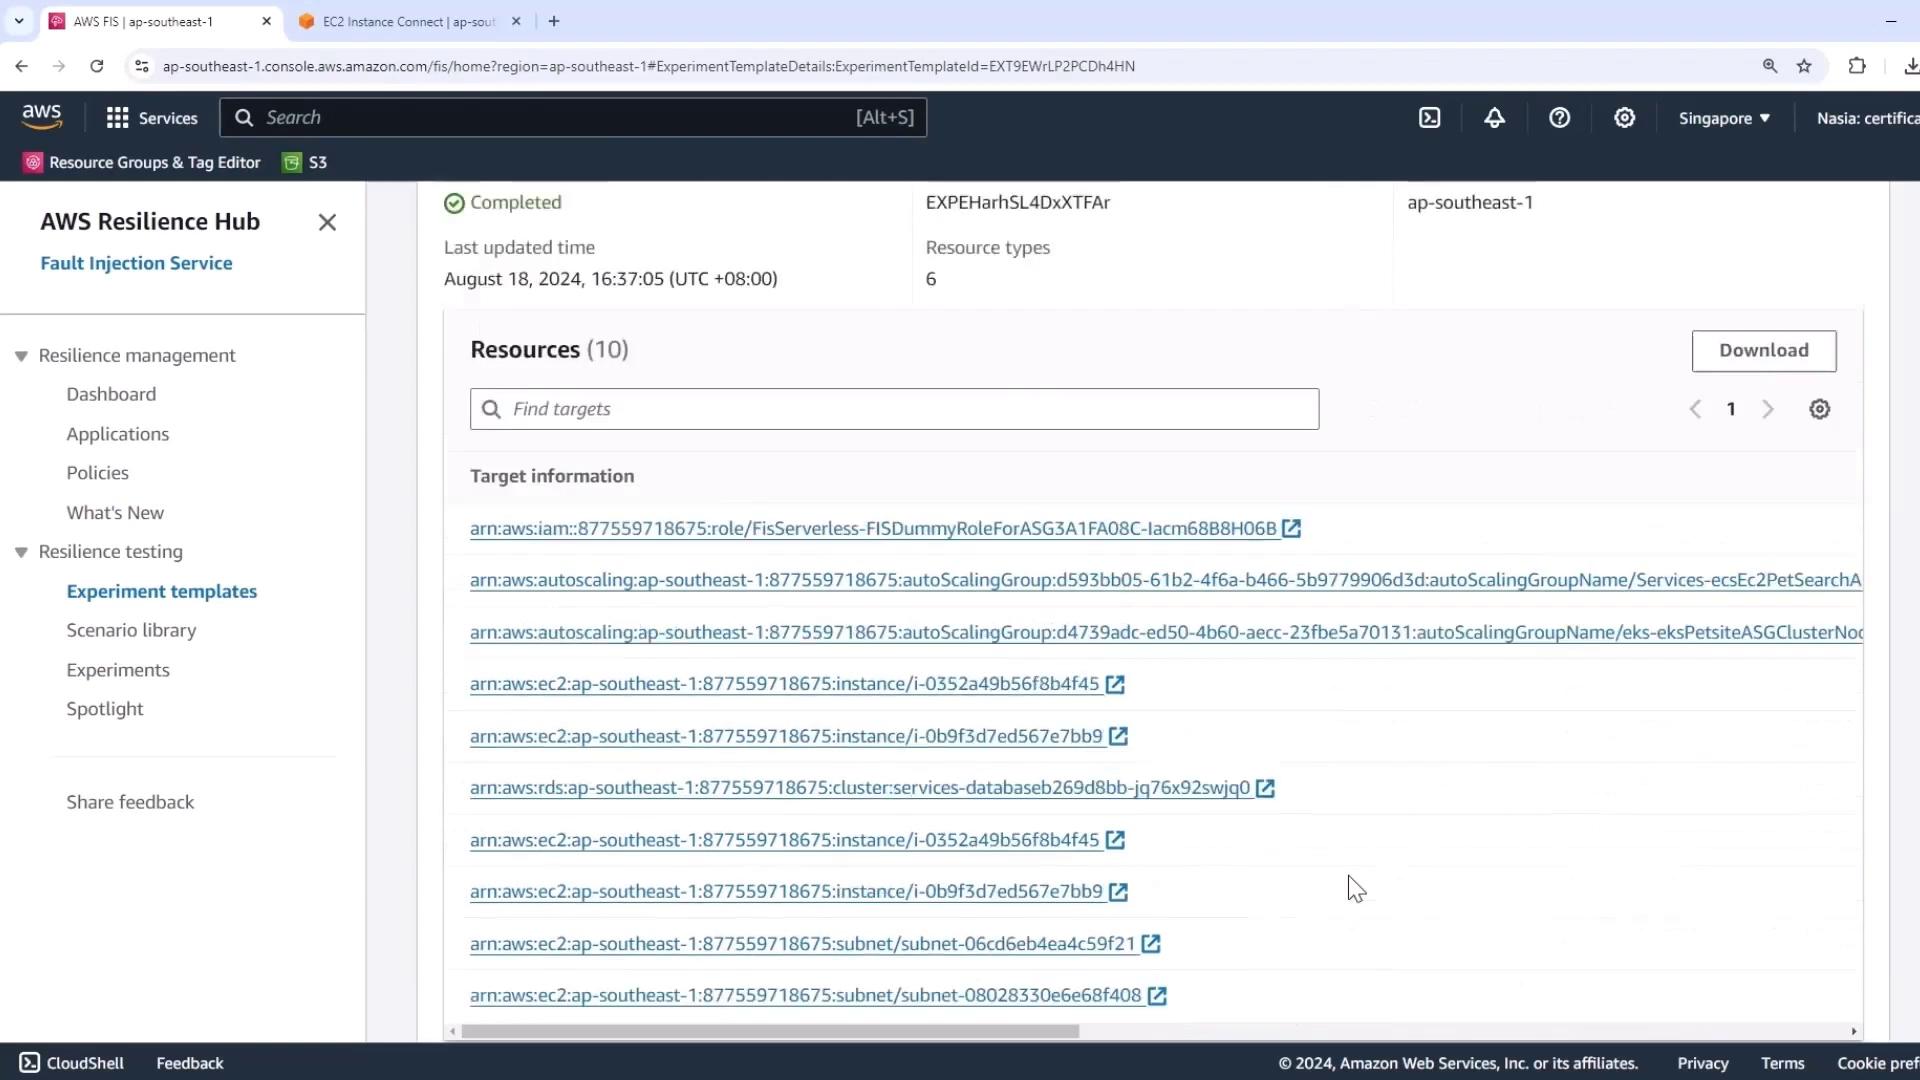
- Click Preview targets to review the affected resources.
Warning
Double-check your target resources. This experiment will impact EC2 instances, Auto Scaling groups, subnets, RDS clusters, and more.
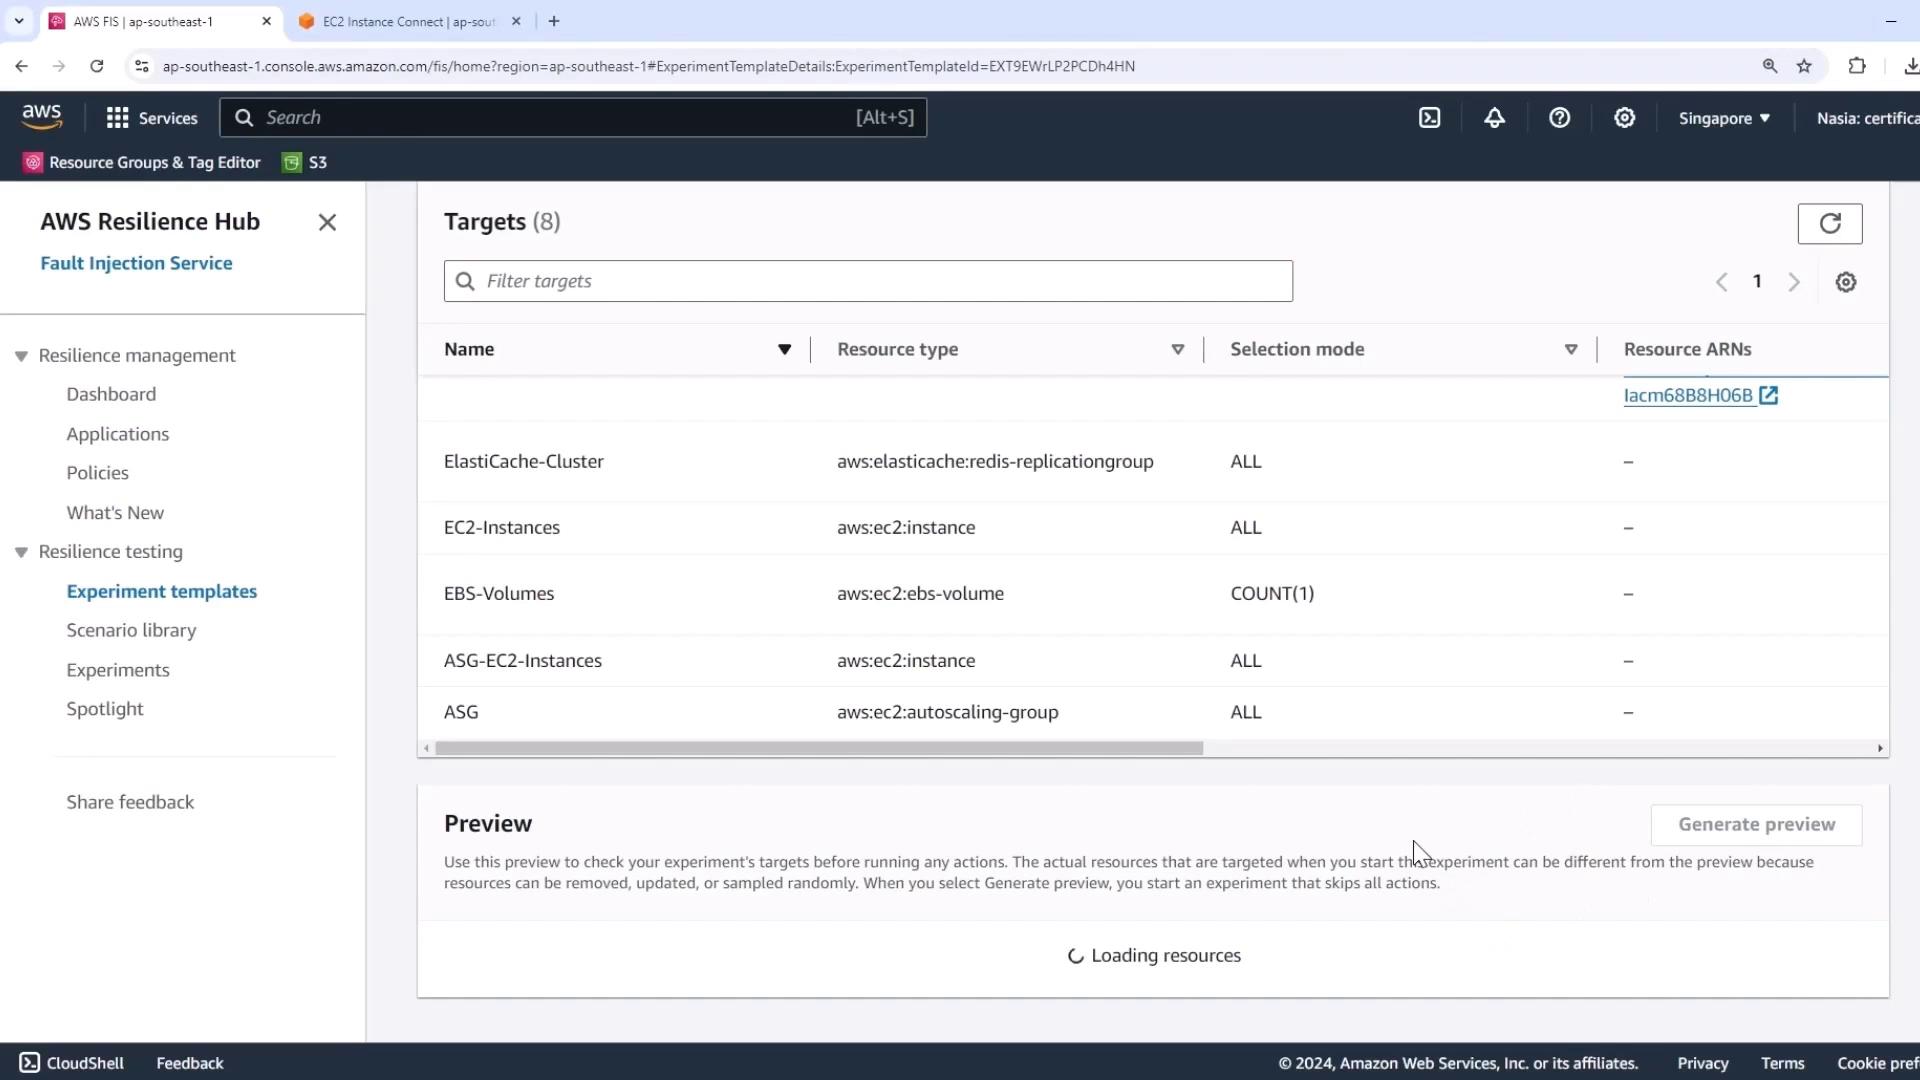
The preview lists:
- Custom IAM role
- EC2 instances & Auto Scaling group
- Aurora RDS cluster
- Subnets, security groups, etc.
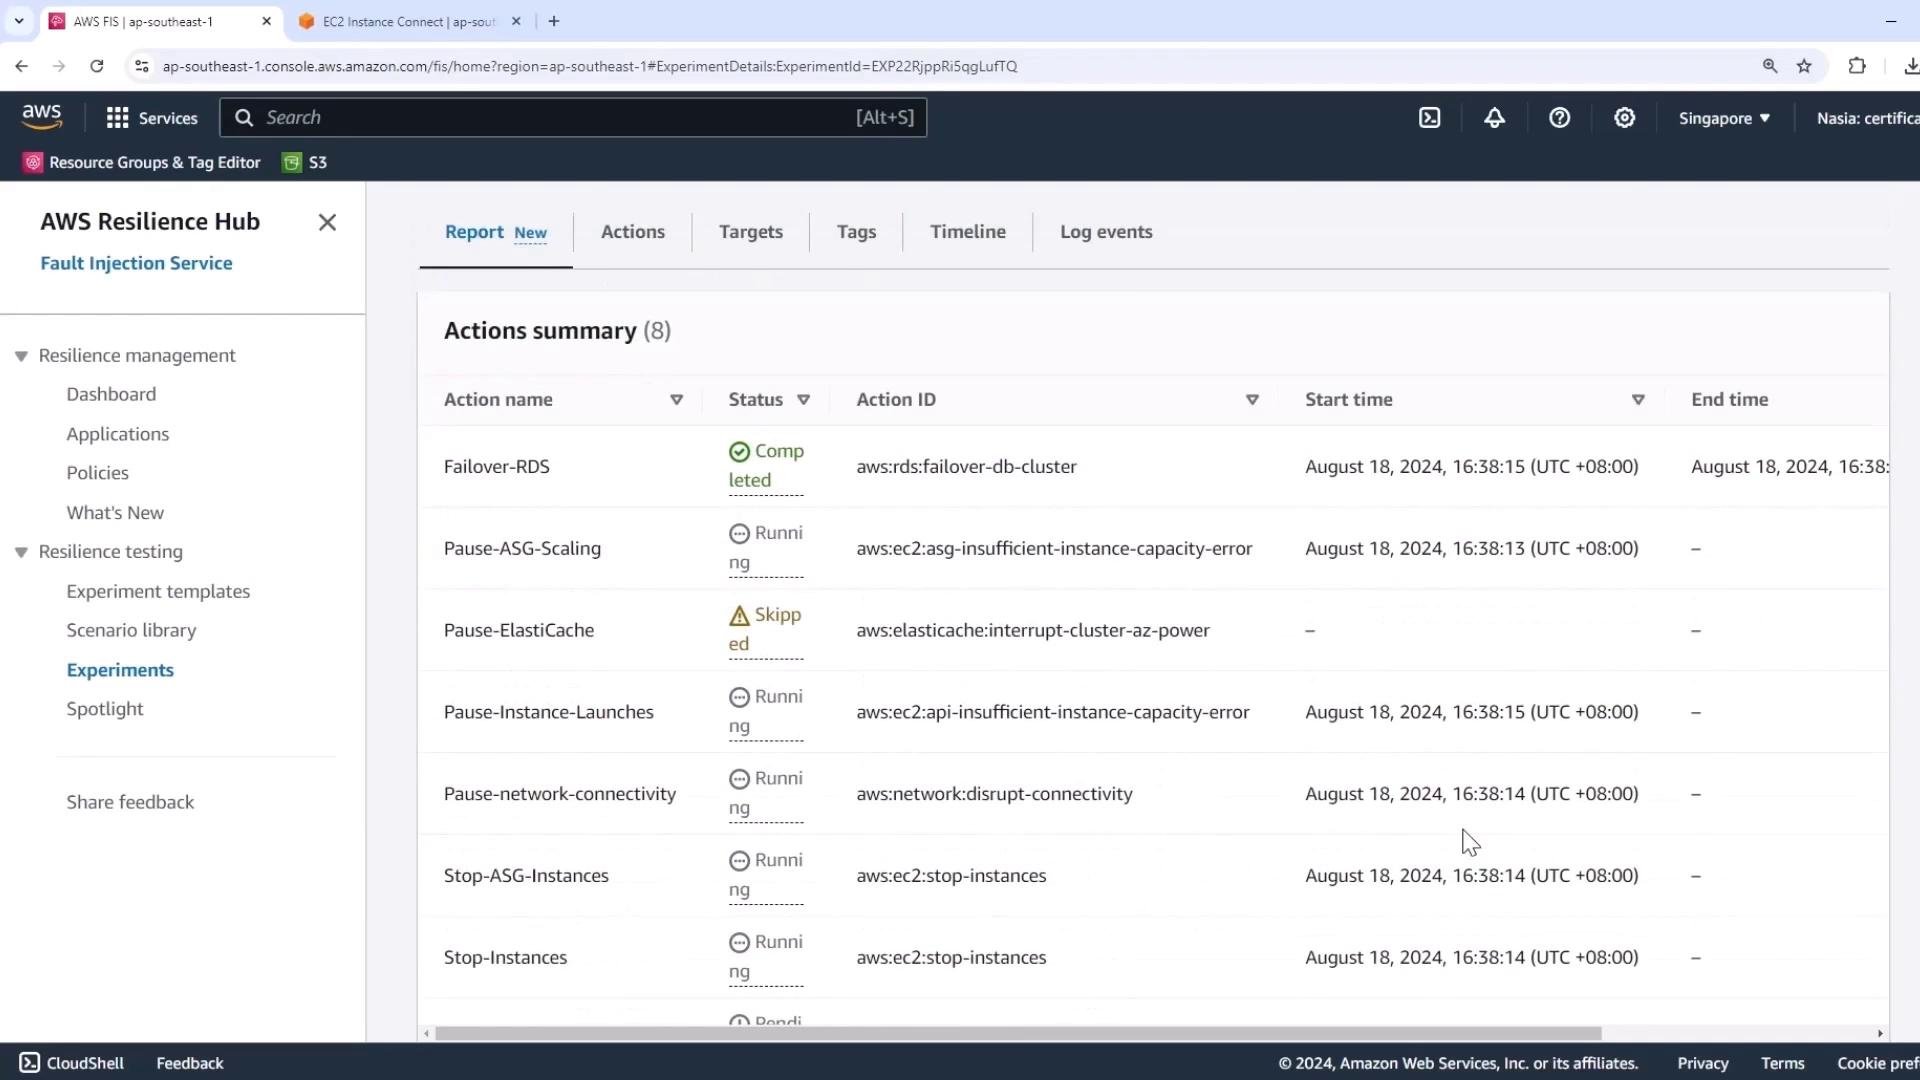
When you’re ready, click Start experiment.
AWS FIS will execute actions in sequence. If a resource type isn’t present (e.g., ElastiCache), FIS skips it without failing the experiment.
3. Observe the RDS Failover
As the power interruption hits one AZ, your Aurora cluster will automatically fail over to the standby instance.
- Open the Amazon RDS console.
- Watch the writer and reader roles swap in your DB cluster view.
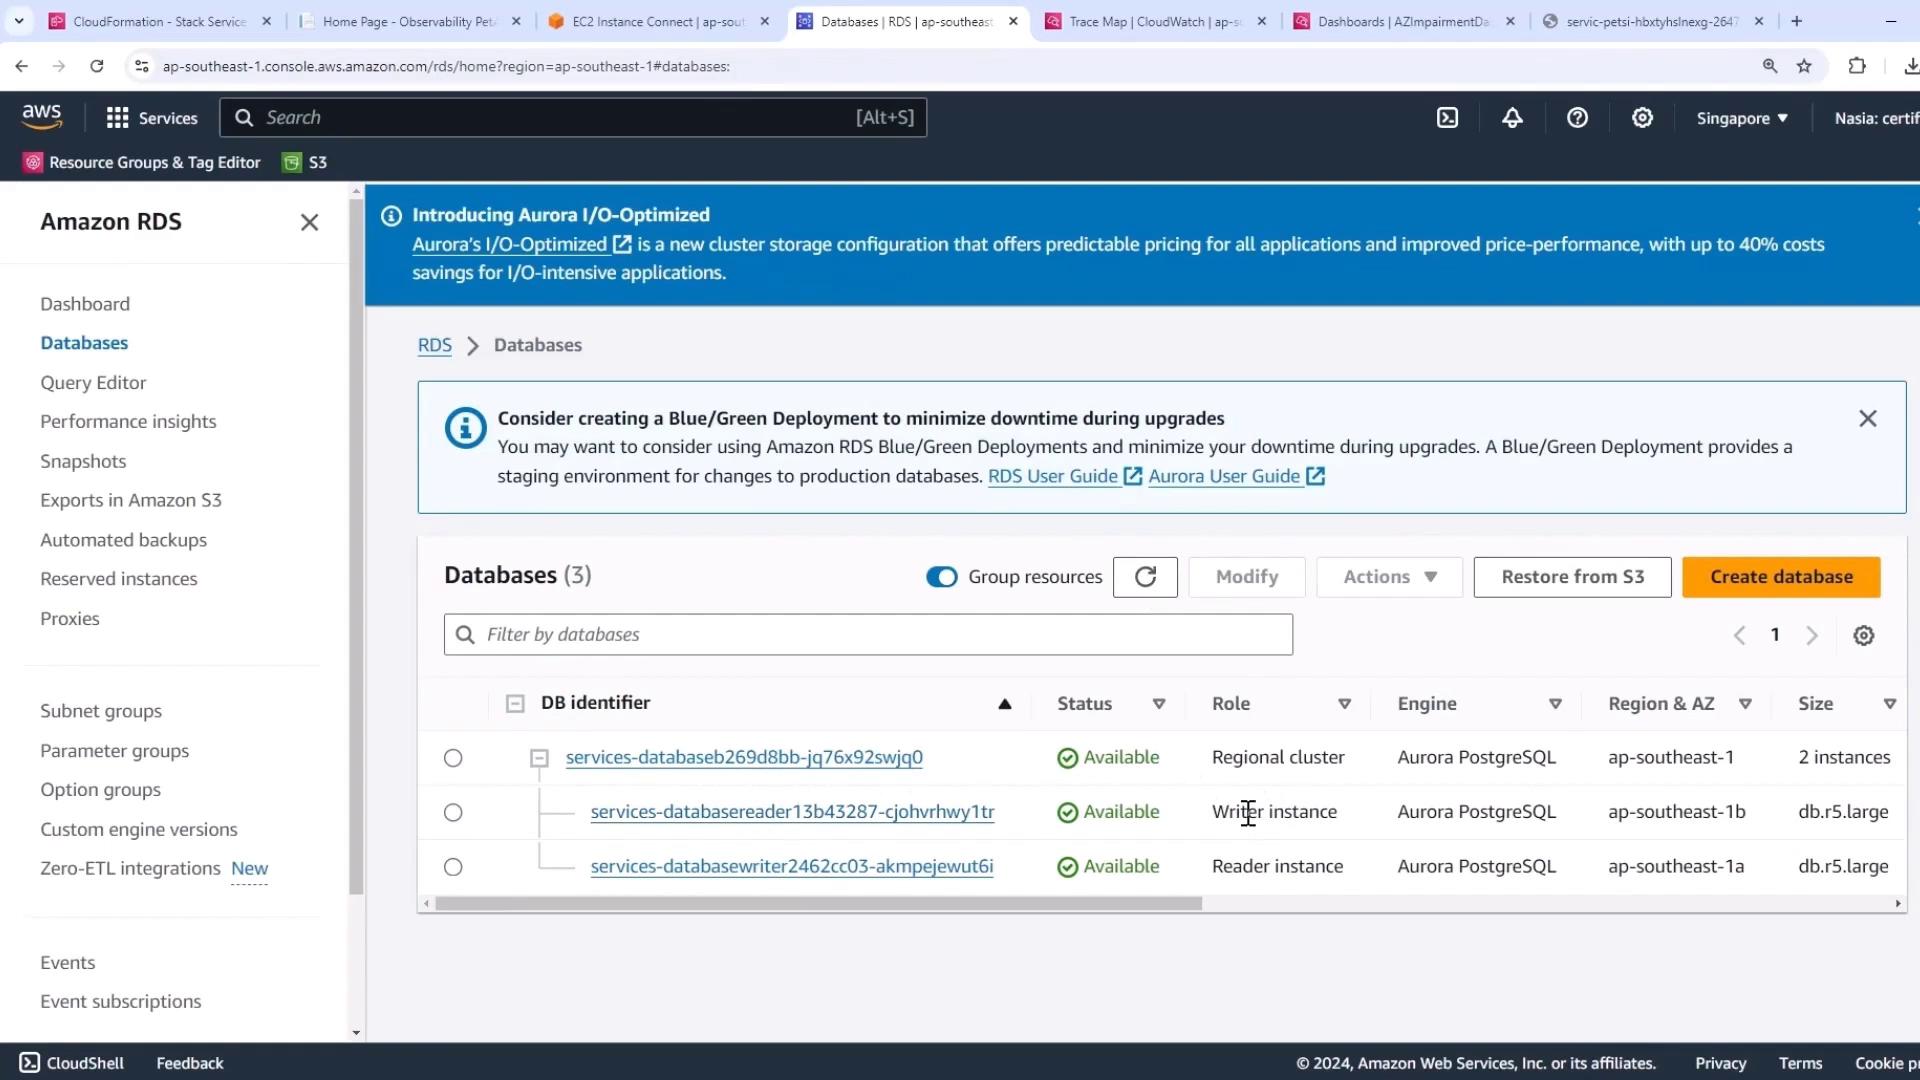
The failover typically completes in seconds, restoring full write capability.
4. Measure Impact on Application Metrics
Switch back to the Easy Impairment Dashboard with a 10-minute range to capture transient effects:
- Writer-node connections dip briefly
- Reader-node connections rise to accommodate traffic
- A short-lived spike in UnHealthyHostCount
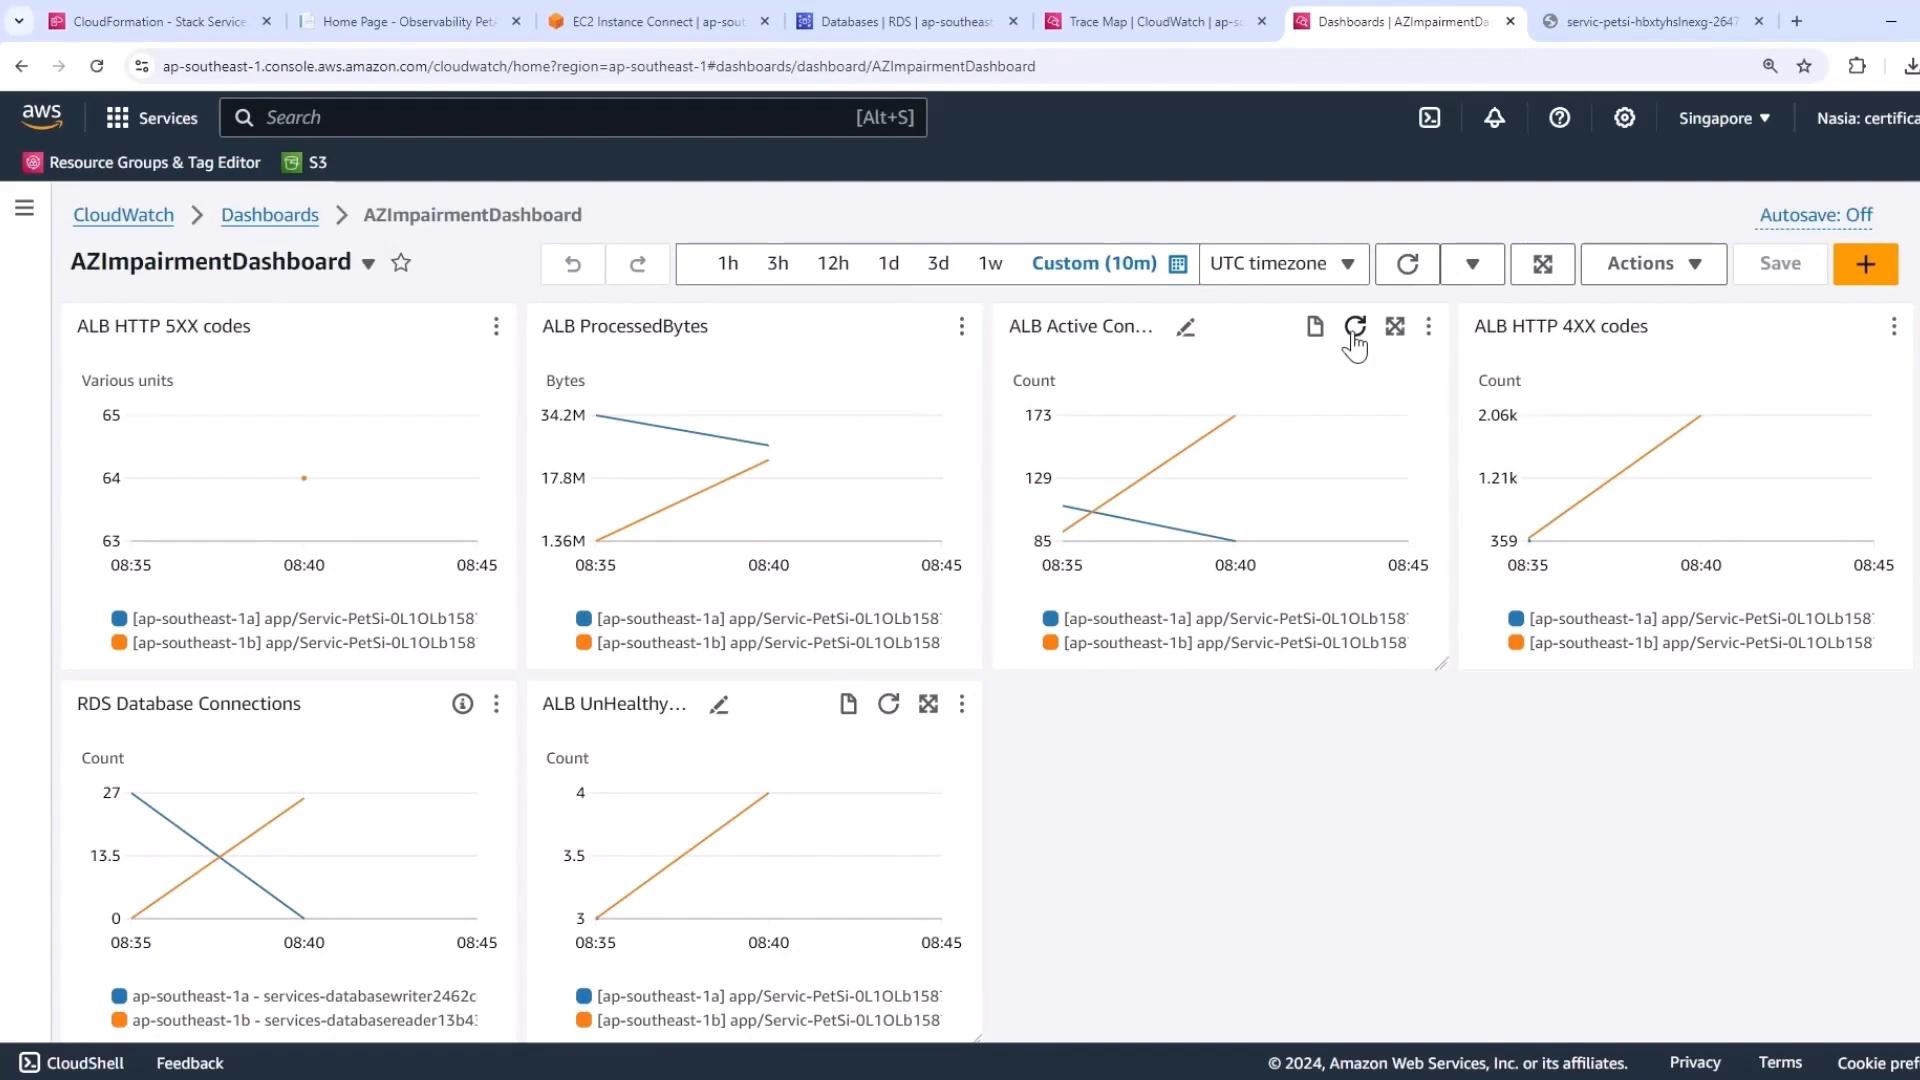
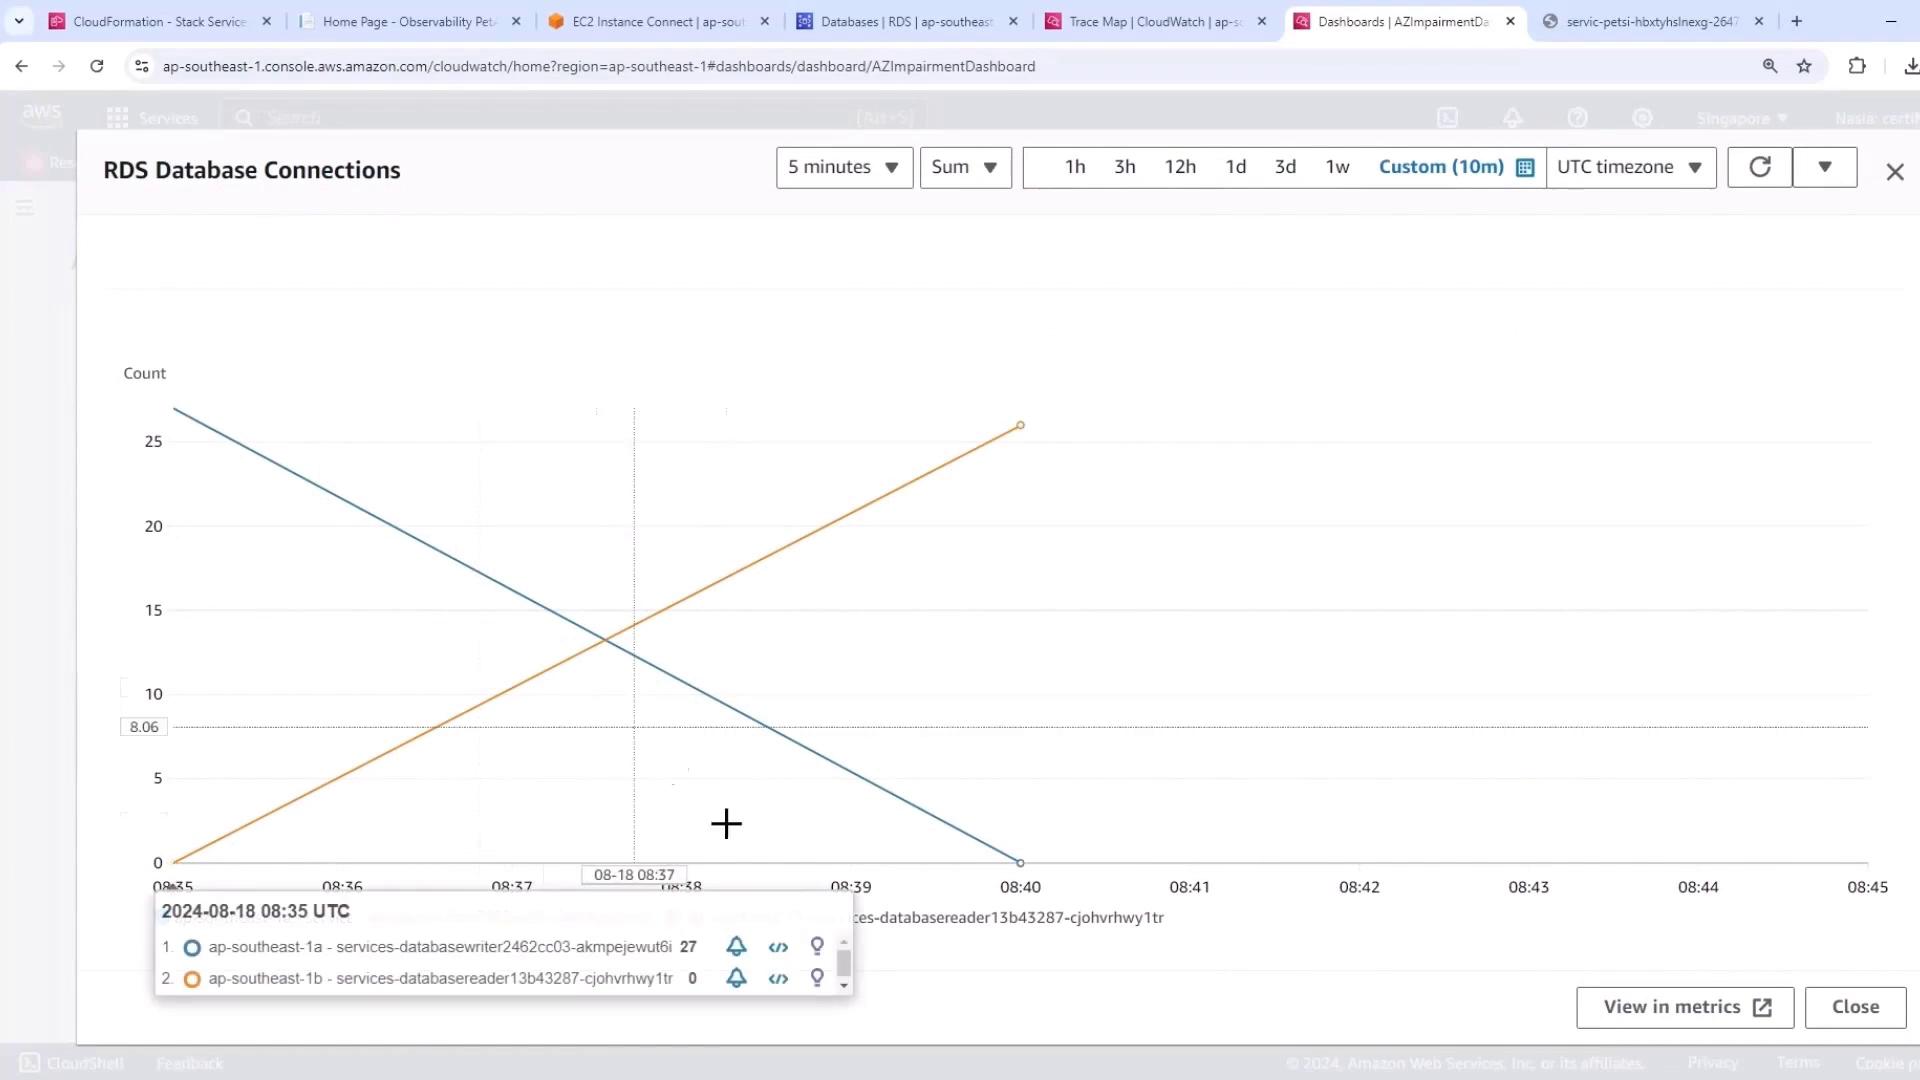
Despite momentary fluctuations, the pet adoption site remains fully functional with no end-user errors.
Conclusion
By simulating a power loss in one Availability Zone, we verified that:
- Aurora multi-AZ failover happens automatically and swiftly
- The application maintains availability and performance
- AWS FIS provides a controlled, repeatable chaos engineering workflow
Replace routine DR drills with targeted chaos experiments to uncover hidden configuration gaps and continuously improve your system’s resilience.
Links and References
- AWS Fault Injection Simulator Documentation
- Amazon RDS Auto Scaling & Failover
- AWS X-Ray Trace Map Overview
Watch Video
Watch video content