1. Observe Container Insights Performance
Begin by reviewing your Amazon EKS service metrics with CloudWatch Container Insights. Track these core indicators:| Metric | Description |
|---|---|
| Running pod count | Number of pods currently in service |
| Pod CPU utilization | CPU usage per pod |
| Pod memory utilization | Memory usage per pod |
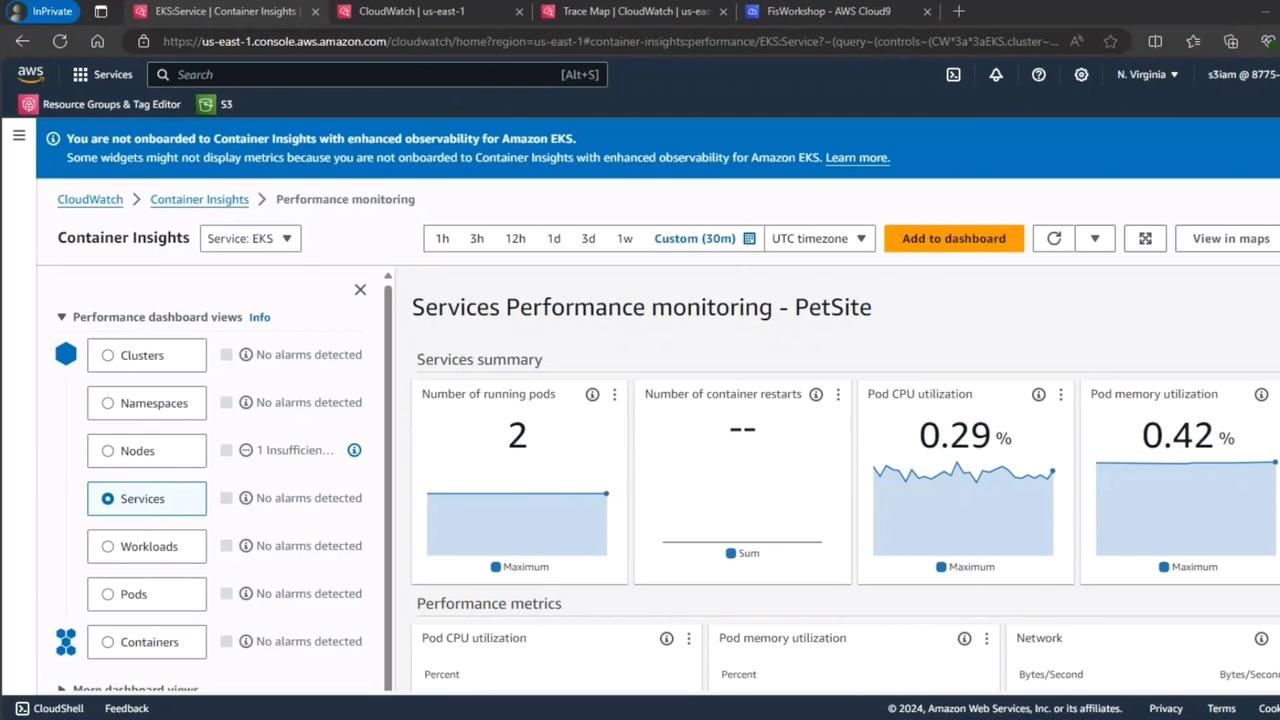
These charts represent the steady state of the
PetSite service under normal conditions.2. Verify End-User Experience with CloudWatch RUM
Next, validate real user metrics using CloudWatch RUM. This helps you understand page load performance and client-side errors: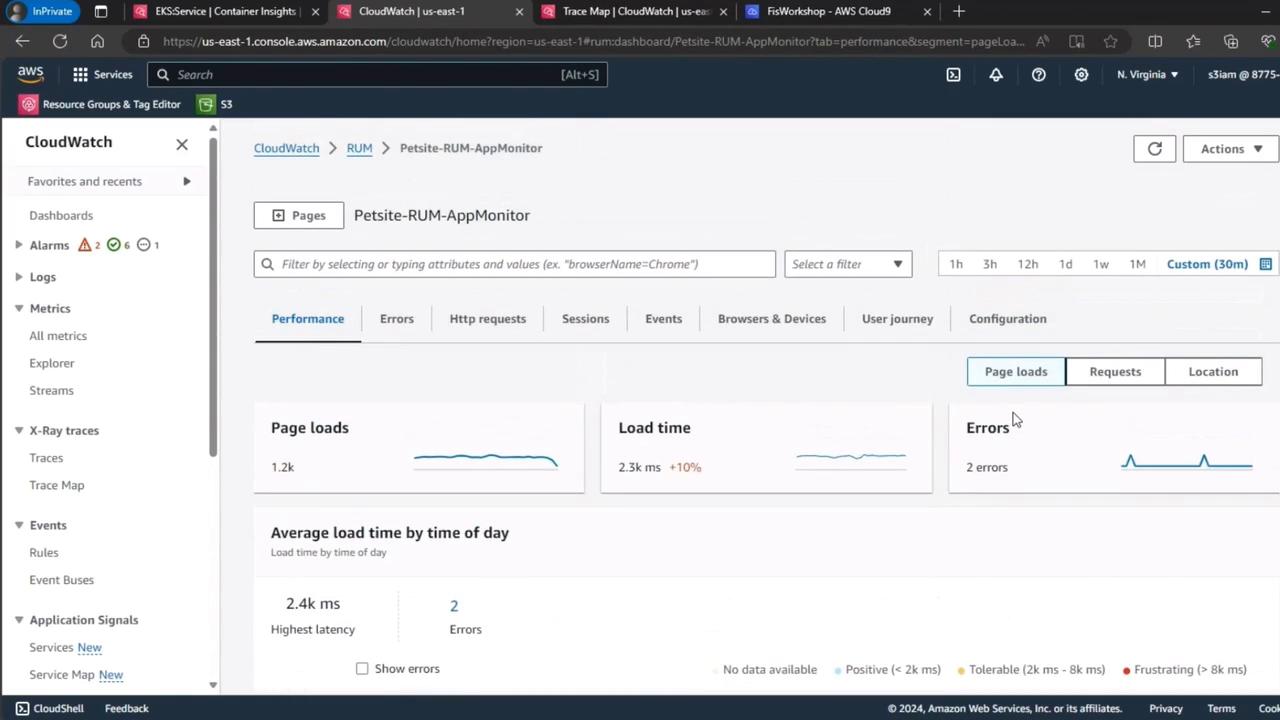
3. Simulate Load with k6
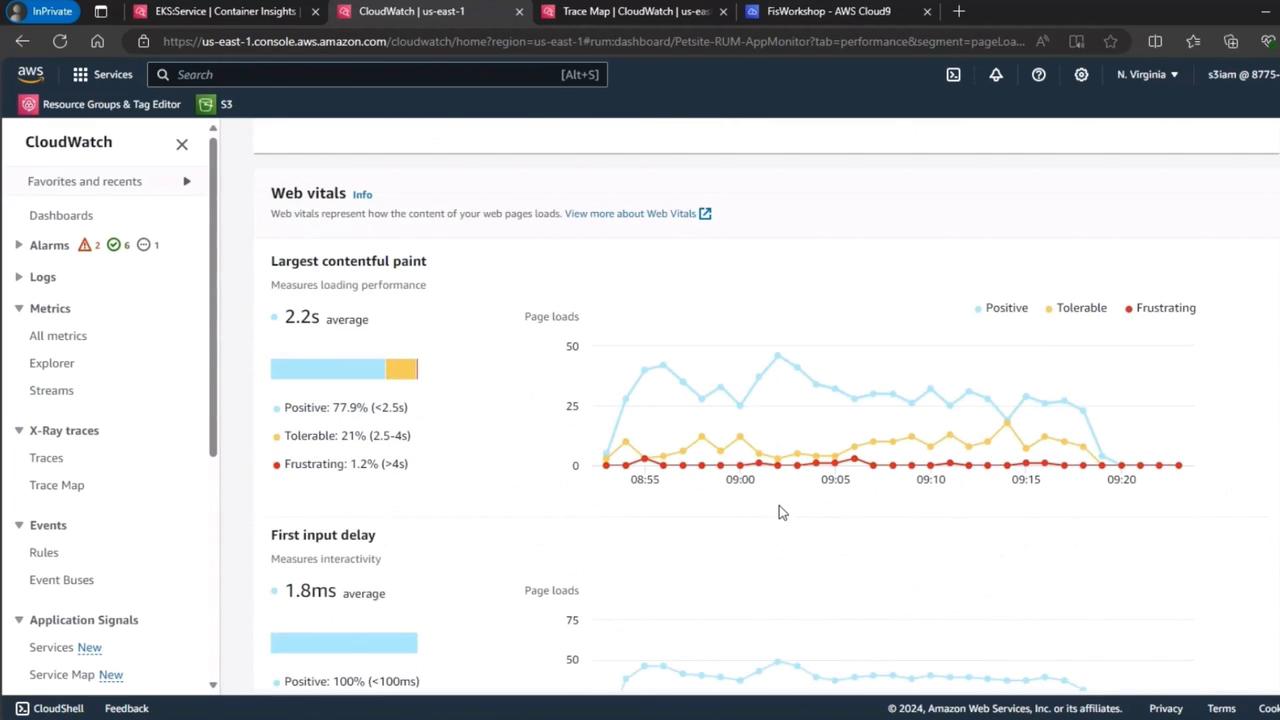
Generate realistic user traffic using k6 to ensure the baseline reflects production behavior. For example:Approximately 1% of virtual users experienced frustration, while the rest saw positive load times.
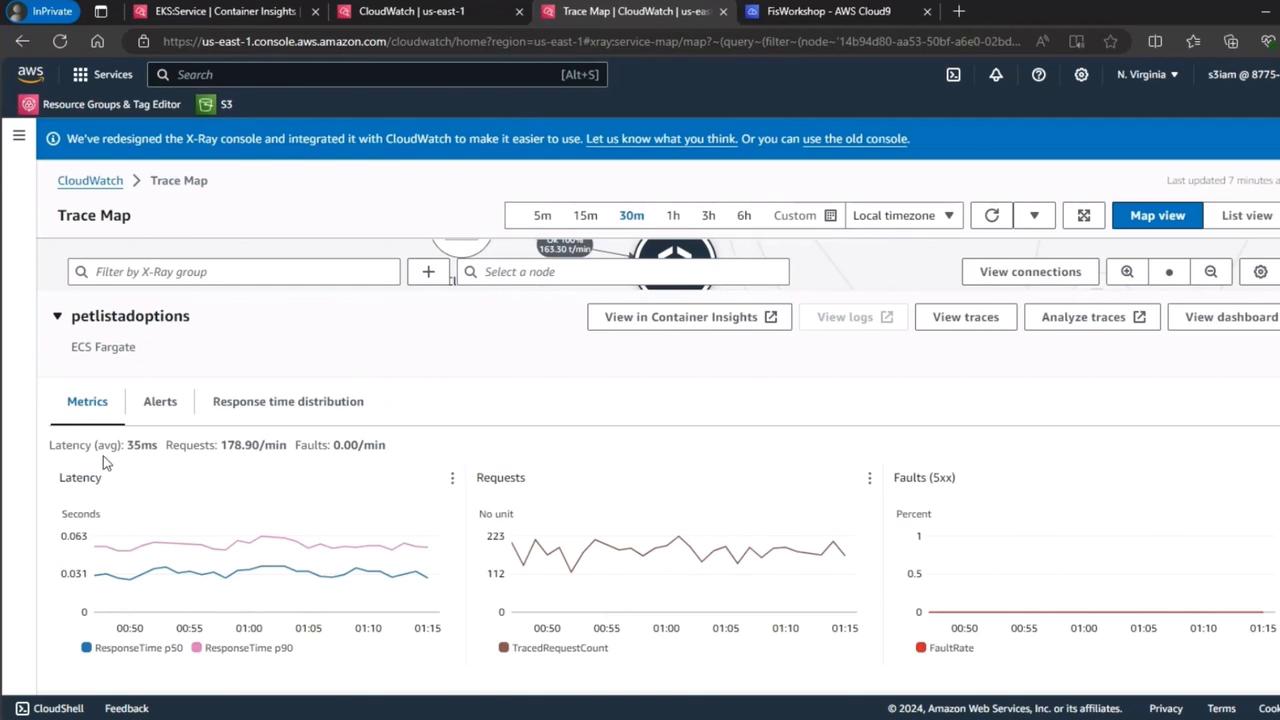
4. Inspect Distributed Tracing with CloudWatch Trace Map
Capture end-to-end request performance for thepetlistadoptions endpoint on EKS Fargate: