1. Real User Monitoring (RUM)
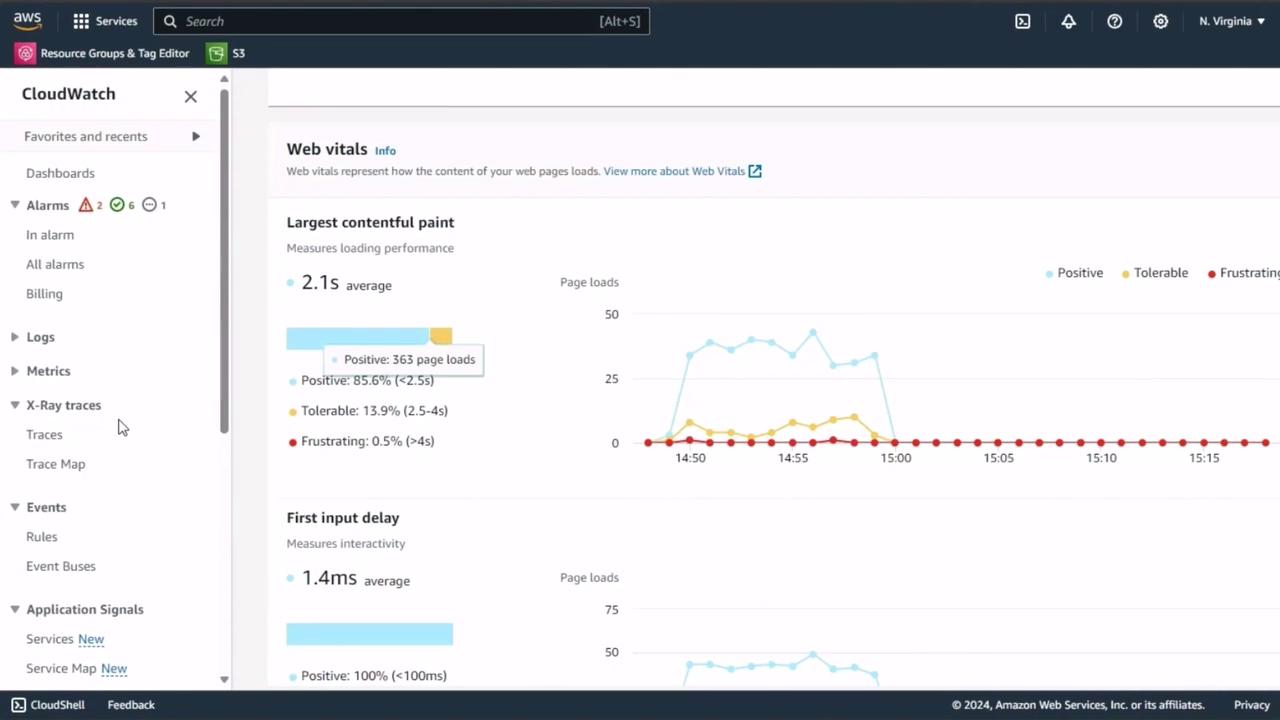
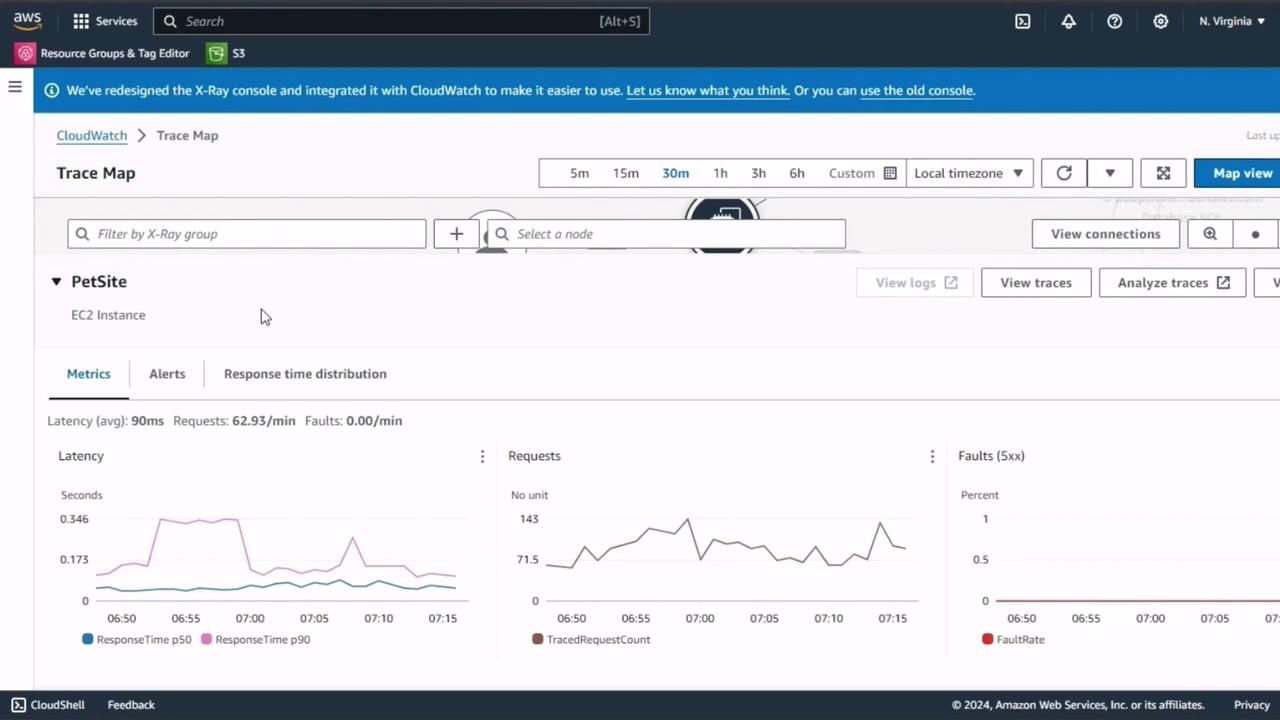
CloudWatch RUM collects key browser metrics from actual users, helping you understand page-load performance and interactivity. We’ve enabled RUM on our homepage; let’s examine the dashboards.Ensure RUM is configured on all critical user flows to gather representative web vitals.
| Metric | Description |
|---|---|
| Largest Contentful Paint | Time to render the largest visible element (LCP) |
| First Input Delay | Delay before the page responds to the first user interaction (FID) |
| Page Load Success Rate | Percentage of page loads without errors |
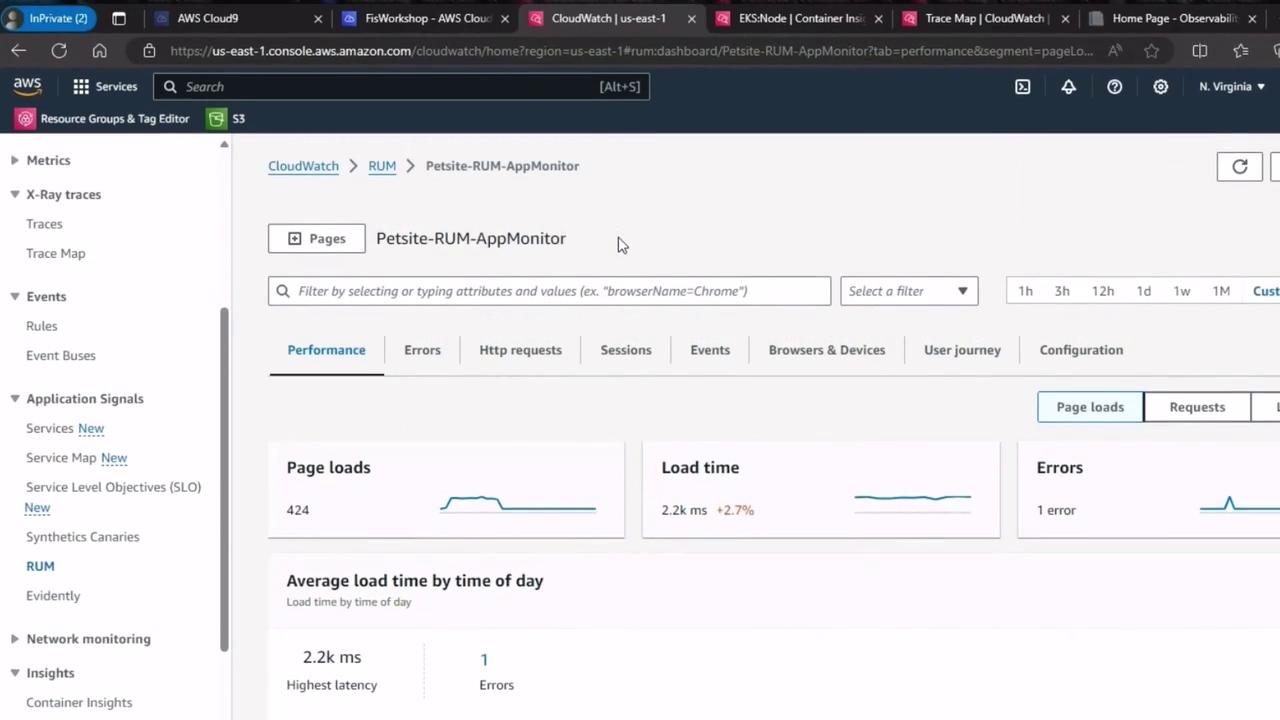
2. CloudWatch Container Insights for Amazon EKS
Switch to Container Insights in the CloudWatch console and select EKS Performance Monitoring. You can filter metrics by nodes, namespaces, pods, or containers.| Component | Key Metrics |
|---|---|
| Nodes | CPU utilization, Memory usage, Pod count |
| Namespaces | Request rate, Error rate, Throughput |
| Pods | Latency, Restart count, Health status |
| Containers | CPU/Memory limits, Network I/O |
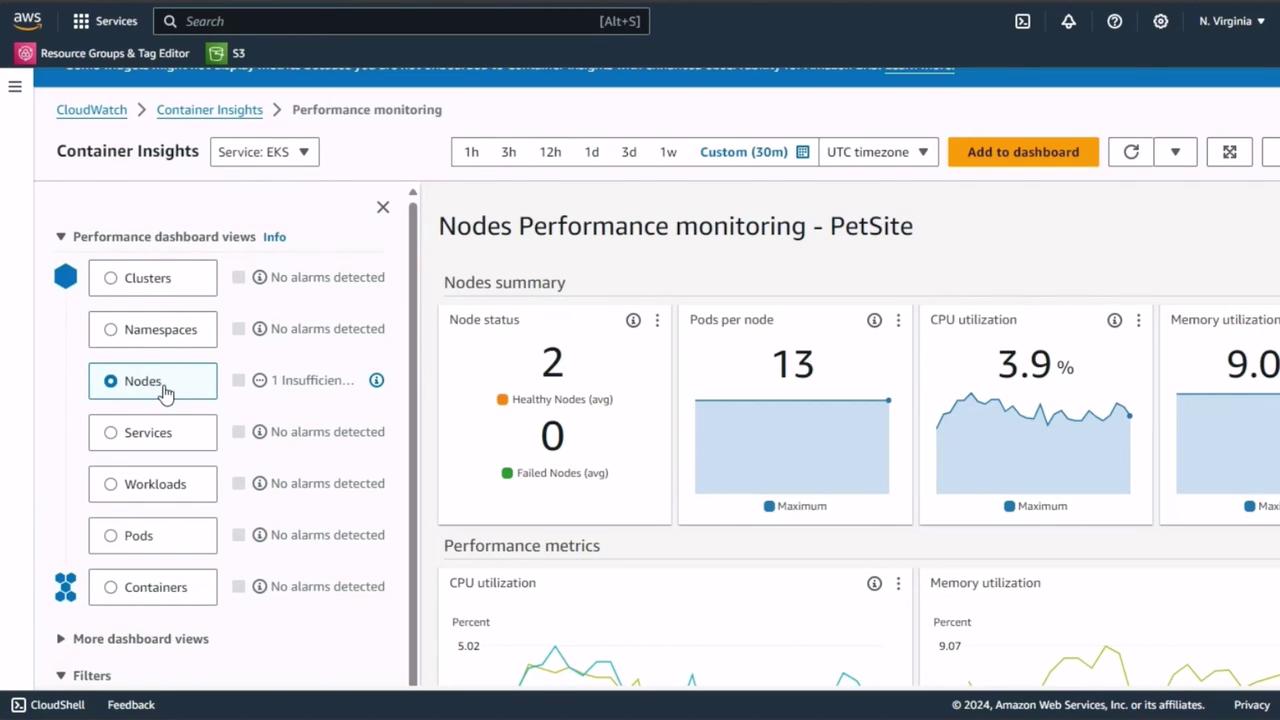
3. AWS X-Ray Trace Map
AWS X-Ray offers end-to-end request tracing across services such as EC2, Lambda, and API Gateway. Use the trace map to pinpoint latency hotspots and error sources.Trace sampling needs to be set appropriately. Over-sampling can increase costs, while under-sampling may hide critical issues.
By capturing steady-state metrics from CloudWatch RUM, Container Insights, and X-Ray, you’ll have a robust performance baseline. Use these figures to compare against results after injecting faults, ensuring you can accurately gauge the resilience and reliability of your application.
Links and References
- AWS CloudWatch RUM
- Container Insights in CloudWatch
- AWS X-Ray Developer Guide
- Chaos Engineering on AWS