Building Kibana Dashboards to Visualize Our Application Part 1
This article explores creating an index in Kibana and visualizing logs from a Fluent Bit application.
Hello and welcome back!In our previous article, we successfully deployed a Fluent Bit application that forwarded logs to Elasticsearch. Now, we will dive into visualizing these logs using Kibana.This article is organized into three parts. In Part 1, we will explore Kibana by creating an index and reviewing the logs. We will evaluate whether the current log structure is sufficient or if it requires improvements.Let’s get started by accessing Kibana in our Kubernetes cluster.
Copy the Kibana port number, click on the three dots next to its service, choose “New Port,” and paste the port number. Then, click “Open Port” to launch the Kibana UI.
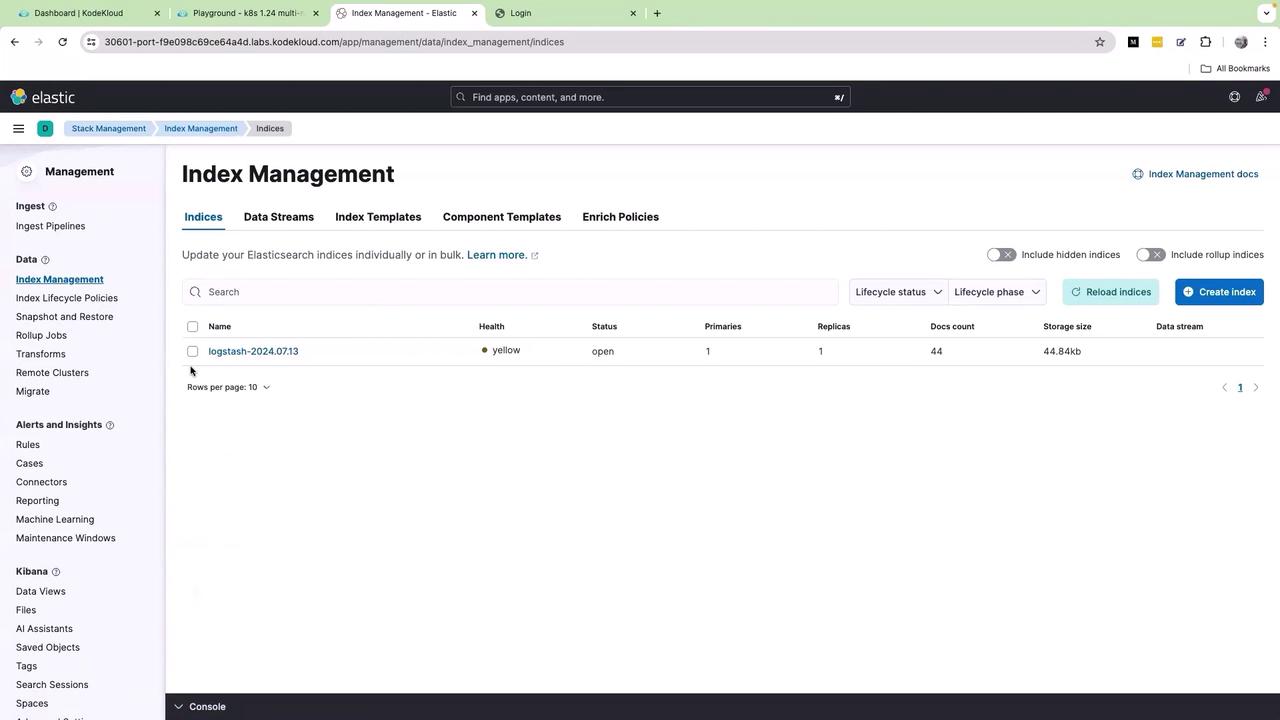
Once the Kibana UI loads, click on the menu icon (the three bars) and navigate to Stack Management → Index Management. Here, you will see an index populated by Fluent Bit:
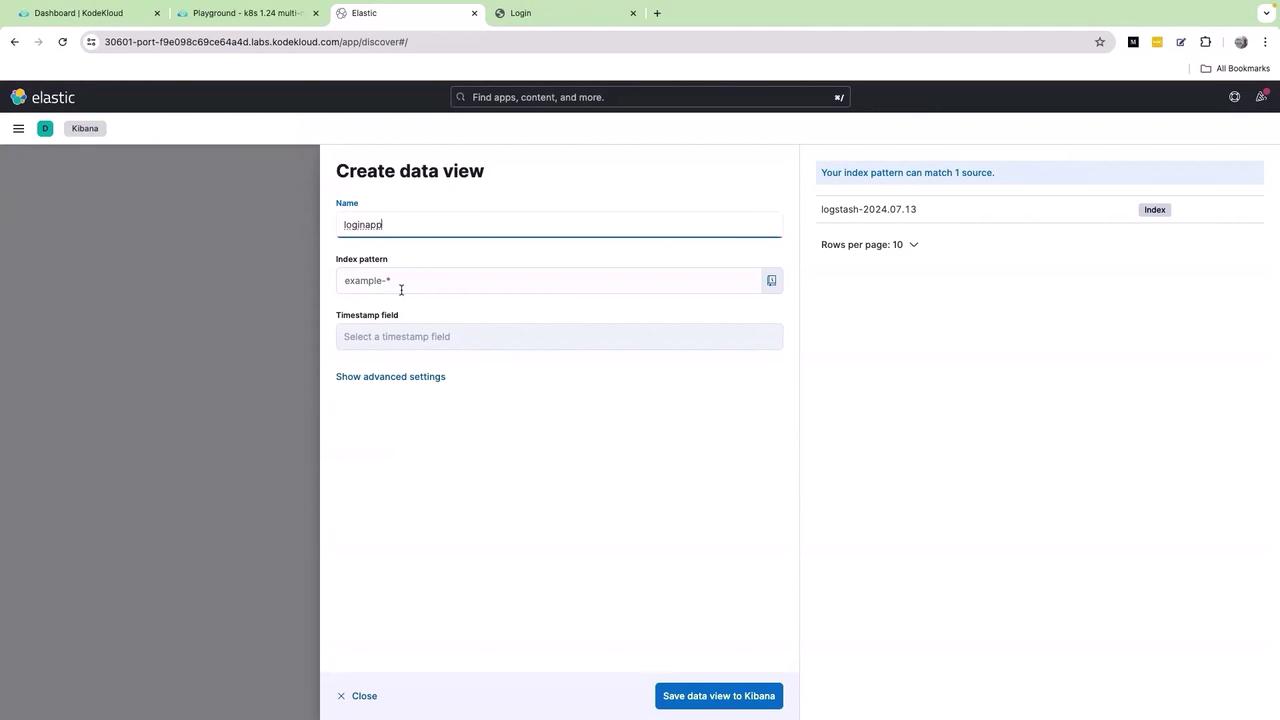
Click on the index name, then select Discover Index. Next, click on Create data view. Provide a name for the data view (for example, “login”) and specify the desired index pattern:
After entering the required information, click Save data view.
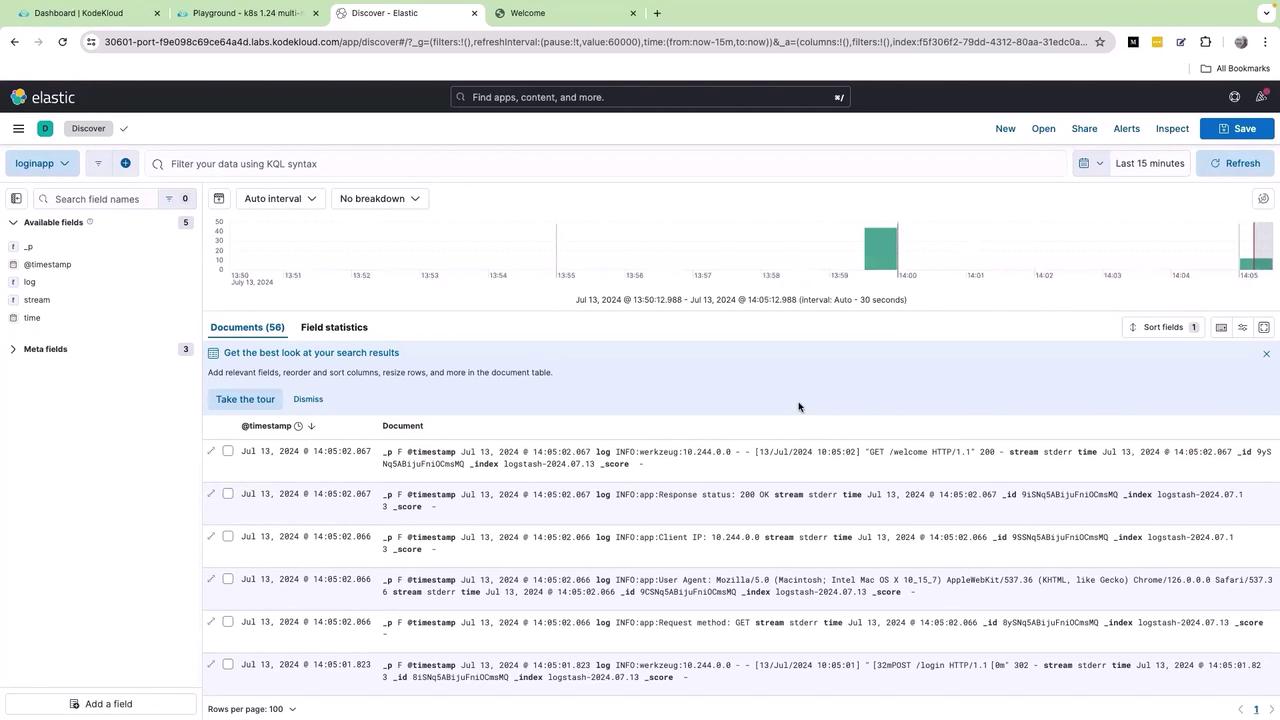
Upon saving, you will be redirected to the Kibana UI where logs are visualized in real time:
To verify that logs are flowing into Elasticsearch, log into your application using any username and password. After a successful login, refresh Kibana. New records should appear, confirming that the end-to-end integration is working.Every front-end UI action is now logged and can be visualized in real time:
Review the available log fields such as timestamp, log, stream, and time. Click on the log field to view its subfields, which include various log levels such as info and warnings. By selecting the lens icon, you can create a graph based on the log.keyword field.However, modifying the graph type (such as switching to lines or vertical bars) might not resolve the clutter issue. The logs remain consolidated in a single field due to the way the application sends its logs. Without additional parsing, building a clear and useful dashboard becomes challenging. It requires reliance on extensive KQL queries or regular expressions to differentiate the log details.
Improving the readability of log data may require advanced log parsing techniques to segregate log details into meaningful fields. This will simplify querying and dashboard creation in Kibana.
In the upcoming article, we will demonstrate how to enhance our logging structure. The improvements will make the information sent to Elasticsearch more actionable, allowing for efficient dashboards and easier log analysis.Thank you for reading, and see you in the next part.For additional resources, check out: