This article provides a guide on orchestrating data pipelines using Apache Airflow in a factory IoT setting.
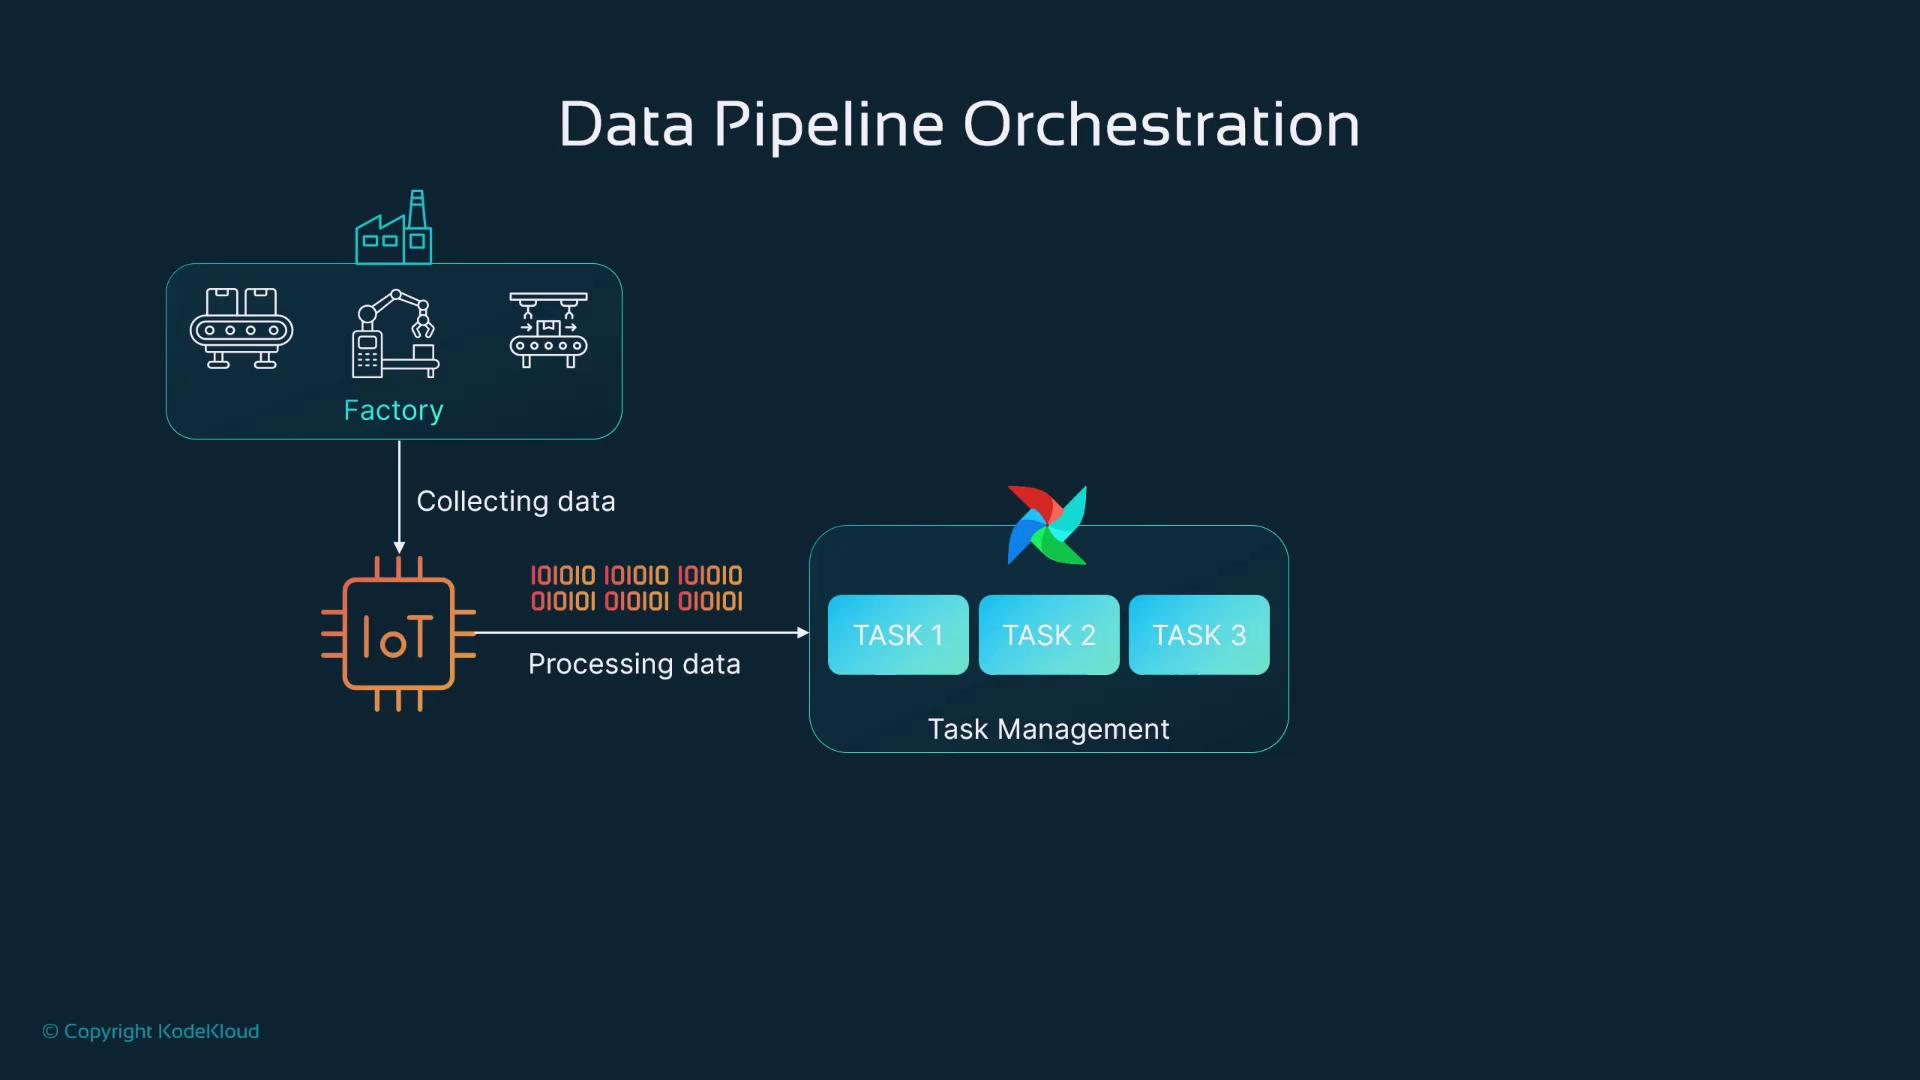
Welcome to this comprehensive guide on data pipeline orchestration using Apache Airflow. In this lesson, you will explore a hands-on demo that illustrates how Airflow processes real-time data from an IoT device in a factory setting. Imagine a manufacturing facility where multiple machines are monitored through IoT devices collecting various metrics. Our objective is to process this data at scheduled intervals using Airflow’s scheduling feature and then share the processed results with maintenance technicians. Airflow streamlines task orchestration and simplifies troubleshooting for data engineers, data warehouse engineers, and MLOps professionals.
In the sections below, we break down each component of the pipeline including Docker image initialization, Airflow configuration, and the creation of DAGs for ETL operations.
In our KodeKloud playground, we start by creating a working directory for our orchestration example and then initialize Airflow using its official Docker image.
Download the Docker Compose File and Configure Folders
Download the required Docker Compose file and set up the necessary folder structure for DAGs, logs, plugins, and configuration:
admin@docker-host:~/example-orchestrations$ mkdir example-orchestrationadmin@docker-host:~/example-orchestrations$ cd example-orchestrationadmin@docker-host:~/example-orchestrations$ curl -LLo 'https://airflow.apache.org/docs/apache-airflow/2.10.2/docker-compose.yaml'% Total % Received % Xferd Average Speed Time Time Time Current100 11342 100 11342 0 29307 0 --:-- --:-- --:-- 29307admin@docker-host:~/example-orchestrations$ ls -lrttotal 12-rw-r--r-- 1 admin admin 11342 Dec 8 07:09 docker-compose.yamladmin@docker-host:~/example-orchestrations$ mkdir -p ./dags ./logs ./plugins ./configadmin@docker-host:~/example-orchestrations$ echo -e "AIRFLOW_UID=${id -u}" > .env
After configuring your environment, open the Docker Compose YAML file to review Airflow’s settings. This file details the Airflow image, its environment variables, and services like Redis and Postgres.
Key components include setting the executor type, defining database connections, and mapping volumes for DAGs, logs, plugins, and configuration.
Additional services such as Redis, the Airflow web server, scheduler, and worker are defined similarly. For example, the Redis service is configured as follows:
After reviewing the configuration, initialize Airflow with the following commands:
admin@docker-host:~$ cd example-orchestration/admin@docker-host:~/example-orchestration$ ls -lrttotal 12-rw-rw-r-- 1 admin admin 11342 Dec 8 07:09 docker-compose.yamladmin@docker-host:~/example-orchestration$ mkdir -p ./dags ./logs ./plugins ./configadmin@docker-host:~/example-orchestration$ echo -e "AIRFLOW_UID=${id -u}" > .envadmin@docker-host:~/example-orchestration$ vim docker-compose.yamladmin@docker-host:~/example-orchestration$ docker compose up airflow-init
During initialization, Airflow downloads the necessary images and sets up database tables and user permissions. A successful initialization is indicated by a zero exit code in the logs.Once initialization is complete, start all containers:
admin@docker-host:~/example-orchestration$ docker compose up
You’ll observe that containers for Redis, Postgres, airflow-init, airflow-scheduler, airflow-webserver, airflow-worker, and airflow-triggerer are created and started. The appearance of the Airflow logo in the logs confirms that the service is running.
After starting the containers (which might take 5–10 minutes), open your browser and navigate to http://localhost:8081. You will see the Airflow web interface.Log in using the credentials:
Username: Airflow
Password: Airflow
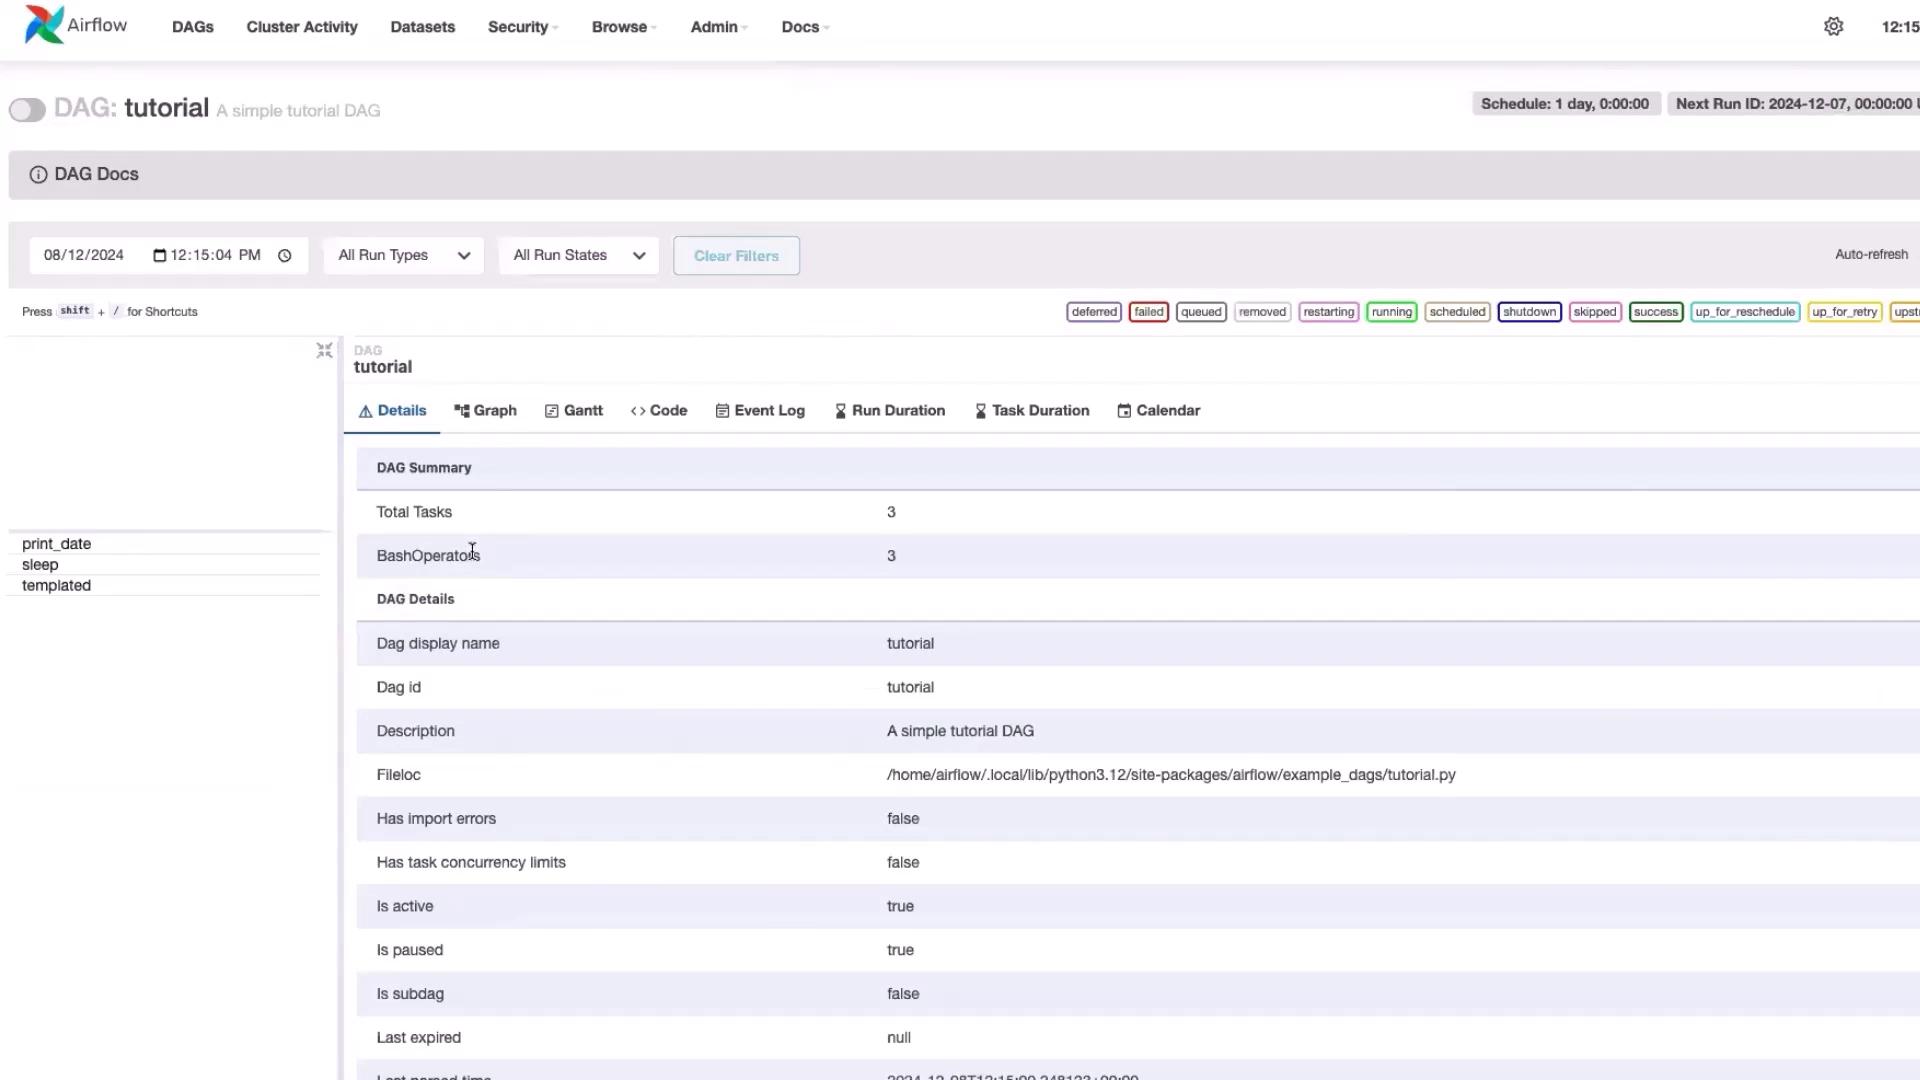
In the UI, you’ll find a list of DAGs (ETL workflows). Most example DAGs are initially paused; simply toggle them to activate. For example, the interface may display a tutorial DAG along with associated code details.
Clicking a DAG’s code button reveals its underlying implementation, offering further insights into the orchestration process.
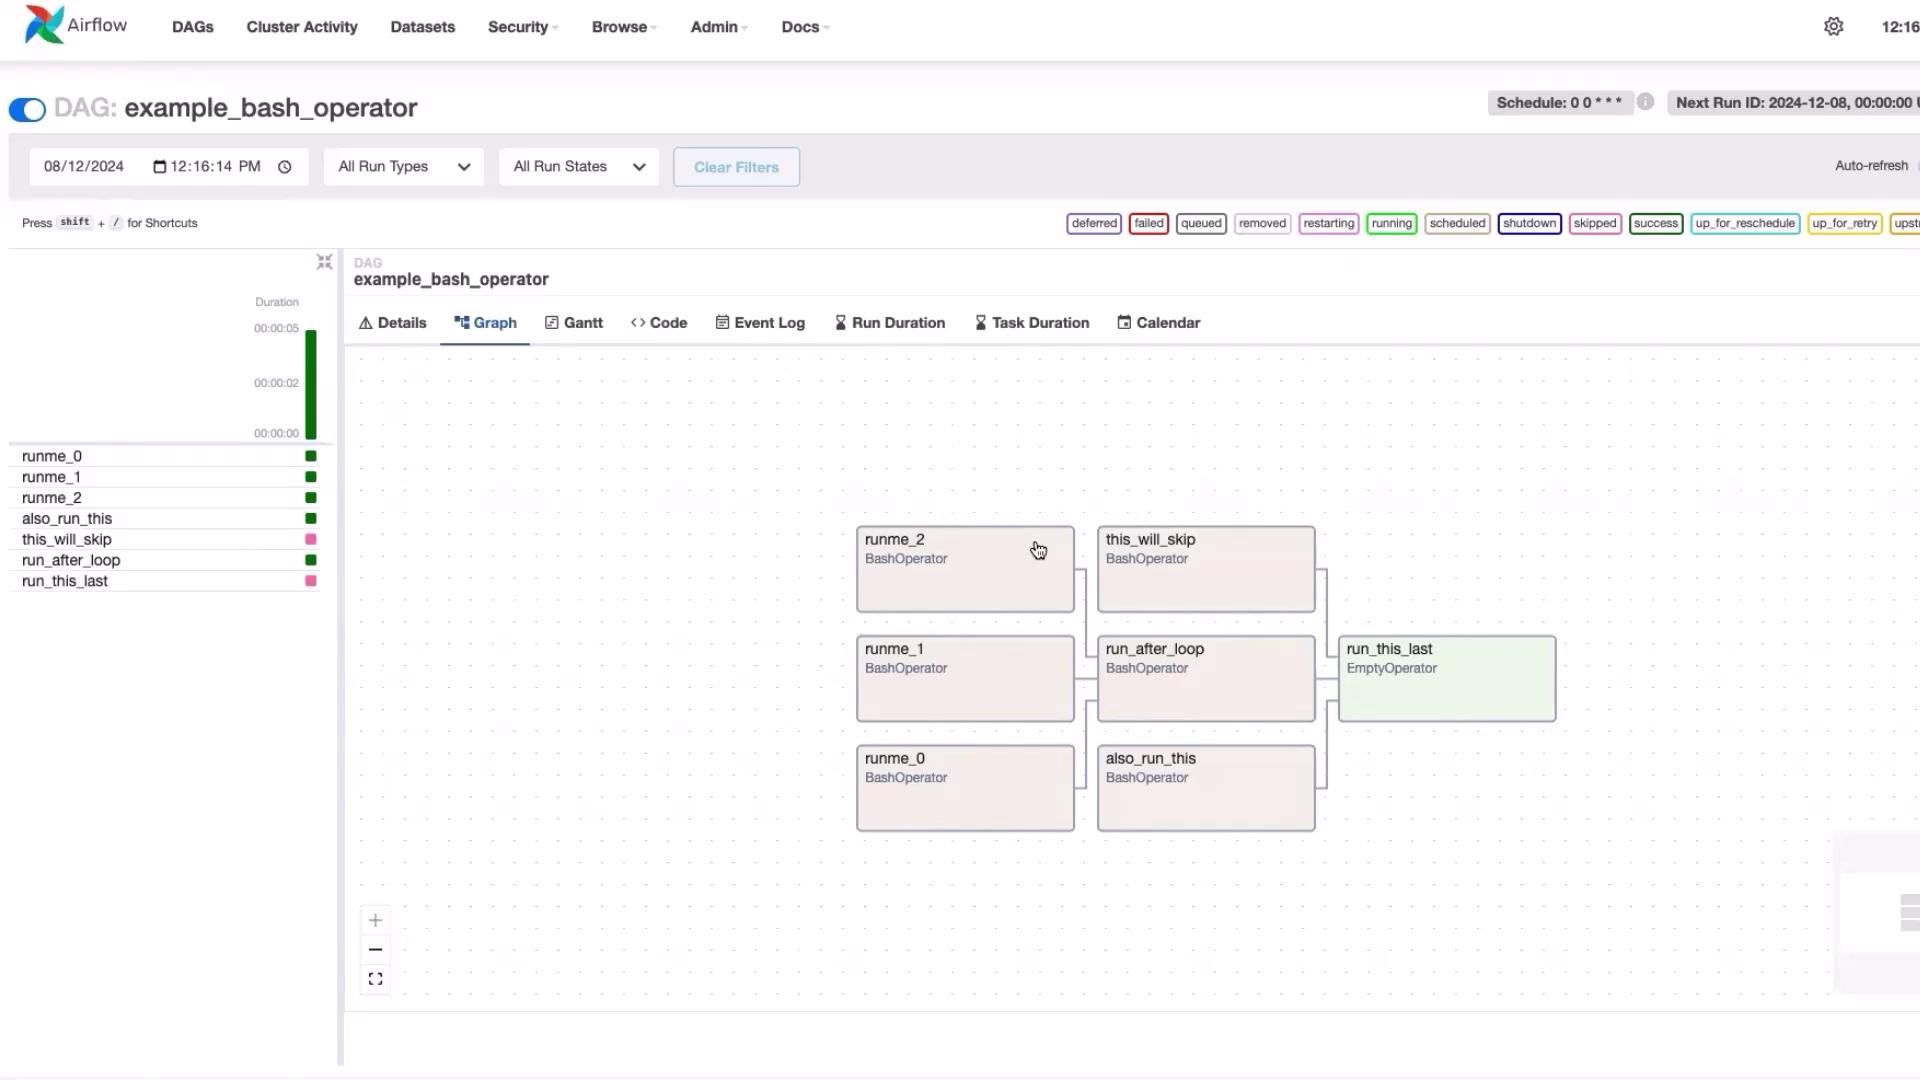
The following example demonstrates how to use the BashOperator to run Linux commands as part of an ETL workflow. This DAG, titled “example_bash_operator,” schedules tasks using a cron expression and utilizes dummy tasks to represent workflow steps.
Switch to the “Graph” view in the Airflow UI to visually inspect the DAG execution. Each box in the graph represents an individual task and the arrows depict task dependencies. Checking individual task logs can help diagnose any issues during execution.
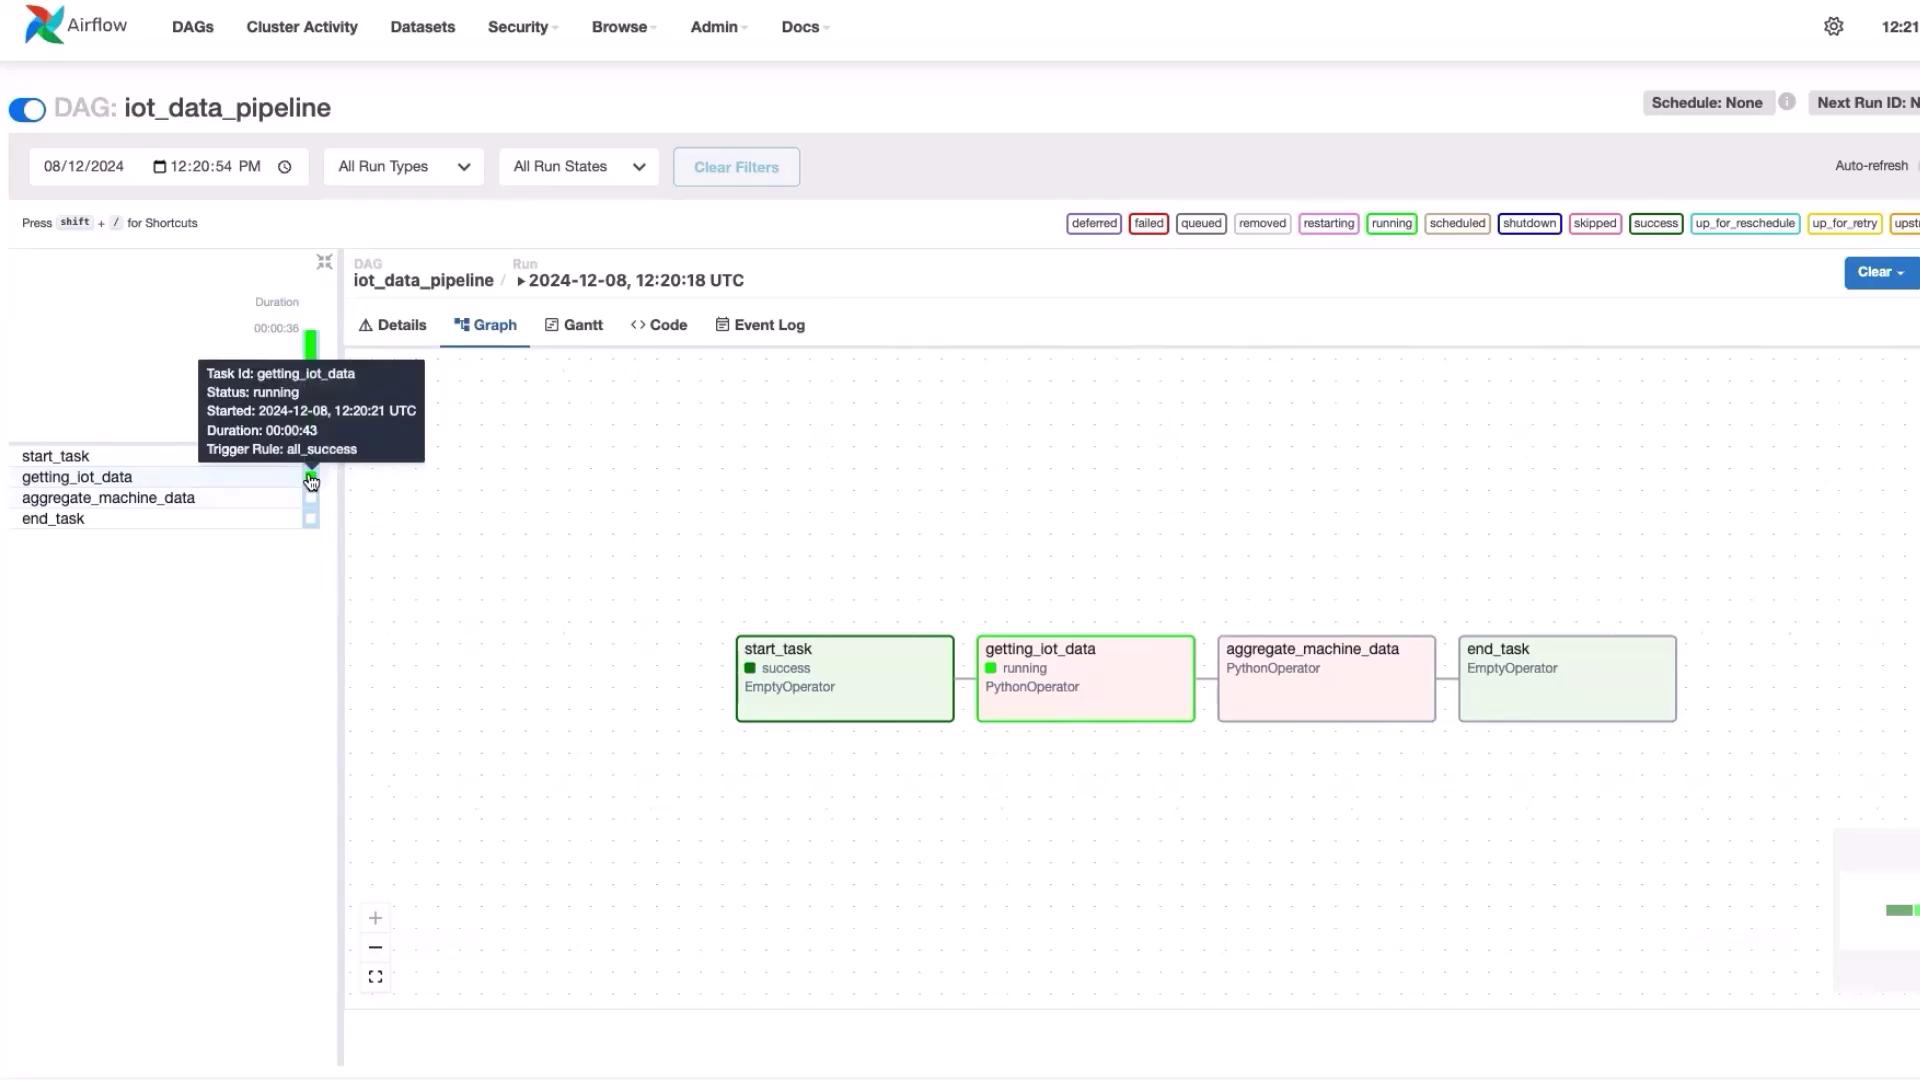
The DAG executes the following tasks sequentially:
start_task: Indicates the workflow start.
getting_iot_data: Generates simulated IoT data.
aggregate_machine_data: Aggregates the collected data.
send_email: (Optional) Sends an email with the aggregated results.
end_task: Marks the end of the pipeline.
Monitor the current state of each task (running, success, or failure) via the real-time UI. For detailed insights, click on a running task (e.g., “getting_iot_data”) and check the logs.
After execution, the aggregated data might show, for example, 38 instances of “0” and 22 instances of “1”. In real-world applications, these counts could represent metrics such as successful operations versus machine errors, thereby aiding maintenance engineers in troubleshooting issues.
This pipeline can be extended to write data to databases or data lakes, depending on your application needs.
This lesson demonstrated how Apache Airflow simplifies the scheduling and orchestration of complex ETL workflows, replacing multiple cron jobs with a single, manageable system. With Airflow, you can efficiently set up pipelines to collect, process, and analyze data from IoT devices with minimal effort.Thank you for following along, and happy orchestrating!For more detailed information on Apache Airflow and data orchestration, consider visiting the Apache Airflow Documentation.