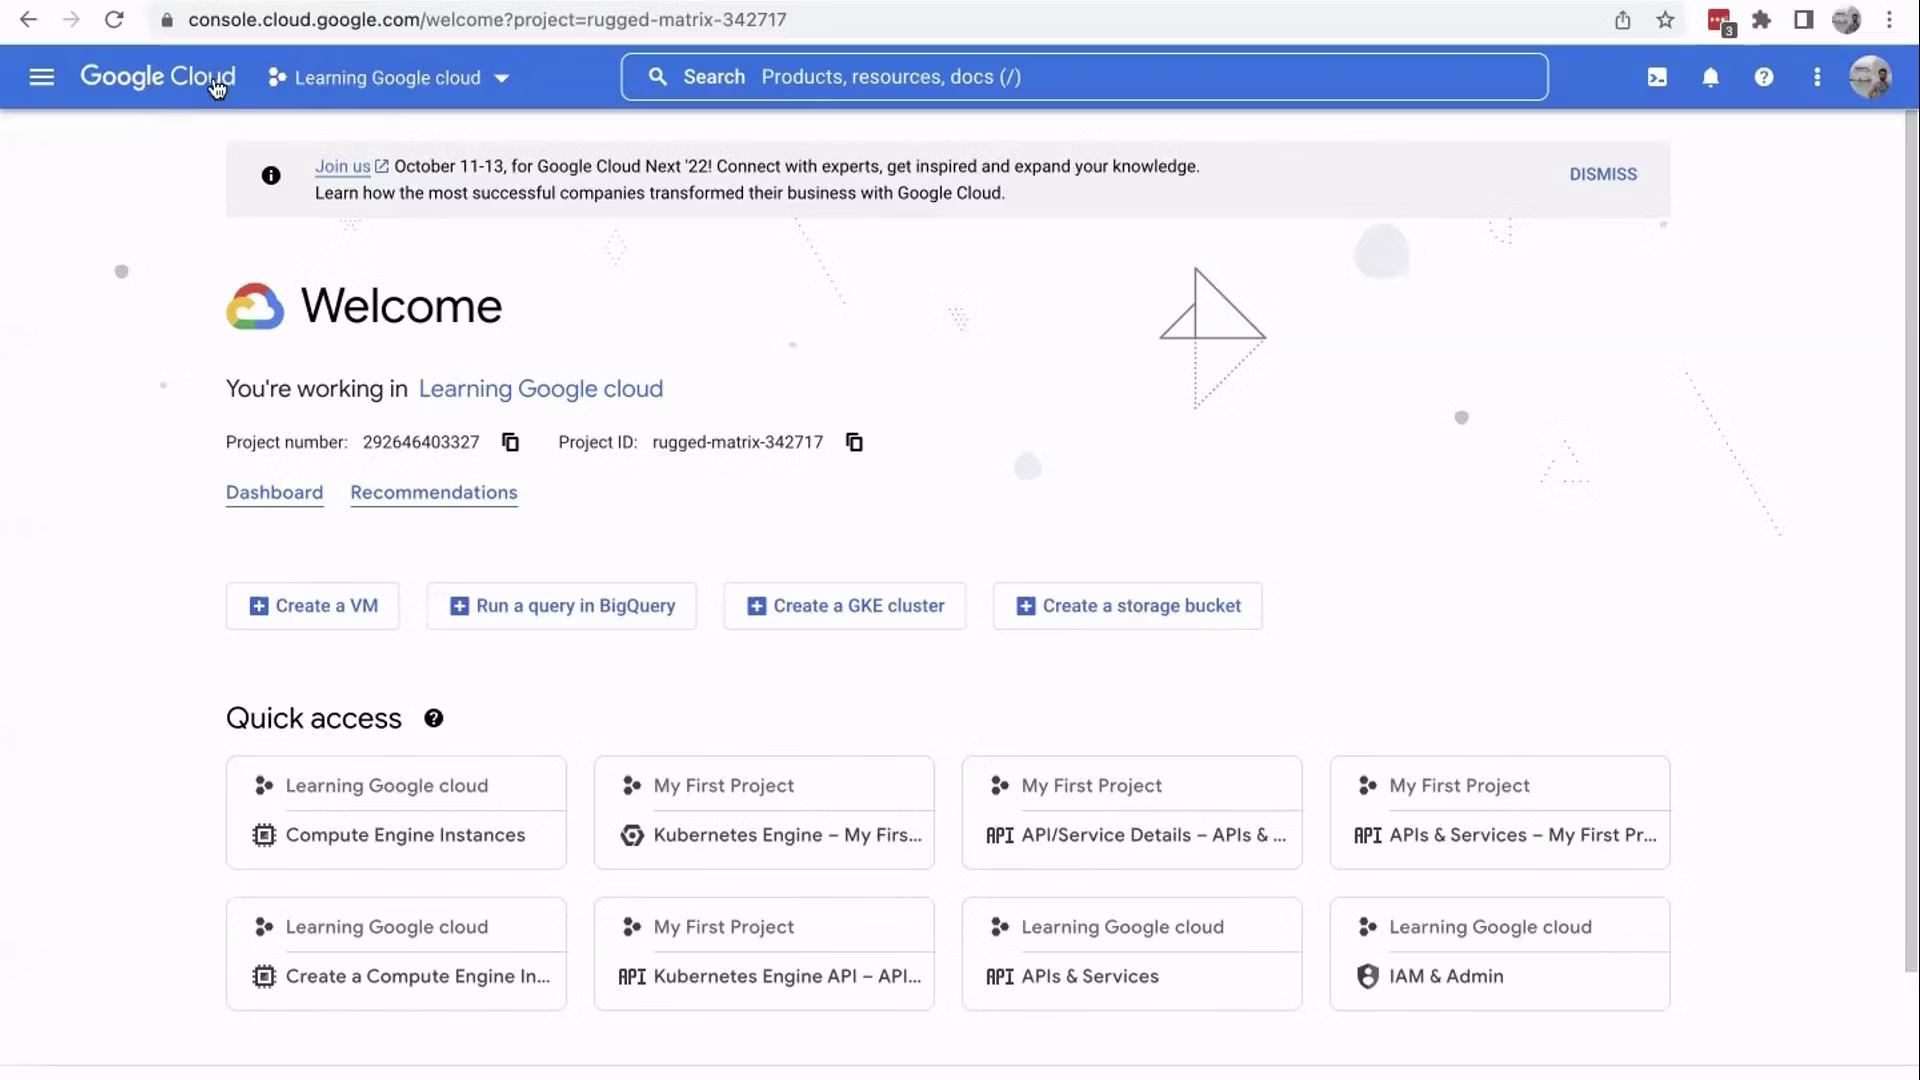
- Project ID: a user-assigned, globally unique string used in APIs and resource names.
- Project number: a system-assigned numeric identifier used internally by GCP and in some support scenarios.
Project ID is a user-assigned, globally unique string identifier (used in APIs and resource names). Project number is a system-assigned numeric identifier that is also unique and is used internally by GCP. Keep both handy when configuring services or opening support requests.
- Quick search: find GCP resources, Console pages, or documentation.
- Cloud Shell (terminal icon): launches an in-browser shell with gcloud and Linux tools. When active, a small terminal appears at the bottom of the Console.
- Notifications (bell icon): view recent events and messages about your account and resources.
- Project-level controls and quick actions near the right side of the header.
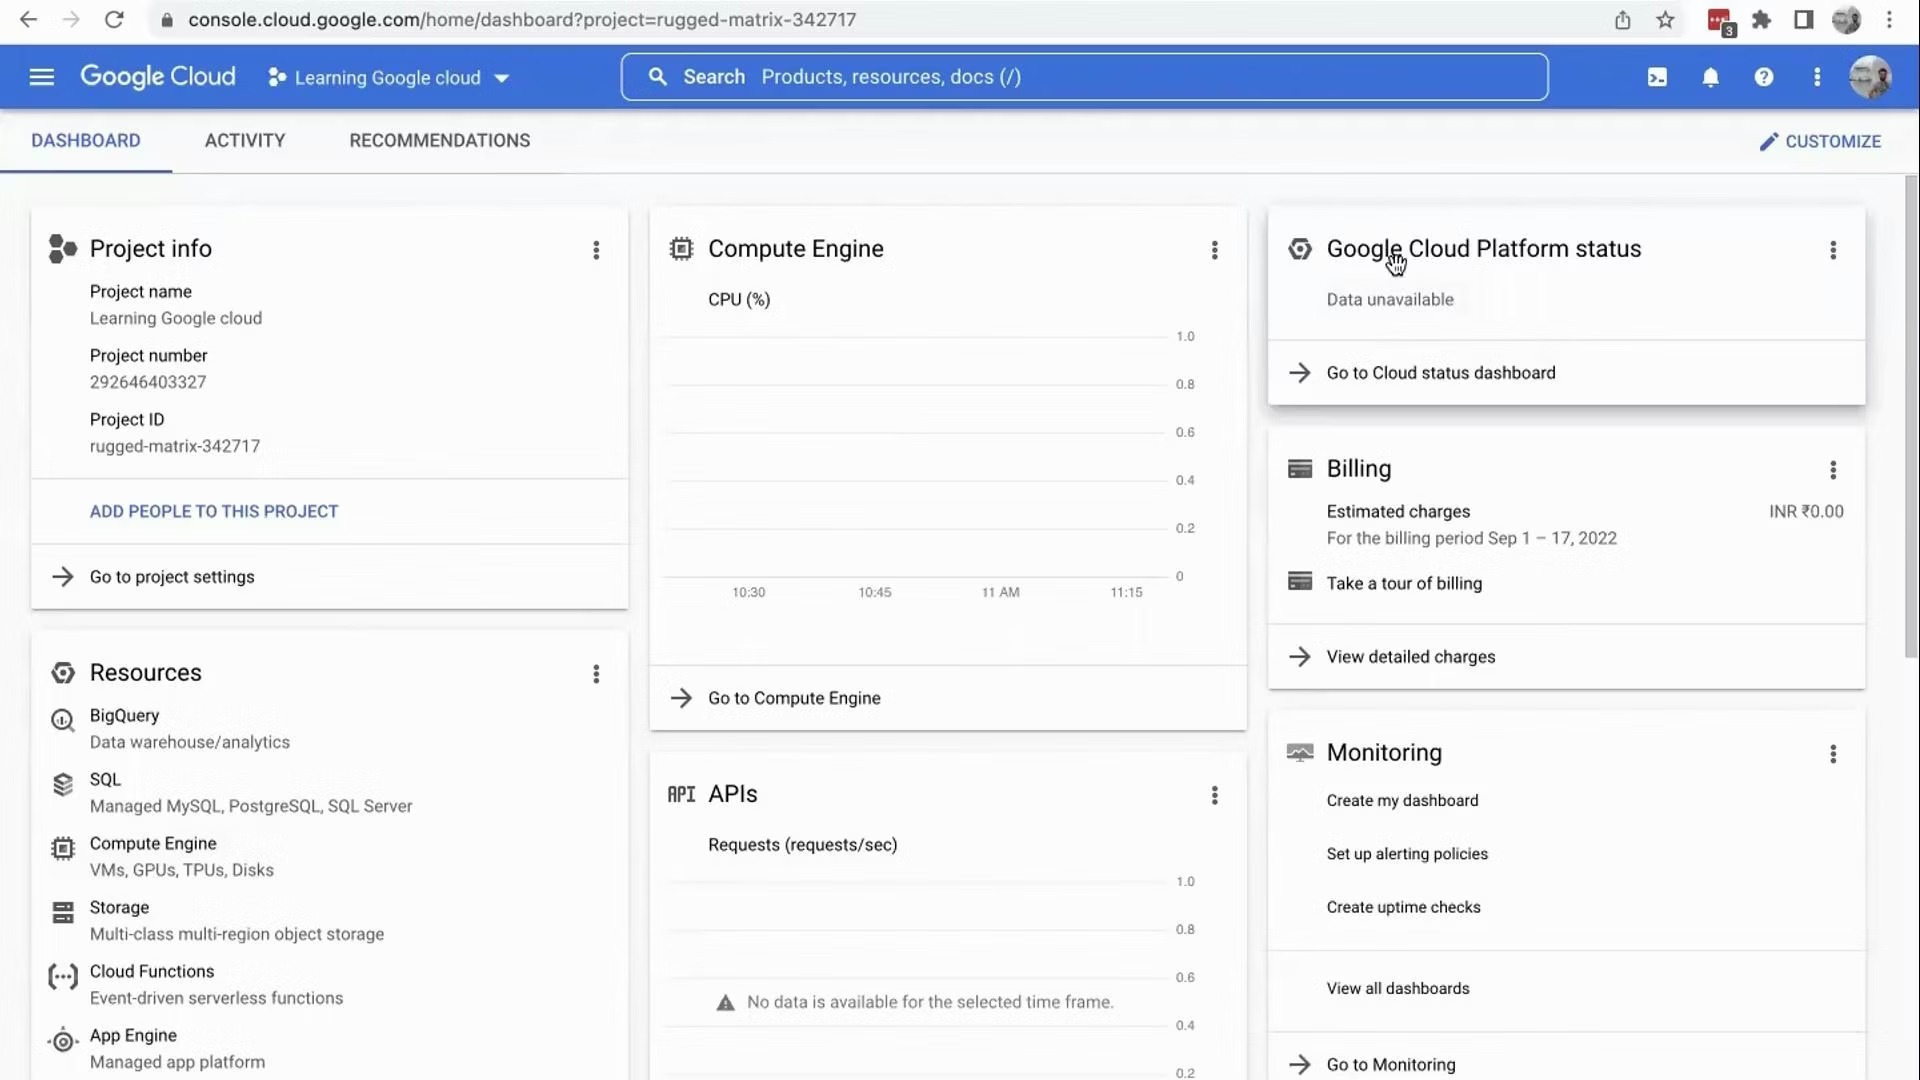
| Panel | Purpose | Typical actions |
|---|---|---|
| Project details | Name, project ID, project number | Copy IDs for CLI/API use |
| Resource summaries | Recently used services and top resources | Jump to specific services (Compute, Storage, BigQuery) |
| Compute Engine | VM status and quick-create links | Create, stop, or connect to VMs |
| Billing overview | Spend, alerts, and billing account links | Review charges and set budgets/alerts |
| Monitoring | Uptime checks and metric charts | Open Cloud Monitoring dashboards |
| Cloud Platform status | Service incidents and outages | Check current platform health |
- Activity: lists who performed which actions in the Console—useful for operational auditing and troubleshooting.
- Recommendations: GCP analyzes your resources and suggests improvements (security, cost optimization, performance).
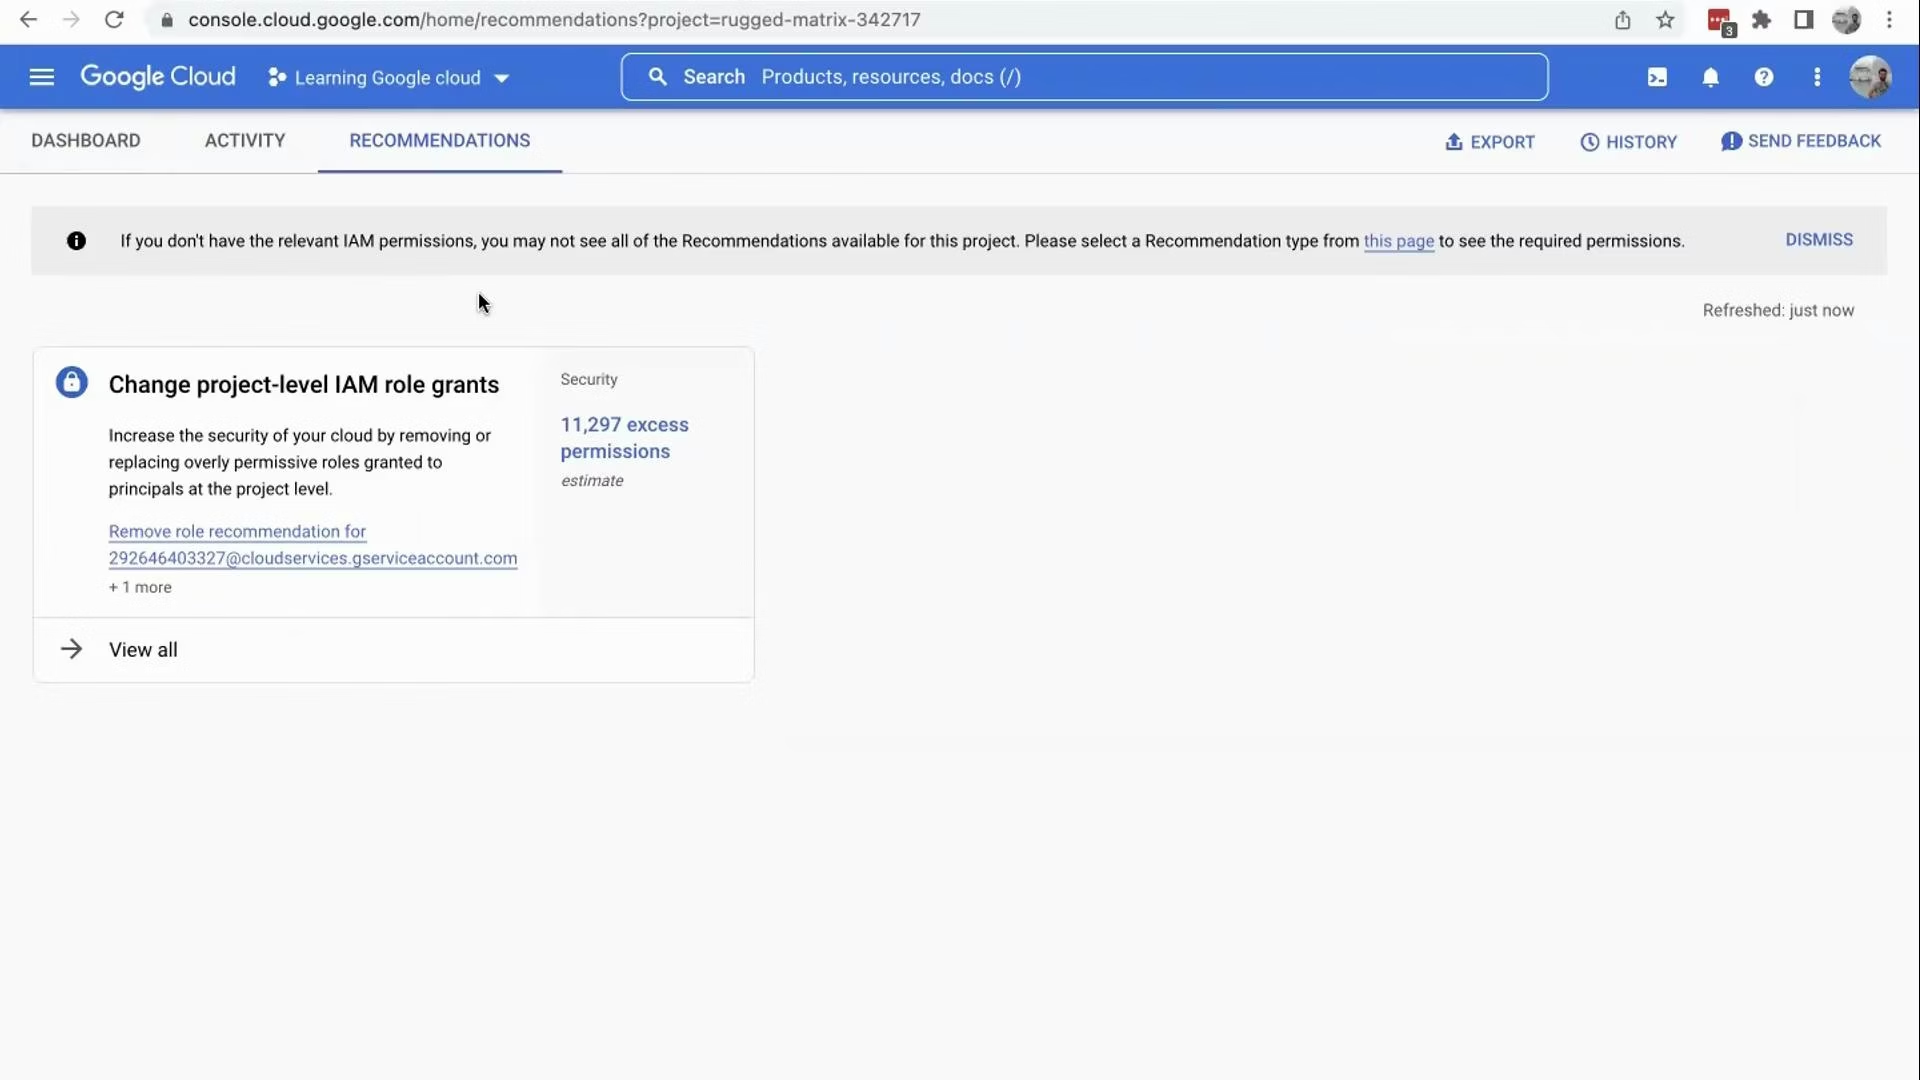
- Typical suggestions include reducing overly broad IAM role grants (excess permissions) or rightsizing compute resources to save costs.
- Treat recommendations as starting points—review the details and test changes in a non-production environment before applying them at scale.
- GCP Console documentation: https://cloud.google.com/docs/overview
- Managing projects and resources: https://cloud.google.com/resource-manager/docs/overview
- Cloud Shell: https://cloud.google.com/shell/docs
- Recommendations and optimization: https://cloud.google.com/recommender/docs