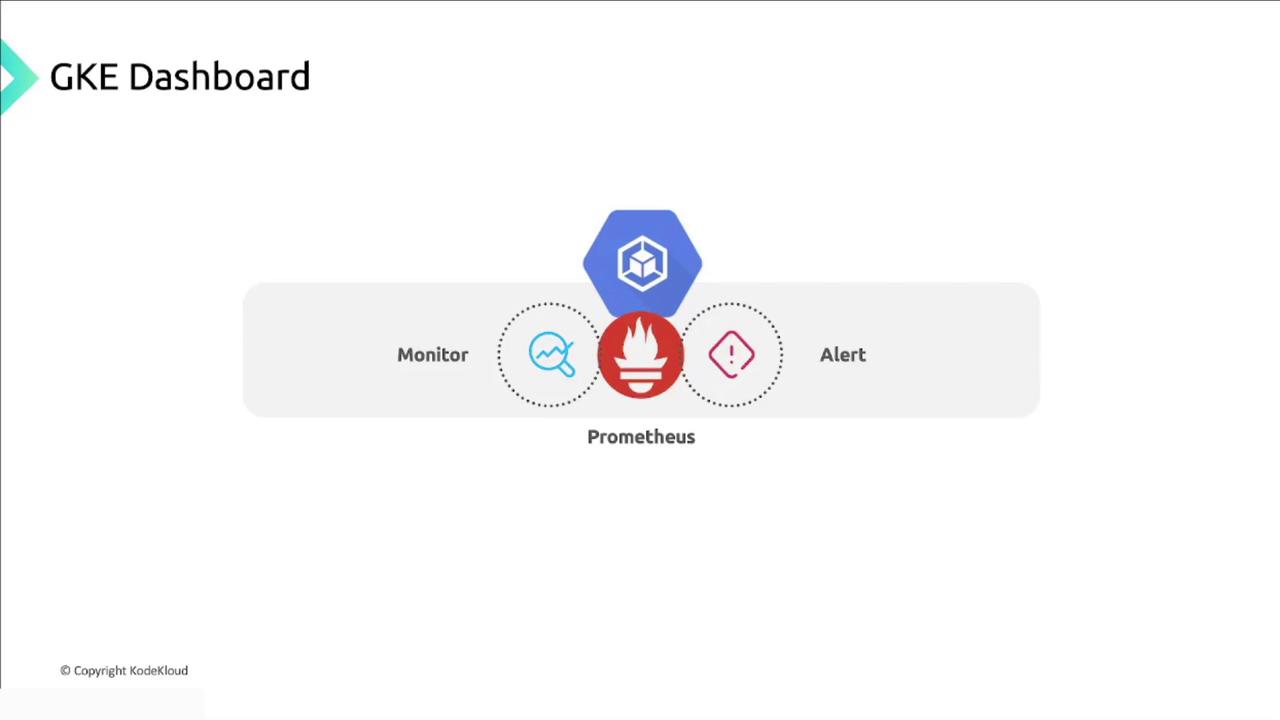
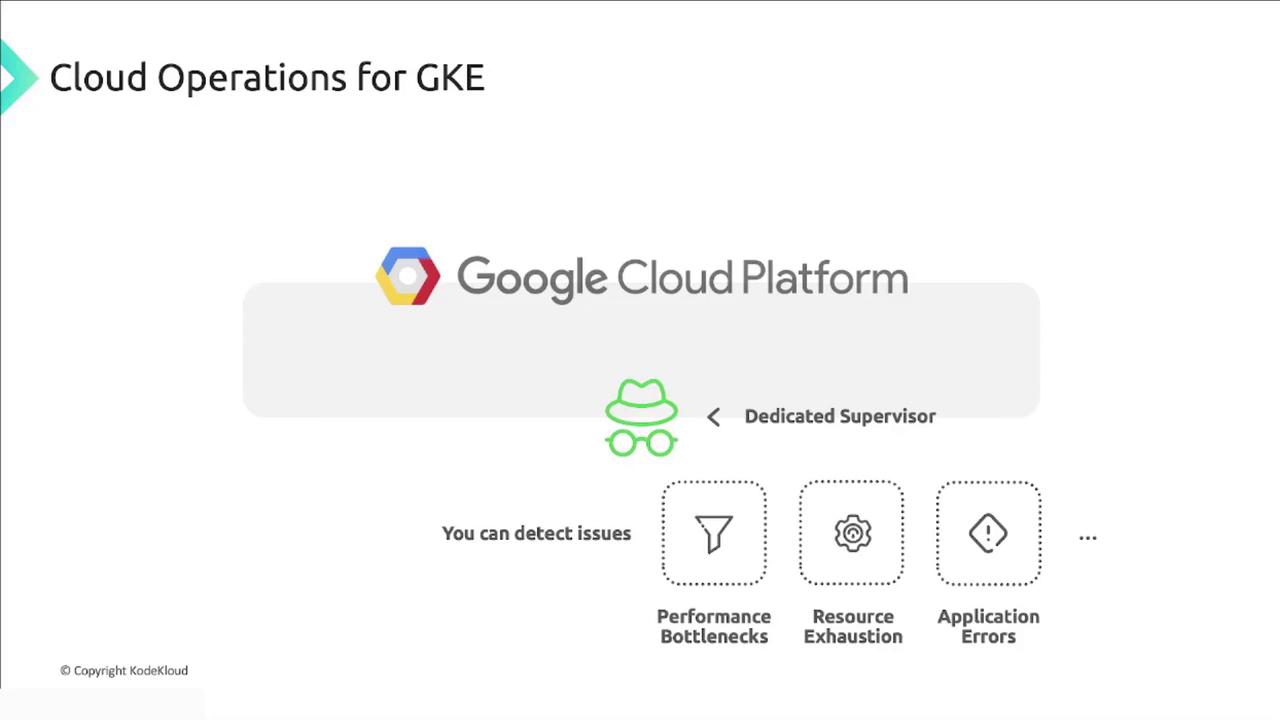
Monitoring: Your Dedicated Supervisor
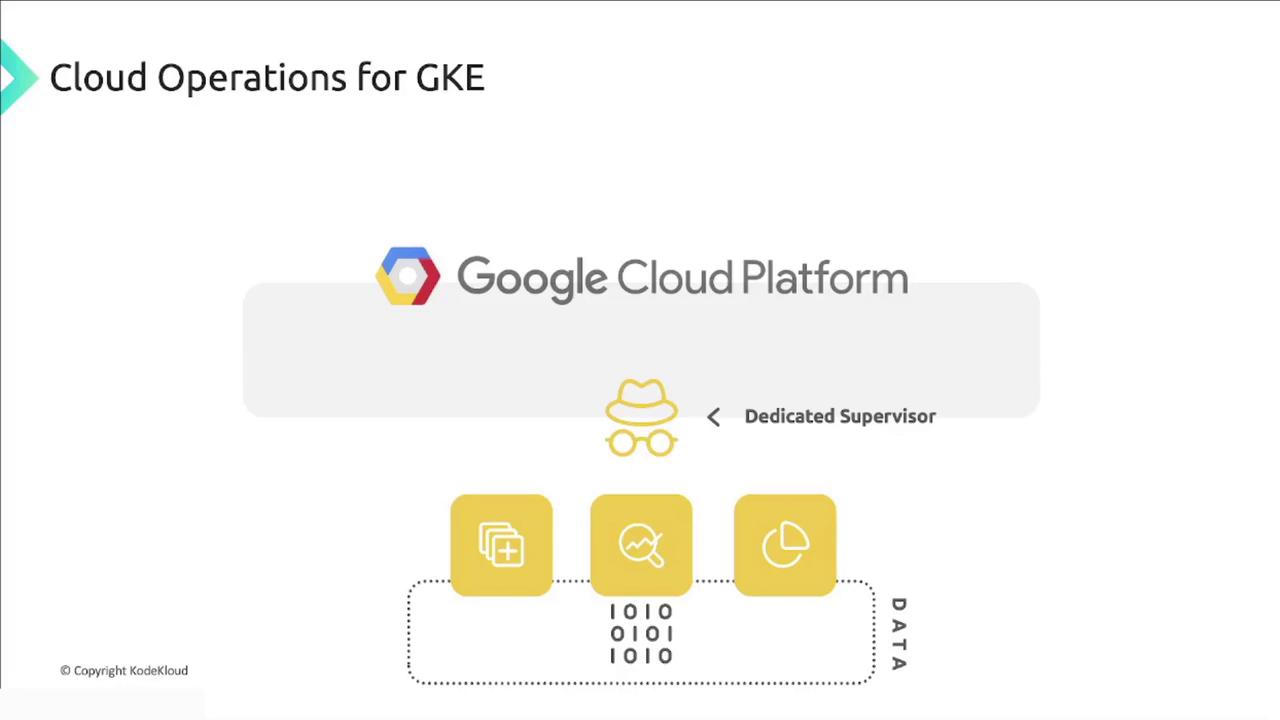
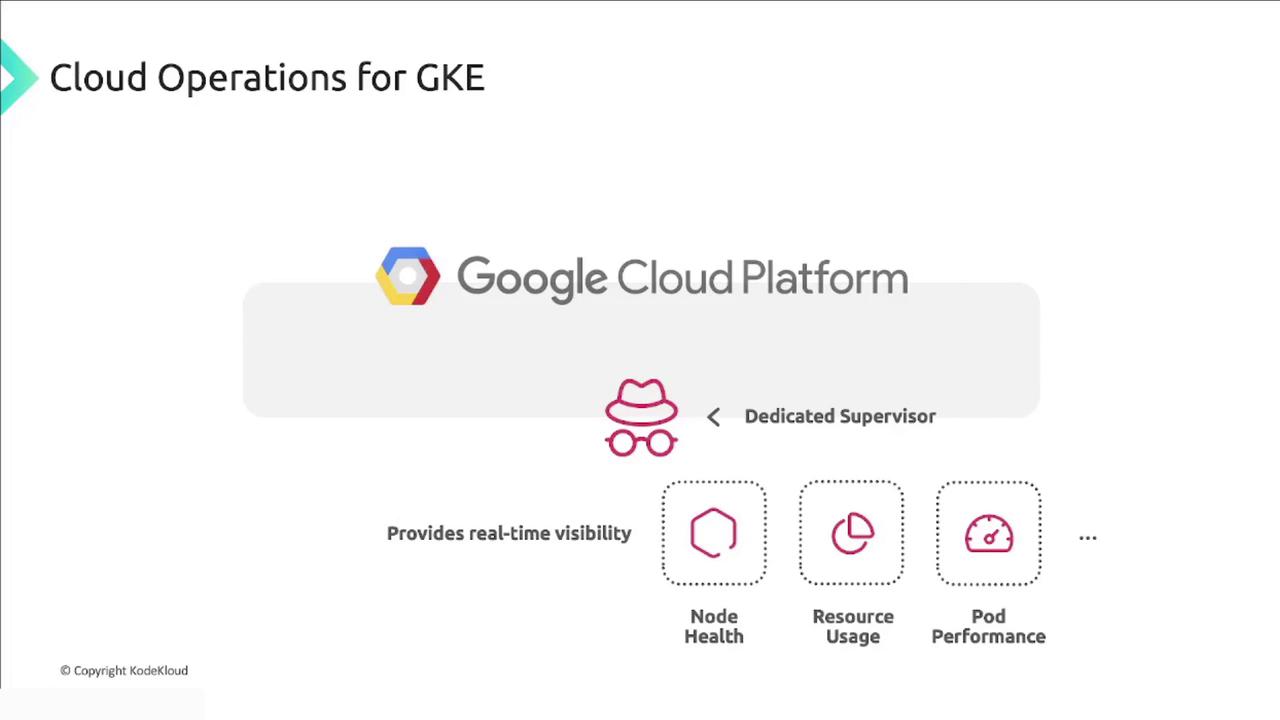
Monitoring in Cloud Operations Suite for GKE is like having a dedicated supervisor on-site. It collects, analyzes, and visualizes data about your cluster’s performance, health, and resource usage. With real-time visibility, you can spot anomalies or potential problems before they escalate.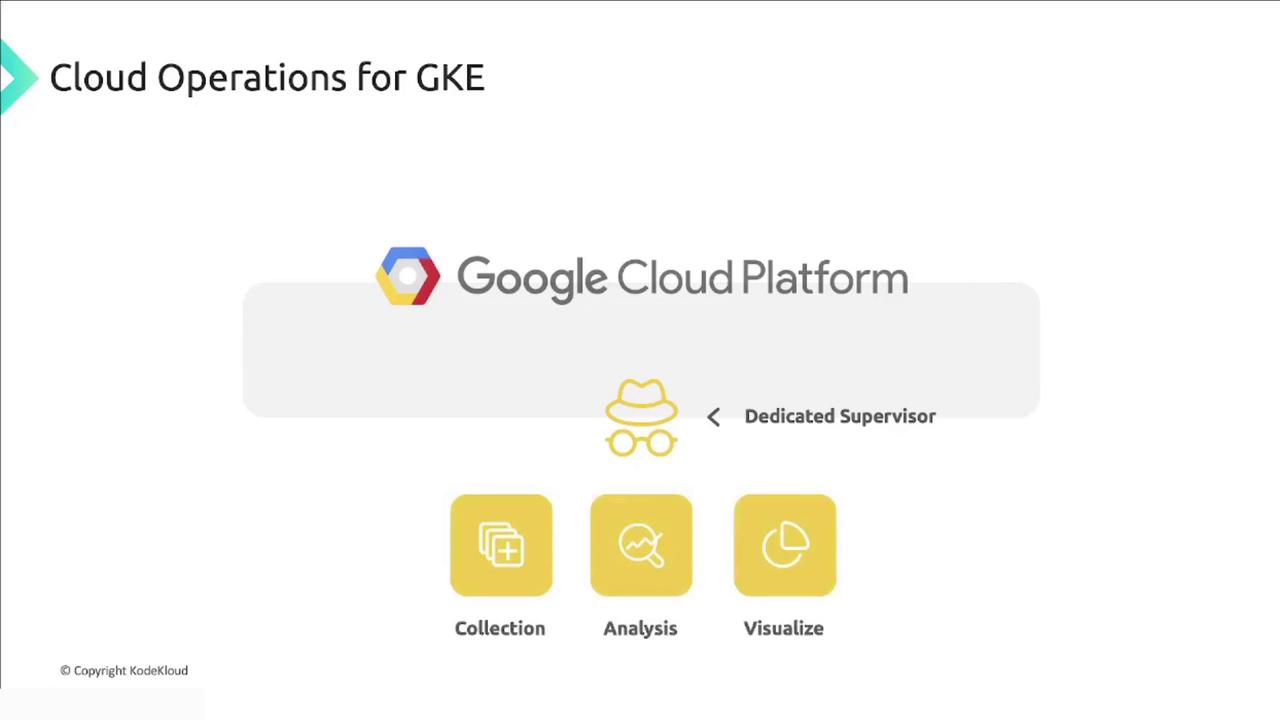
- CPU and memory utilization
- Network traffic (ingress/egress)
- Application-level statistics (request rates, error rates)
- Node health and resource pressure
- Pod performance and status
- Network connectivity and latency
Logging: Your Detailed Record
Logging acts like a comprehensive site logbook—capturing every event, error, and warning generated by your GKE cluster, containers, applications, and services. These logs form a chronological record essential for troubleshooting, auditing, and understanding system behavior.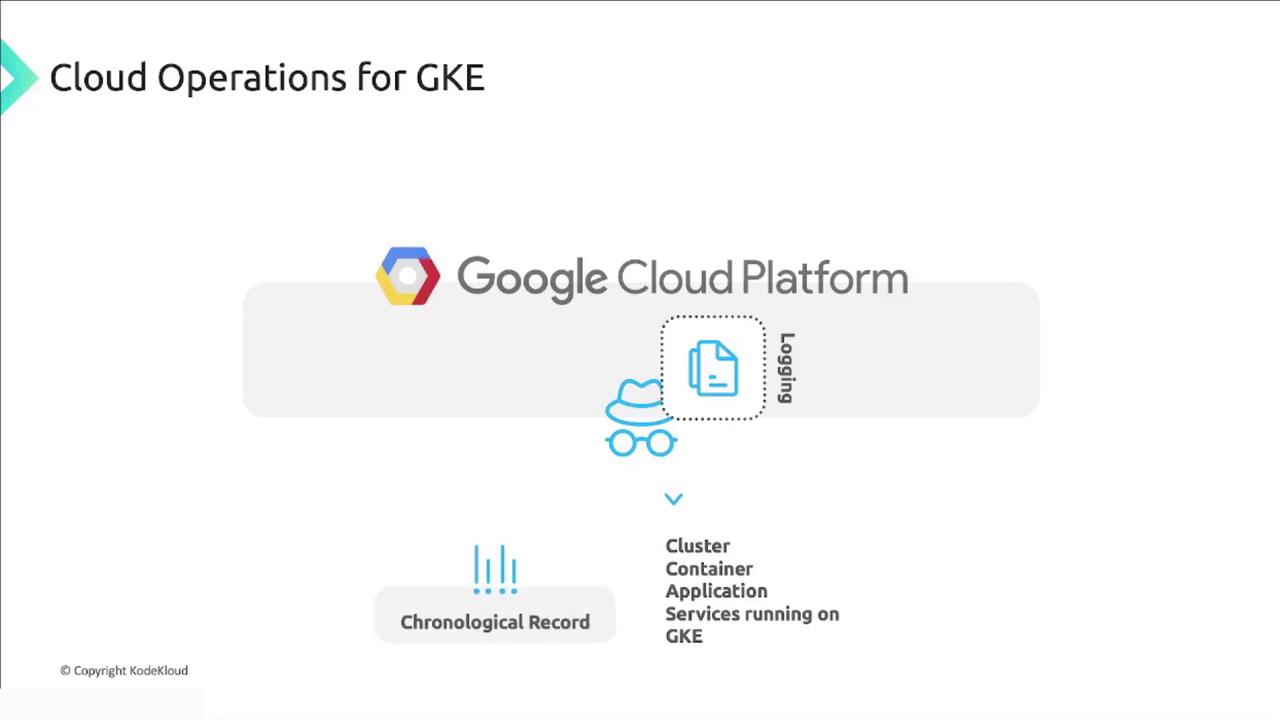
- Trace request flows across microservices
- Pinpoint root causes during incidents
- Audit changes and security events
Leverage log-based metrics to create custom dashboards and alerts for application-specific events.
Seamless Integrations and Defaults
When you provision a new GKE cluster on Google Cloud, Cloud Monitoring and Cloud Logging are enabled by default—providing Kubernetes-native observability out of the box. You can fine-tune which logs and metrics are ingested, ensuring you capture only what you need.High log and metric retention can increase costs. Use log exclusions and metric filters to manage your budget.
| Integration | Purpose | Benefit |
|---|---|---|
| Cloud Monitoring | Collects cluster & pod metrics | Real-time dashboards and alerting |
| Cloud Logging | Aggregates logs from all sources | Centralized search, analysis, and archive |
| Managed Service for Prometheus | Ingests Prometheus metrics | Scalable monitoring without self-hosted servers |