Use this file to discover all available pages before exploring further.
In this guide, you will learn how to raise ArgoCD alerts and view them in Alertmanager. Previously, we deployed a Kubernetes monitoring stack that included Alertmanager. In this tutorial, we will update Alertmanager to use a NodePort service and add a custom Prometheus alert based on ArgoCD metrics.Follow this step-by-step procedure to configure and validate your alerts.
First, update the Alertmanager service so that it exposes a NodePort. In this example, the NodePort for Alertmanager is set to 32501.To modify the Alertmanager service, run:
k -n monitoring edit svc my-kube-prometheus-stack-alertmanager
After saving the changes, you should see confirmation similar to:
Now, review the existing Prometheus alert rules to identify if there are any rules related to ArgoCD. Open the Prometheus UI and navigate to the rules tab. While you will see several rules like AlertmanagerFailedReload, AlertmanagerMembersInconsistent, and AlertmanagerFailedToSendAlerts, none are specifically configured for ArgoCD.For instance, an existing set of rules appears as follows:
alert: AlertmanagerFailedReloadexpr: max_over_time(alertmanager_config_last_reload_successful{job="my-kube-prometheus-stack-alertmanager", namespace="monitoring"}[5m]) == 0for: 10mlabels: severity: criticalannotations: description: Configuration has failed to load for {{ $labels.namespace }}{{ $labels.pod }}. runbook_url: https://runbooks.prometheus-operator.dev/runbooks/alertmanager/alertmanagerfailedreload summary: Reloading an Alertmanager configuration has failed.alert: AlertmanagerMembersInconsistentexpr: max_over_time(alertmanager_cluster_members{job="my-kube-prometheus-stack-alertmanager", namespace="monitoring"}[5m]) < on(namespace, service) group_left() count by(namespace, service) (max_over_time(alertmanager_cluster_members{job="my-kube-prometheus-stack-alertmanager", namespace="monitoring"}[5m]))for: 15mlabels: severity: criticalannotations: description: Alertmanager {{ $labels.namespace }}{{ $labels.pod }} has only found {{ $value }} members of the {{ $labels.job }} cluster. runbook_url: https://runbooks.prometheus-operator.dev/runbooks/alertmanager/alertmanagermembersinconsistent summary: A member of an Alertmanager cluster has not found all other cluster members.alert: AlertmanagerFailedToSendAlertsexpr: (rate(alertmanager_notifications_failed_total{job="my-kube-prometheus-stack-alertmanager", namespace="monitoring"}[5m]) > 0.01)for: 5mlabels: severity: warning
Since there is no specific rule for ArgoCD, we will add a custom alert rule next.
Add a custom alert that triggers when an ArgoCD application is out of sync. This alert uses the Prometheus metric argocd_app_info (assumed to be available) to check if the sync status is “OutOfSync.” If this condition persists for one minute, the alert is raised with a warning severity.To add the new alert rule, edit the Prometheus rules in the monitoring namespace:
k -n monitoring edit prometheusrule my-kube-prometheus-stack-alertmanager.rules
Append the following configuration at the end of the file:
- alert: AlertmanagerClusterCrashlooping annotations: description: '{{ $value | humanizePercentage }} of Alertmanager instances within the {{ $labels.job }} cluster have restarted at least 5 times in the last 10m.' runbook_url: https://runbooks.prometheus-operator.dev/runbooks/alertmanager/alertmanagerclustercrashlooping expr: | ( count by (namespace, service) ( changes(process_start_time_seconds{job="my-kube-prometheus-stack-alertmanager", namespace="monitoring"}[10m]) ) ) / count by (namespace, service) ( up{job="my-kube-prometheus-stack-alertmanager", namespace="monitoring"} ) > 0.5 for: 5m labels: severity: critical- alert: ArgoApplicationOutOfSync expr: argocd_app_info{sync_status="OutOfSync"} == 1 for: 1m labels: severity: warning annotations: summary: "'{{ $labels.name }}' Application has synchronization issue"
When you save your changes, the Prometheus operator will update the configuration to include these new rules.To verify the update, run:
k -n monitoring get prometheusrules my-kube-prometheus-stack-alertmanager.rules -o yaml | grep -i argocd
If needed, you can edit the 'prometheusrule' again:
k -n monitoring edit prometheusrule my-kube-prometheus-stack-alertmanager.rules
After updating the rules, check the Prometheus UI to confirm that the new ArgoCD alert appears alongside other Alertmanager rules. The rule for ArgoApplicationOutOfSync should be visible similar to the examples below:
alert: AlertmanagerFailedReloadexpr: max_over_time(alertmanager_config_last_reload_successful{job="my-kube-prometheus-stack-alertmanager", namespace="monitoring"}[5m]) == 0for: 10mlabels: severity: criticalannotations: description: Configuration has failed to load for {{ $labels.namespace }}{{ $labels.pod }}. runbook_url: https://runbooks.prometheus-operator.dev/runbooks/alertmanager/alertmanagerfailedreload summary: Reloading an Alertmanager configuration has failed.---alert: AlertmanagerMembersInconsistentexpr: max_over_time(alertmanager_cluster_members{job="my-kube-prometheus-stack-alertmanager", namespace="monitoring"}[5m]) < on(namespace, service) group_left() count by(namespace, service) (max_over_time(alertmanager_cluster_members{job="my-kube-prometheus-stack-alertmanager", namespace="monitoring"}[5m]))for: 15mlabels: severity: criticalannotations: description: Alertmanager {{ $labels.namespace }}{{ $labels.pod }} has only found {{ $value }} members of the {{ $labels.job }} cluster. runbook_url: https://runbooks.prometheus-operator.dev/runbooks/alertmanager/alertmanagermembersinconsistent summary: A member of an Alertmanager cluster has not found all other cluster members.---alert: AlertmanagerFailedToSendAlertsexpr: (rate(alertmanager_notifications_failed_total{job="my-kube-prometheus-stack-alertmanager", namespace="monitoring"}[5m]) > 0.01)for: 5mlabels: severity: warningannotations: summary: Alertmanager is failing to send alerts.---alert: ArgoApplicationOutOfSyncexpr: argocd_app_info{sync_status="OutOfSync"} == 1for: 1mlabels: severity: warningannotations: summary: "'{{ $labels.name }}' Application has synchronization issue"
Step 5: Test the Alert by Simulating an Out-of-Sync Application
To trigger the new alert, simulate an ArgoCD application going out of sync. For example, modify the replica count in a deployment definition. The following is an example for a deployment named “solar-system”:
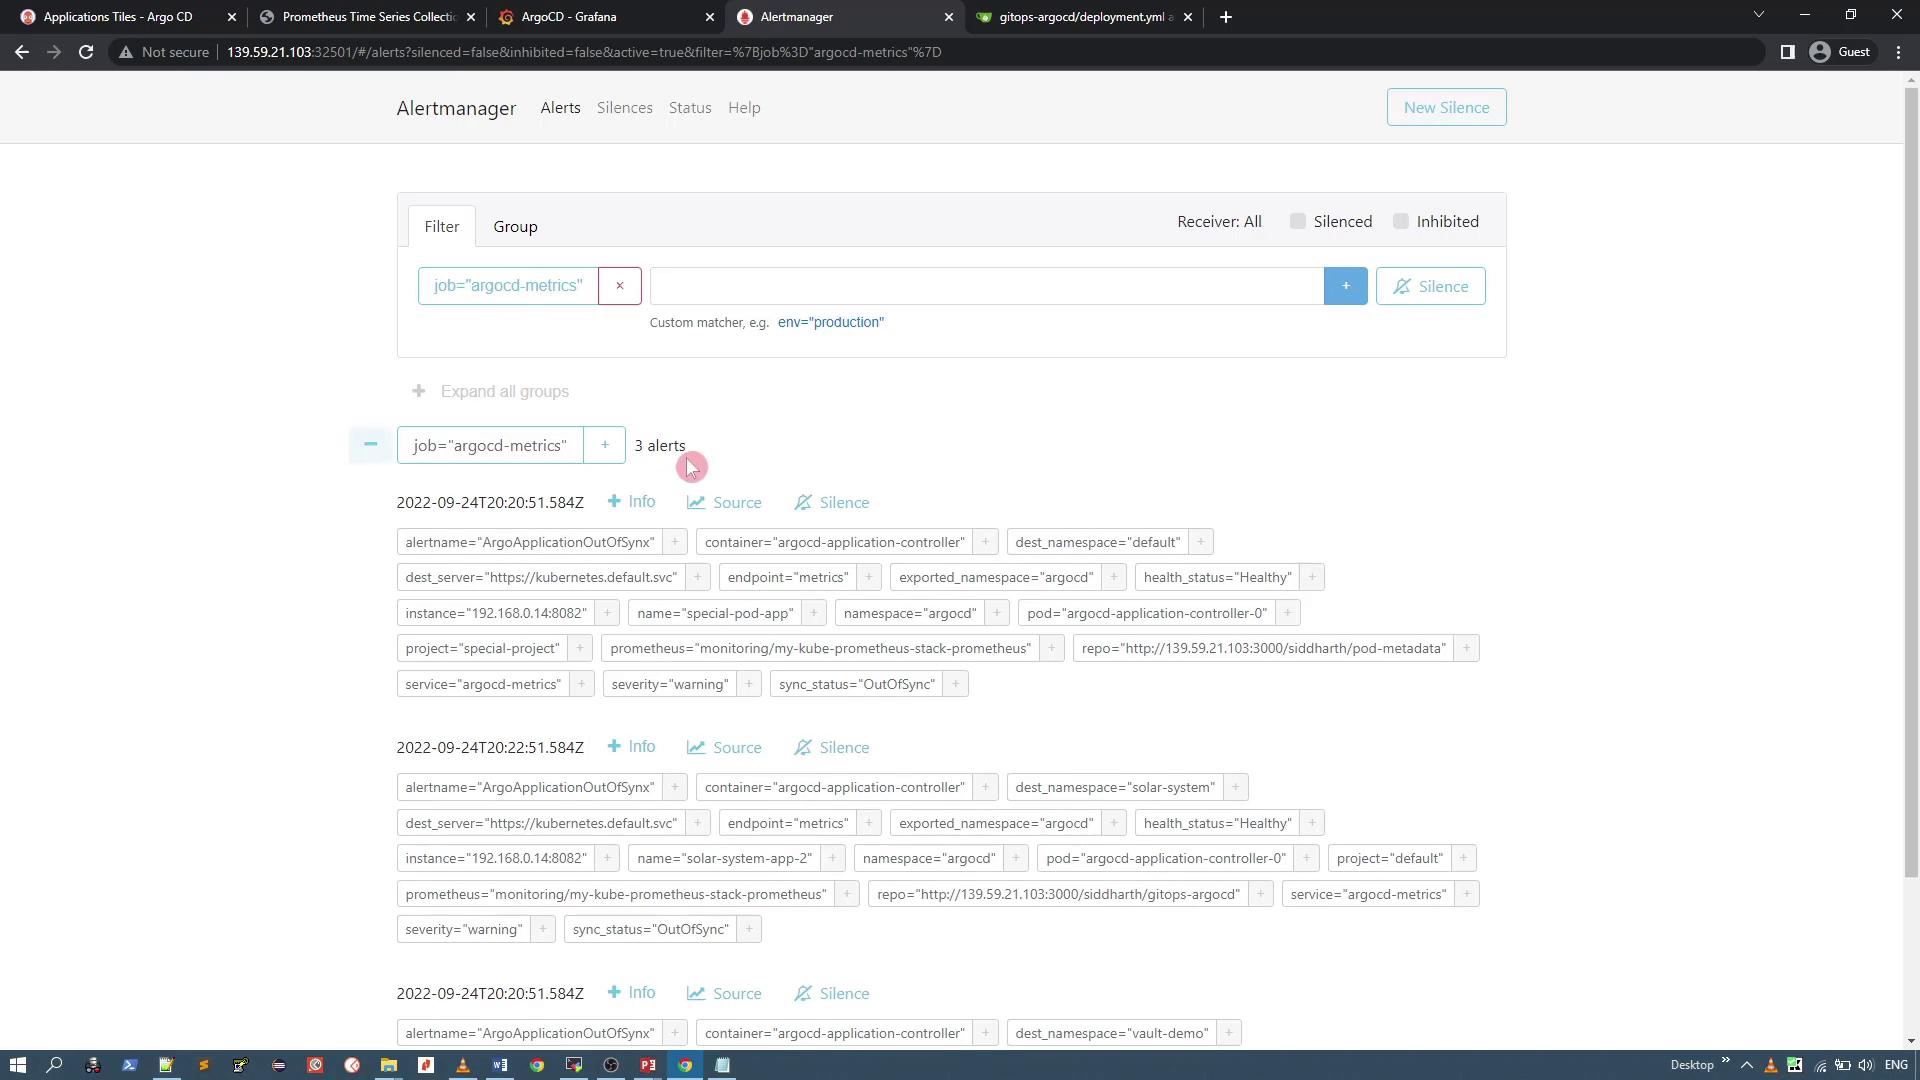
After applying this change, the application status will change to “OutOfSync” and the ArgoApplicationOutOfSync alert should trigger within one minute.Refresh the Alertmanager UI to view the generated alerts. You should see alerts for all out-of-sync ArgoCD applications. For example, the interface might display multiple alerts related to your ArgoCD applications.
This confirms that your ArgoCD Prometheus metrics are correctly triggering alerts in Alertmanager.
In this lesson, you updated the Alertmanager service to use a NodePort, added a custom Prometheus alert for an ArgoCD application that went out of sync, and verified the new alert through the Alertmanager UI. This methodology can be extended to monitor and alert on additional ArgoCD scenarios.Happy monitoring!