Grafana Loki
Grafana Loki Essentials Part 1
Collecting App logs
In this guide, we will demonstrate how to collect logs generated by a Node.js application running on two nodes. We will configure Promtail to gather these logs and forward them to a Loki server for visualization in Grafana.
Connecting to the Nodes
Start by opening separate terminal sessions for node-1 and node-2. Connect to the nodes using your preferred method. For example, you might use the following command:
vagrant s
After connecting, rename your terminal tabs to easily distinguish between node-1 and node-2.
When you connect to node-1, you should see output similar to this:
Usage of /: 6.8% of 38.70GB
Memory usage: 31%
Swap usage: 0%
Processes: 125
Users logged in: 1
IPv4 address for docker0: 172.17.0.1
IPv4 address for enp0s3: 10.0.2.15
IPv4 address for enp0s8: 192.168.1.31
IPv6 address for enp0s8: 2603:6080:e01:898a::1973
IPv6 address for enp0s8: 2603:6080:e01:898a:a00:27ff:fec2:a5d
* Strictly confined Kubernetes makes edge and IoT secure. Learn how MicroK8s
just raised the bar for easy, resilient and secure K8s cluster deployment.
https://ubuntu.com/engage/secure-kubernetes-at-the-edge
Expanded Security Maintenance for Applications is not enabled.
0 updates can be applied immediately.
Enable ESM Apps to receive additional future security updates.
See https://ubuntu.com/esm or run: sudo pro status
New release '22.04.2 LTS' available.
Run 'do-release-upgrade' to upgrade to it.
Last login: Tue Jul 18 05:39:30 2023 from 10.0.2.2
vagrant@node-1:~$
Examining the Application and Log File
On node-1, navigate to the application directory where your Node.js application is running. The application writes its logs to a file called app.log
, located in the same directory as index.js
.
vagrant@node-1:~$ cd app/
vagrant@node-1:~/app$ ls
app.log index.js node_modules package-lock.json package.json
vagrant@node-1:~/app$
To inspect the log file, you can use the cat
or tail
command:
vagrant@node-1:~/app$ cat app.log
The same file structure exists on node-2, and its logs can be inspected similarly. New log entries should be created every few seconds.
Verifying Log Output
Below is an example of log entries generated on node-2:
{"level":60,"time":1688961052688,"pid":26983,"hostname":"node-2","method":"GET","route":"/products","code":"404"}
{"level":30,"time":1688961053688,"pid":26983,"hostname":"node-2","method":"DELETE","route":"/users","code":"401"}
{"level":30,"time":1688961056793,"pid":26983,"hostname":"node-2","method":"POST","route":"/cart","code":"404"}
{"level":50,"time":1688961060721,"pid":26983,"hostname":"node-2","method":"DELETE","route":"/users","code":"500"}
{"level":40,"time":1688961061220,"pid":26983,"hostname":"node-2","method":"POST","route":"/users","code":"401"}
{"level":30,"time":1688961061815,"pid":26983,"hostname":"node-2","method":"GET","route":"/users","code":"404"}
{"level":60,"time":1688961064731,"pid":26983,"hostname":"node-2","method":"GET","route":"/users","code":"201"}
vagrant@node-2:~/app$ pwd
/home/vagrant/app
vagrant@node-2:~/app$
This output confirms that the application is emitting logs. Promtail will collect these logs and forward them to the Loki server for further analysis in Grafana.
Updating the Promtail Configuration
Before updating Promtail’s configuration, stop the running Promtail instance on node-1 by pressing Ctrl-C
. Then, review the current Promtail configuration file:
vagrant@node-1:~$ ls
LICENSE app flog_0.4.3_linux_amd64.tar.gz log.gz
README.md flog promtail-linux-amd64 promtail-linux-amd64.zip
promtail-local-config.yaml
vagrant@node-1:~$ cat promtail-local-config.yaml
The default configuration might look like this:
server:
http_listen_port: 9080
grpc_listen_port: 0
positions:
filename: /tmp/positions.yaml
clients:
- url: http://loki:3100/loki/api/v1/push
scrape_configs:
- job_name: system
static_configs:
- targets:
- localhost
labels:
job: varlogs
__path__: /var/log/*
Since your Node.js application writes logs in its directory (for example, /home/vagrant/app/app.log
), add a new scrape job for these logs. Update the configuration as shown below:
server:
http_listen_port: 9080
grpc_listen_port: 0
positions:
filename: /tmp/positions.yaml
clients:
- url: http://loki:3100/loki/api/v1/push
scrape_configs:
- job_name: system
static_configs:
- targets:
- localhost
labels:
job: varlogs
__path__: /var/log/*log
- job_name: api
static_configs:
- targets:
- localhost
labels:
job: apilogs
__path__: /home/vagrant/app/*log
Tip
You can add additional labels under the labels
section (for example, env: production
) to help refine log queries in Grafana.
Save the updated configuration file and exit your text editor.
Applying the Configuration on Node-1 and Node-2
On node-1, ensure you are in the correct directory before editing the configuration:
vagrant@node-1:~/app$ pwd
/home/vagrant/app
Then, open the configuration file (using an editor like nano
):
vagrant@node-1:~$ nano promtail-local-config.yaml
Paste the updated configuration and save the file. Repeat these steps on node-2:
vagrant@node-2:~$ ls
app promtail-linux-amd64 promtail-linux-amd64.zip promtail-local-config.yaml
vagrant@node-2:~$ nano promtail-local-config.yaml
Make sure node-2’s configuration matches the updated settings.
Restarting Promtail
After updating the configuration on both nodes, restart Promtail.
On node-2, execute:
vagrant@node-2:~$ ls
app promtail-linux-amd64.zip promtail-local-config.yaml
vagrant@node-2:~$ sudo ./promtail-linux-amd64 -config.file=promtail-local-config.yaml
Then, on node-1, start Promtail similarly:
vagrant@node-1:~$ sudo ./promtail-linux-amd64 -config.file=promtail-local-config.yaml
Verification
Ensure the startup logs display no errors. Look for messages indicating that Promtail is reloading the configuration and listening on the designated HTTP and gRPC ports.
Example startup output:
level=info ts=2023-07-18T06:24:39.133104258Z caller=promtail.go:133 msg="Reloading configuration file" md5sum=d5cecc51f7a97d499eb986674b21d98
level=info ts=2023-07-18T06:24:39.133775788Z caller=server.go:323 http=[::]:9080 grpc=[::]:34301 msg="server listening on addresses"
level=info ts=2023-07-18T06:24:39.133895202Z caller=main.go:174 msg="Starting Promtail" version="(version=2.8.2, branch=HEAD, revision=9f809eda7)"
level=warn ts=2023-07-18T06:24:39.133954119Z caller=promtail.go:265 msg="enable watchConfig"
Viewing Logs in Grafana
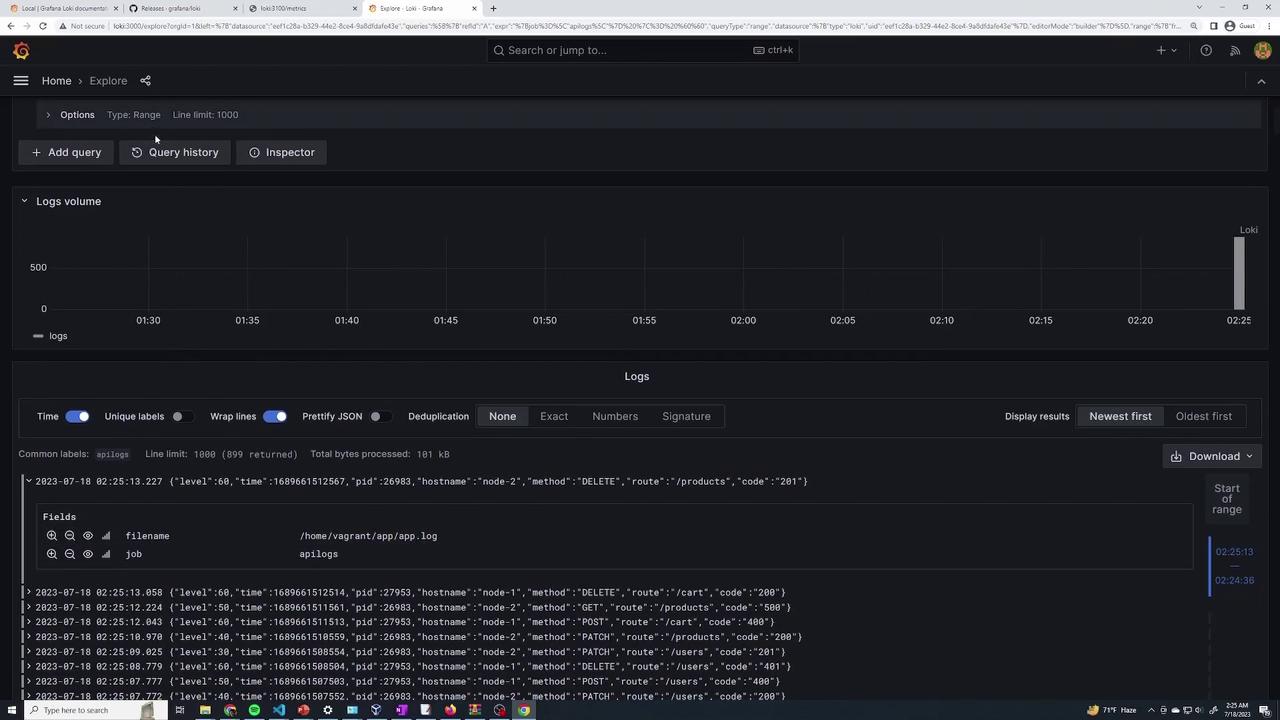
After Promtail is running on both nodes, access your Grafana instance and open the Explore interface. To filter the API logs, run the following query:
{job="apilogs"} |= ""
This query displays logs from your API application along with metadata such as hostname, HTTP method, request route, and status code. For a more specific search, you can use:
{job="apilogs", filename="/home/vagrant/app/app.log"} |= ""
Sample log entries might appear as follows:
2023-07-18 02:26:04.912 {"level":30,"time":1689661564912,"pid":27953,"hostname":"node-1","method":"GET","route":"/users/","code":201}
2023-07-18 02:26:04.857 {"level":30,"time":1689661564858,"pid":26963,"hostname":"node-2","method":"PATCH","route":"/cart","code":404}
2023-07-18 02:26:04.813 {"level":30,"time":1689661564813,"pid":26963,"hostname":"node-1","method":"DELETE","route":"/cart","code":500}
2023-07-18 02:26:04.811 {"level":30,"time":1689661564811,"pid":26963,"hostname":"node-1","method":"POST","route":"/cart","code":400}
Grafana’s Explore interface provides filtering options and dropdowns to refine your queries based on specific log fields. The detailed log entries and visual summaries make it easier to identify issues and monitor your application logs effectively.
By following these steps, you have successfully configured Promtail on multiple nodes to collect log files from both system directories and your application directory. This setup makes monitoring and troubleshooting your API logs through Grafana an efficient process.
Watch Video
Watch video content