This guide verifies Loki server log reception and demonstrates querying logs using Grafana.
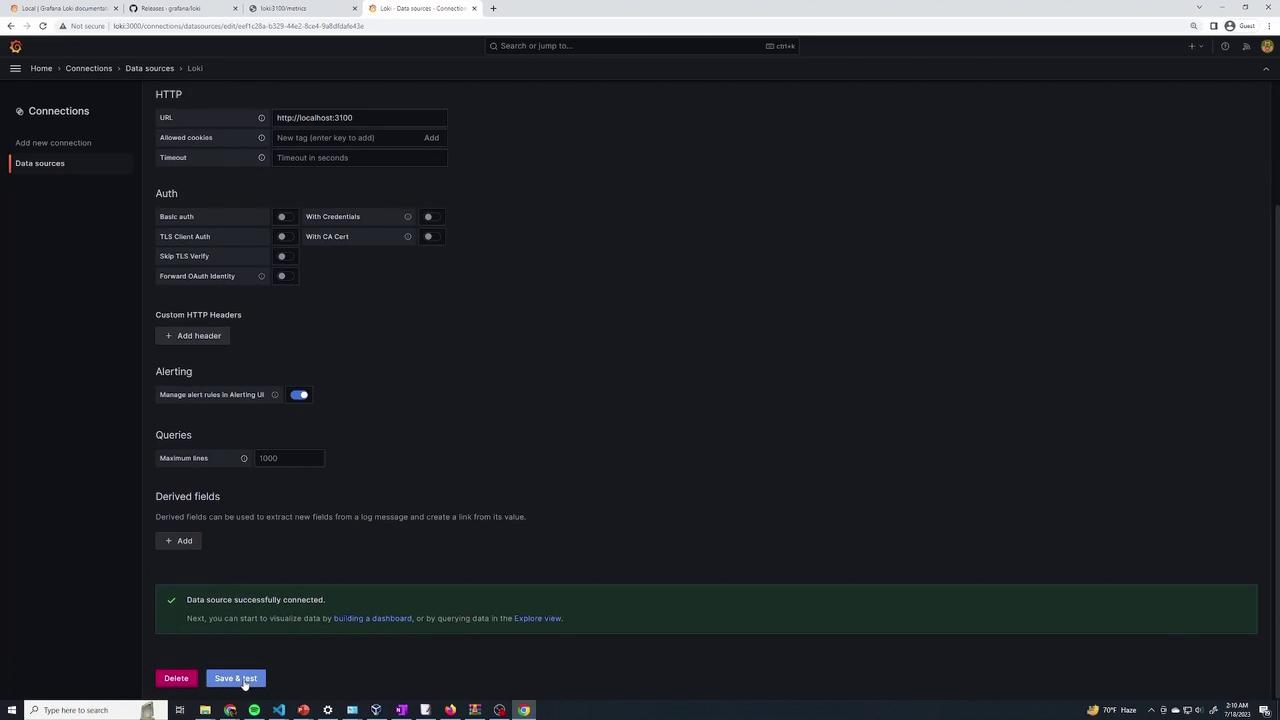
In this guide, we’ll verify that our Loki server is successfully receiving log messages and demonstrate how to query these logs using Grafana.Below is an excerpt from the Loki log output, confirming that various log files (e.g., auth.log, cloud-init-output.log, kern.log, etc.) have been processed:
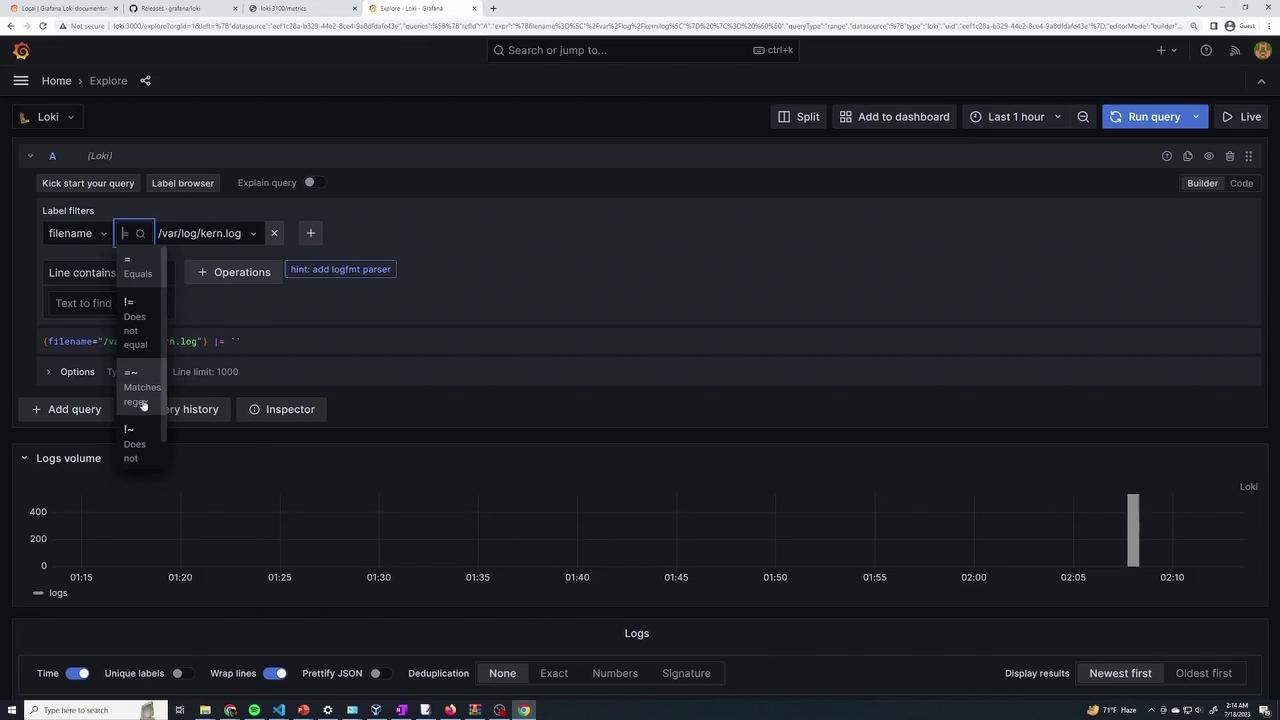
Switch to the Explore section in Grafana and ensure that Loki is selected as your data source. Grafana will automatically display various labels such as job names and file names from which the logs originated. These labels are useful for filtering the logs you wish to view.
To filter logs by a specific label—such as logs where the label job is set to “varlogs”—use the following query:
Copy
{job="varlogs"}
To further narrow down the search for logs containing a keyword (e.g., “docker”), you can append a filter operator:
Copy
{job="varlogs"} |= "docker"
This refined query will return only the logs that contain the word “docker”. The log entries might resemble:
Copy
2023-07-18 02:11:19.683 Jul 18 06:11:19 ubuntu-focal multipathd[488]: sda: failed to get sgio uid: No data available2023-07-18 02:11:19.683 Jul 18 06:11:19 ubuntu-focal multipathd[488]: sdb: failed to get sysfs uid: No data available2023-07-18 02:11:19.683 Jul 18 06:11:19 ubuntu-focal multipathd[488]: add missing path2023-07-18 02:11:19.683 Jul 18 06:11:19 ubuntu-focal multipathd[488]: sda: failed to get udev uid: Invalid argument2023-07-18 02:11:19.683 Jul 18 06:11:19 ubuntu-focal multipathd[488]: sdb: failed to get sysfs uid: No data available2023-07-18 02:11:19.683 Jul 18 06:11:19 ubuntu-focal multipathd[488]: failed to get udev uid: Invalid argument
Selecting an individual log entry within Grafana will also reveal its associated labels, such as job and filename, providing additional context for deeper troubleshooting.
If you need to query logs from a specific file, such as /var/log/kern.log, adjust your query by filtering with the filename label. For example, to display logs from /var/log/kern.log that contain the term “docker”, use:
Copy
{filename="/var/log/kern.log"} |= "docker"
To view all logs from the same file without any additional keyword filter, simply use:
You can also query logs from multiple files by using a regular expression. For instance, to retrieve logs from either /var/log/kern.log or /var/log/syslog, use:
If you prefer to fetch all logs from the matched files without filtering based on text, use:
Copy
{filename=~"/var/log/kern.log|/var/log/syslog"}
These examples illustrate how you can leverage Loki’s powerful LogQL to filter logs using labels and search within log messages. Grafana’s intuitive query builder further simplifies the process, enabling you to quickly locate the logs relevant to your operations and troubleshooting needs.
By following this guide, you’ll gain confidence in using Loki and Grafana to manage and query your logs efficiently. For additional details, explore the Loki Documentation and the Grafana Documentation.