Grafana Loki
Grafana Loki Essentials Part 2
Connecting to Grafana
In this lesson, we will walk through the steps required to connect to your Grafana instance and verify that both Loki and Grafana are operating correctly. By default, our Kubernetes services are configured as ClusterIP, meaning they are only accessible from within the cluster. Although you could modify these settings or configure an Ingress for external access, for this demonstration we will use port forwarding to securely connect to Grafana.
Tip
Using port forwarding is an excellent way to test and interact with in-cluster applications like Grafana without exposing them to the public internet.
Step 1: Inspect Your Kubernetes Resources
To begin, list all running pods and services using the following command:
kubectl get all
This command returns an output similar to the example below:
NAME                                               READY   STATUS            RESTARTS   AGE
pod/loki-0                                        0/1     Running           0          40s
pod/loki-grafana-5df4fd7d99-x4794                 2/2     Running           0          40s
pod/loki-promtail-bk9rj                           1/1     Running           0          40s

NAME                           TYPE        CLUSTER-IP      EXTERNAL-IP     PORT(S)    AGE
service/kubernetes             ClusterIP   10.96.0.1       <none>          443/TCP    157d
service/loki                   ClusterIP   10.96.247.199   <none>          3100/TCP   40s
service/loki-grafana           ClusterIP   10.103.158.170  <none>          80/TCP     40s
service/loki-headless          ClusterIP   None            <none>          3100/TCP   40s
service/loki-memberlist        ClusterIP   None            <none>          7946/TCP   40s

NAME                                    DESIRED   CURRENT   READY   UP-TO-DATE   AVAILABLE   NODE SELECTOR   AGE
daemonset.apps/loki-promtail           1         1         1       1            1           <none>          40s
deployment.apps/loki-grafana           1         1         1       1            40s

NAME                                               DESIRED   CURRENT   READY   AGE
replicaset.apps/loki-grafana-5df4fd7d99           1         1         1       40s

NAME                                             READY   AGE
statefulset.apps/loki                            0/1     40s
Step 2: Set Up Port Forwarding
Since our focus is on Loki and Grafana, we will forward the port for Grafana rather than changing the service type. This method enables you to connect to the Grafana pod from your local machine directly.
List the Pods:
First, confirm the name of the Grafana pod:kubectl get podsSample output:
NAME                                READY   STATUS    RESTARTS   AGE
loki-0                              1/1     Running   0          2m37s
loki-grafana-5df4fd7d99-x4794        2/2     Running   0          2m37s
loki-promtail-bk9rj                  1/1     Running   0          2m37s
Forward the Port:
Forward port 3000 from the Grafana pod to your local machine using the following command. This port mapping allows local connections to interface with the Grafana container that listens on port 3000:kubectl port-forward pod/loki-grafana-5df4fd7d99-x4794 3000:3000
Once port forwarding is active, open your browser and visit http://localhost:3000.
Security Warning
Port forwarding is ideal for testing; however, it is not recommended for production environments. Always secure your clusters appropriately when exposing services.
Step 3: Retrieve Grafana Credentials
When you access Grafana via your browser, you'll be prompted for a username and password. The default username is "admin". To retrieve the admin password, you need to inspect the Kubernetes secrets created by the Helm charts.
List All Secrets:
Run the following command to view all secrets:kubectl get secretExample output:
NAME                             TYPE                                  DATA   AGE
default-token-nmtvr              kubernetes.io/service-account-token     3    158d
loki                             Opaque                                1    5m51s
loki-grafana                     Opaque                                3    5m51s
loki-grafana-token-zxtp4         kubernetes.io/service-account-token     3    5m51s
loki-promtail                    Opaque                                1    5m51s
loki-promtail-token-8c44b         kubernetes.io/service-account-token     3    5m51s
loki-token-7xlxb                 kubernetes.io/service-account-token     3    5m51s
sh.helm.release.v1.loki.v1        helm.sh/release.v1                   1    5m51s
Inspect the loki-grafana Secret:
Identify the secret named "loki-grafana" and display its details with:kubectl describe secret loki-grafanaIn the output, look for the following data fields:
- admin-password: 40 bytes
- admin-user: 5 bytes
- ldap.toml: 0 bytes
Decode the Admin Password:
Extract and decode the admin password (which is Base64 encoded) using this command:kubectl get secret loki-grafana -o jsonpath="{.data.admin-password}" | base64 --decode
Copy the decoded admin password and use it, along with the username "admin", to log into Grafana.
Step 4: Verify Grafana Dashboard and Loki Data Source
After successful login, the Grafana dashboard will appear. One of the key benefits of this deployment is that Grafana automatically configures Loki as a data source using the Helm chart settings. To confirm this:
- Navigate to the "Data Sources" section within Grafana.
- Verify that Loki is listed and available for usage.

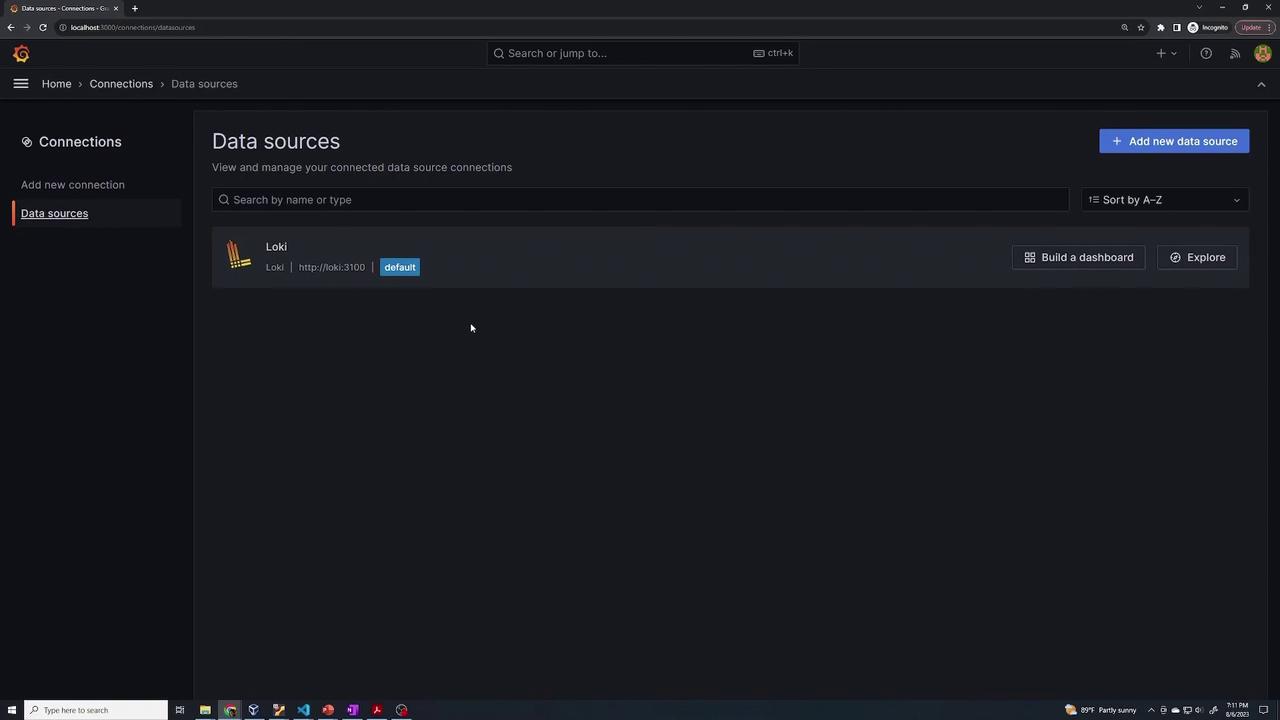
This setup confirms that Loki is properly integrated as a data source, enabling you to start exploring logs and creating custom dashboards.
Summary
With these steps, you have successfully connected to your Grafana instance and verified the integration of Loki. Now you can dive into monitoring your logs and building insightful dashboards.
Happy monitoring!
Watch Video
Watch video content