This article covers querying pod logs in Grafana and reviewing Promtail configurations used within a Loki-Grafana setup.
In this guide, we demonstrate how to view Kubernetes logs and review the default Promtail configurations used in a Loki-Grafana environment. You’ll learn how to query logs in Grafana, inspect the Promtail configuration, and understand how Kubernetes service discovery and relabeling work together to provide an efficient logging solution.
This article covers querying pod logs in Grafana and reviewing Promtail configurations used within a Loki-Grafana setup. Ensure that your Loki stack is running and properly configured to collect logs from your Kubernetes environment.
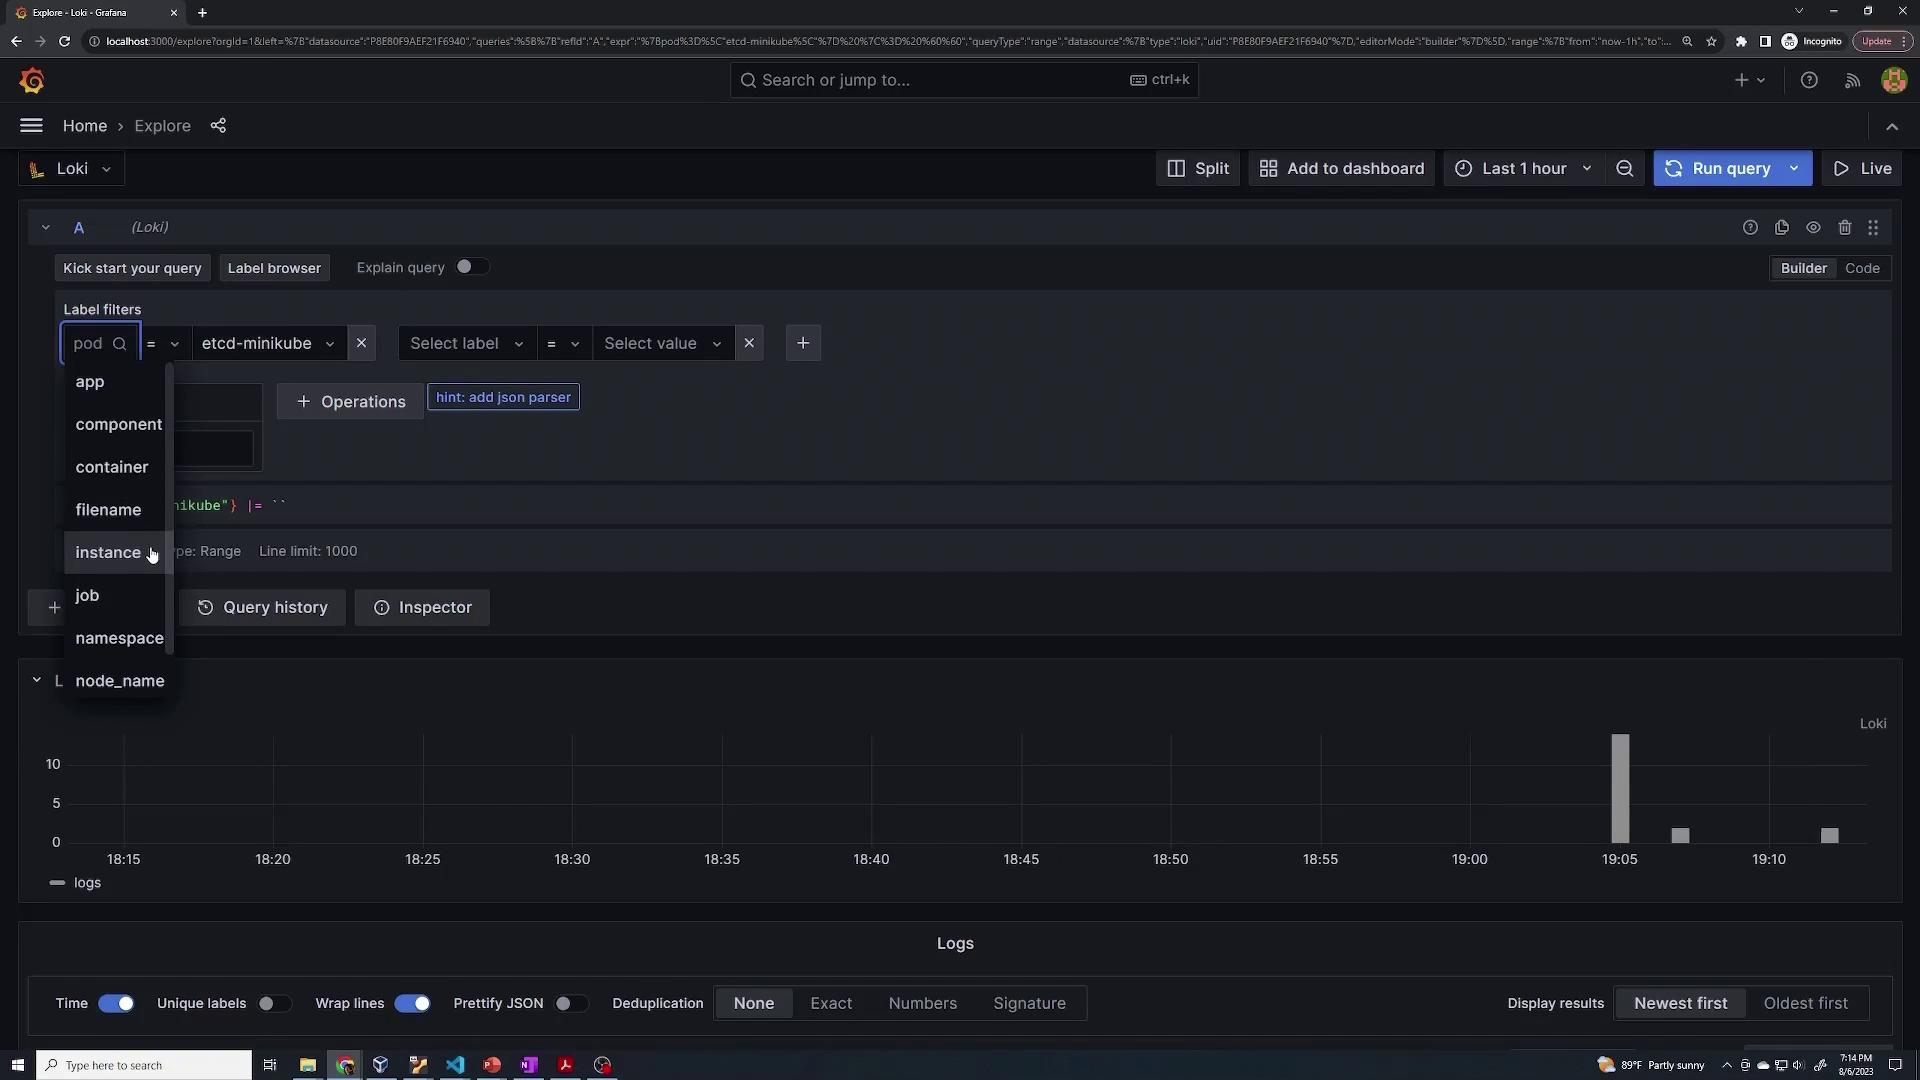
After navigating to the Explore section in Grafana, run a query to confirm that logs are being collected. When selecting a label (for example, “cd mini”) and executing a query, you’ll see various system labels—such as app, component, file name, instance, job, and namespace—that are automatically assigned to system pods (e.g., etcd server, kube API, kube controller) as well as to Loki, Grafana, and Promtail pods.For example, to view logs for a specific pod (e.g., the etcd pod in the “minikube” namespace), use the following query:
Copy
{pod="etcd-minikube"} |= ``
This query returns all logs generated by the etcd pod, along with metadata labels such as node name, scrape job (defined within the Promtail configuration), and the source file path (typically located under /var/log/pods). You can further refine your queries by modifying or adding extra labels. For instance:
Copy
{pod="etcd-minikube"} |= ''
This setup illustrates how logs from containers and pods in a Kubernetes environment are collected and transmitted to Grafana via Loki and Promtail.
First, verify the presence of the Loki-Grafana secret and retrieve the admin password:
Copy
kubectl get secret loki-grafana -o jsonpath="{.data.admin-password}"Error from server (NotFound): secrets "loki-grafana" not foundkubectl get secret loki-grafana -o jsonpath="{.data.admin-password}"VH5YTD0UdVkVHRXVuZCVJQUSoThqZ1g2QnlxblM3cUZRjV5Tg==kubectl get secret loki-grafana -o jsonpath="{.data.admin-password}" | base64 --decodeTqya7NQdWDGUuvqRANHE8jXByqan5g7FkN5yN
Ensure that your Loki stack is running by listing the current pods:
Copy
kubectl get podNAME READY STATUS RESTARTS AGEloki-0 1/1 Running 0 10mloki-grafana-5df4f4fd99-x4794 2/2 Running 0 10mloki-promtail-bk9rj 1/1 Running 0 10mkubectl get sec
Then, inspect the Promtail pod to examine mounts and container configuration. The Promtail container uses several volumes, including a configuration volume mounted from a secret and directories for Docker containers and pod logs.Below is an excerpt from the Promtail pod configuration:
Copy
IP: 172.17.0.3Controlled By: DaemonSet/loki-promtailContainers: promtail: Container ID: docker://45bf8093b9c0cc175903ad18322dbfc52107e3f115ef2473913f6ab89eec576c Image: docker.io/grafana/promtail:2.8.3 Image ID: docker-pullable://grafana/promtail@sha256:48e658500dd2107c1fa08c674472ad199b8dec220c1283fb6c9b990c49ae6f0 Port: 3101/TCP Host Port: 0/TCP Args: -config.file=/etc/promtail/promtail.yaml State: Running Started: Sun, 06 Aug 2023 19:04:05 -0400 Ready: True Restart Count: 0 Readiness: http-get http://http-metrics/ready delay=10s timeout=1s period=10s #success=1 #failure=5 Environment: HOSTNAME: (v1:spec.nodeName) Mounts: /etc/promtail from config (rw) /run/promtail from run (rw) /var/lib/docker/containers from containers (ro) /var/log/pods from pods (ro) /var/run/secrets/kubernetes.io/serviceaccount from kube-api-access-s9fm7 (ro)Conditions: Type Status Initialized True Ready True ContainersReady True
This Promtail container configuration is defined by a Kubernetes secret (named loki-promtail) that supplies the Promtail configuration file.
To inspect the actual Promtail configuration, retrieve and decode the secret:
Copy
kubectl get secret loki-promtail -o jsonpath="{.data.promtail\.yaml}"
Then decode the secret’s content using base64. The decoded configuration outlines both client and scrape settings. For example, a snippet of the configuration is:
This configuration instructs Promtail on where to locate log files (typically under /var/log/pods) and how to assign labels based on the pod’s metadata.
The scrape configuration uses Kubernetes service discovery to locate all pods and applies relabeling rules to standardize log labels. An excerpt of the scrape configuration follows:
These relabeling rules ensure that critical metadata is preserved in the logs, making it easier to query and manage log data effectively in Grafana.
Using Kubernetes service discovery combined with relabeling rules enables Promtail to efficiently locate pods and standardize log labels, ensuring a seamless log monitoring experience in Grafana.
By following these steps and reviewing the configurations, you can monitor your Kubernetes environment’s logs with Loki, Promtail, and Grafana effectively.