Dynamic Load Balancing & Traffic Shaping
Consul automatically routes traffic only to registered, healthy service instances. You can define advanced traffic-shaping policies—similar to a load balancer—to split and steer requests:- Health-aware routing: Requests go only to passing checks.
- Weighted splits: Distribute traffic (e.g., 80/20) across service subsets.
- Path-based routing: Send specific URLs or HTTP methods to designated backends.
- Failover & multi-cloud: When an availability zone or cloud provider fails, traffic shifts seamlessly to healthy regions or on-premises datacenters.
Consul integrates natively with Envoy for L7 control, and you can extend to F5, NGINX, or HAProxy using built-in connectors.
Integration Partners
| Proxy / Load Balancer | Use Case | Learn More |
|---|---|---|
| Envoy | Full L7 policy & observability | Envoy Proxy |
| NGINX | HTTP/S traffic management | NGINX Docs |
| HAProxy | High-performance L4/L7 routing | HAProxy |
| F5 | Enterprise hardware appliances | F5 Networks |
Service Splitting Example
- Initial state: All traffic routes to
v1. - Canary upgrade: Deploy
v2and validate. - Traffic shift: Apply a
service-splitterpolicy.
Ensure both versions pass health checks before shifting traffic. A misconfigured subset with
Weight > 0 and failing health checks will not receive traffic.Layer 7 Visibility & Metrics
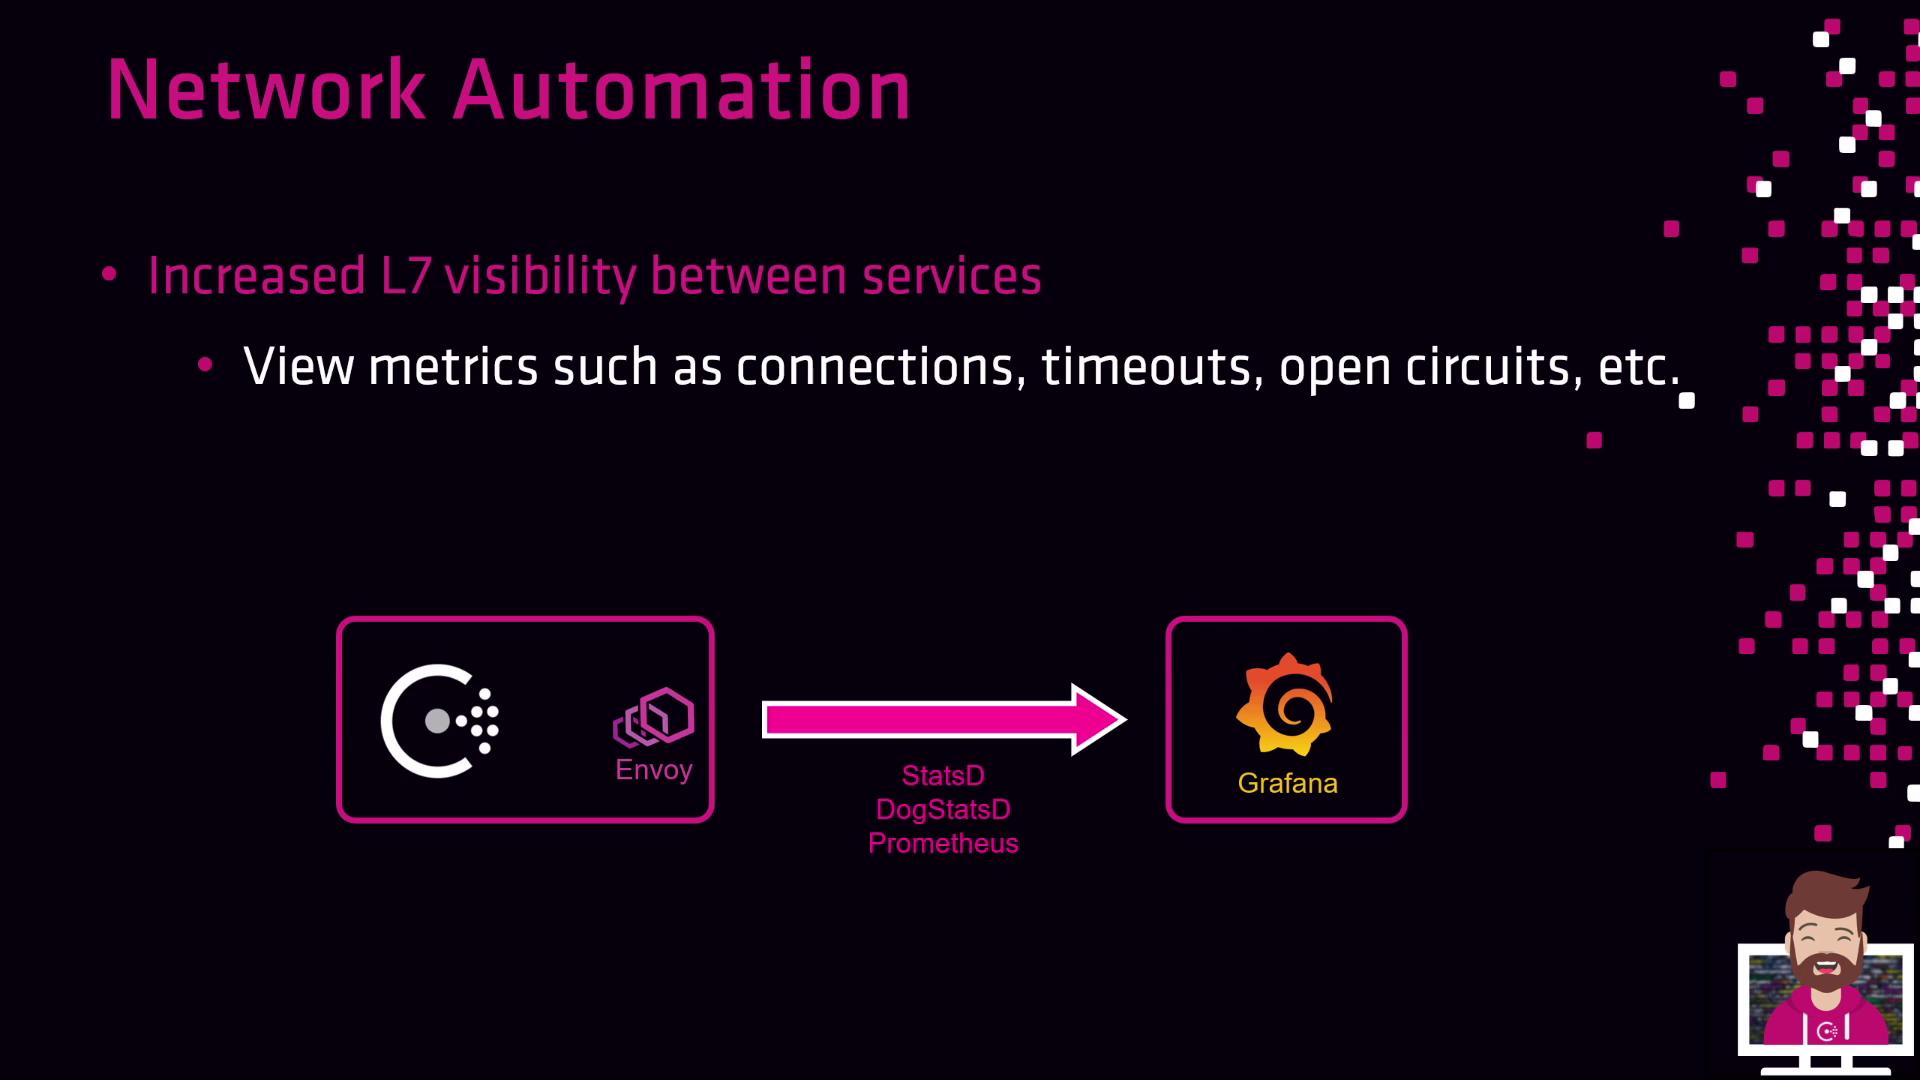
By pairing Consul’s network automation with Envoy’s built-in metrics, you gain real-time L7 insights:- Connection counts
- Request latencies and timeouts
- Circuit breaker states