Objective 2 Overview
In this lesson, we focus on monitoring a Vault environment. While Objective 1 emphasizes Vault configuration, Objective 2 covers:- Monitor and understand Vault Telemetry
- Monitor and understand Vault Audit Logs
- Monitor and understand Vault Operational Logs
What Is Vault Telemetry?
Vault telemetry is a set of runtime metrics that reveal how Vault performs and operates internally. Typical telemetry data includes:- Write durations to the storage backend
- Vault’s response times for client API requests
- Node seal or initialization status
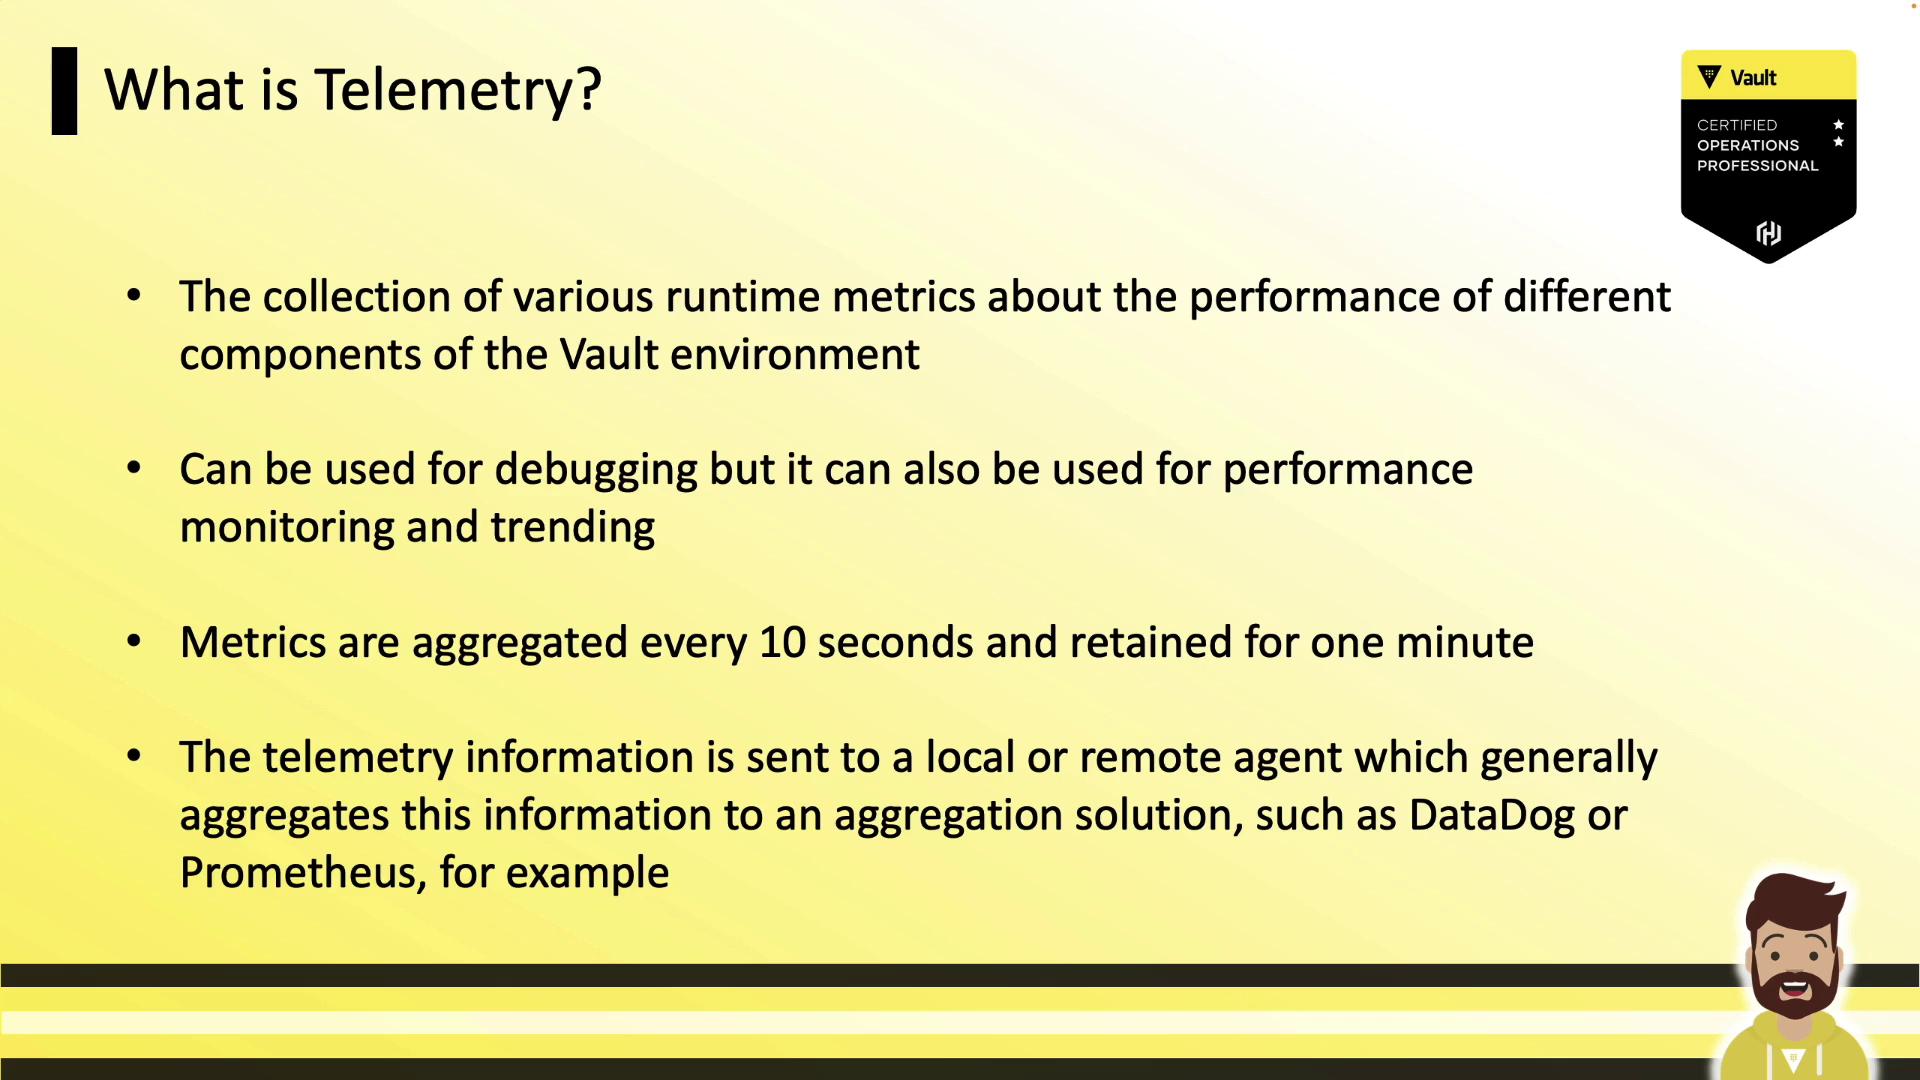
Telemetry metrics are held in-memory for only 60 seconds. Ensure your agent scrapes them at least every 10 seconds to avoid missing critical data.
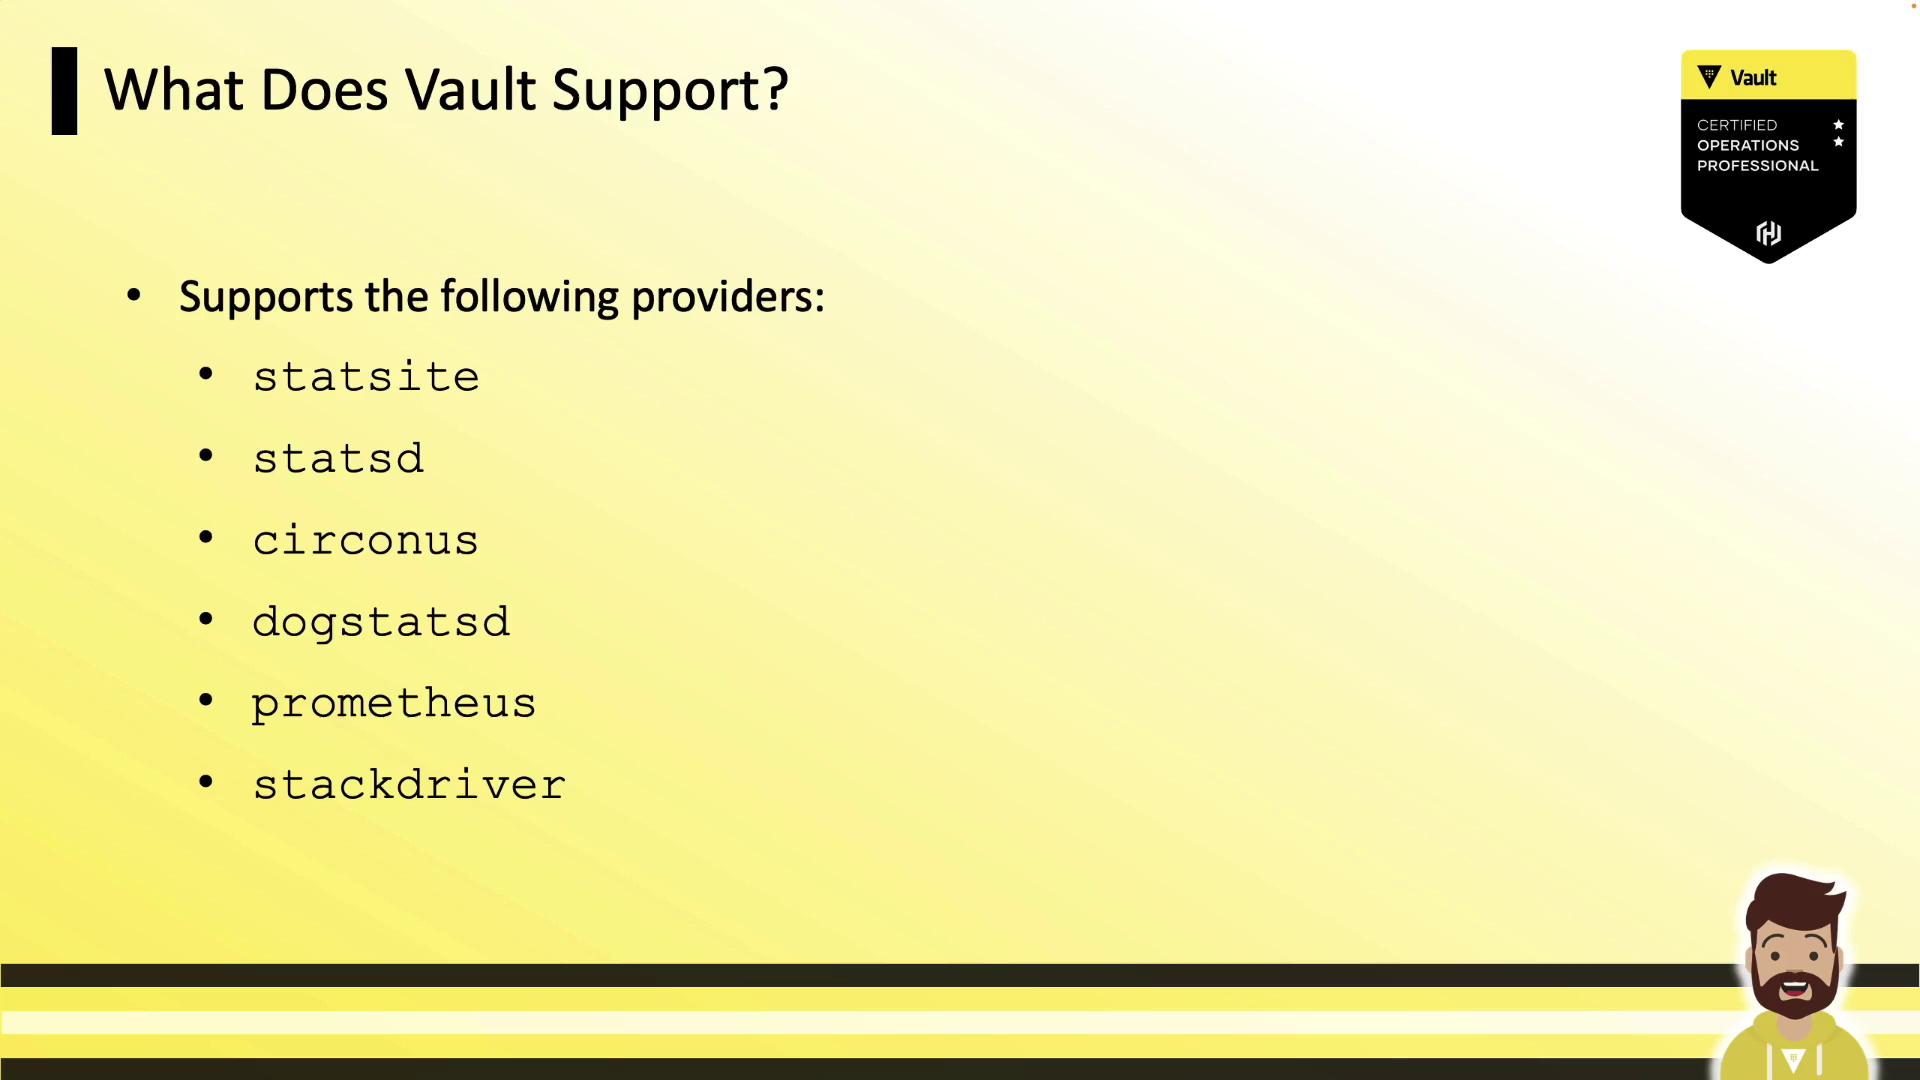
Supported Telemetry Providers
Configure telemetry in thetelemetry stanza of your Vault HCL config. Vault supports multiple backends:
| Provider | Use Case | Recommended Platform |
|---|---|---|
| statsite | Simple, statsd-compatible aggregation | Custom scripts |
| statsd | General metrics collection | Graphite, DataDog |
| circonus | Enterprise-grade monitoring | Circonus |
| dogstatsd | DataDog-specific tags and metrics | DataDog |
| prometheus | Pull-based model, native Vault integration | Prometheus |
| stackdriver | Google Cloud monitoring | Google Stackdriver |
dogstatsd for DataDog and prometheus for Prometheus.
Common Vault Telemetry Metrics
Vault emits a variety of metrics. Below are some key examples: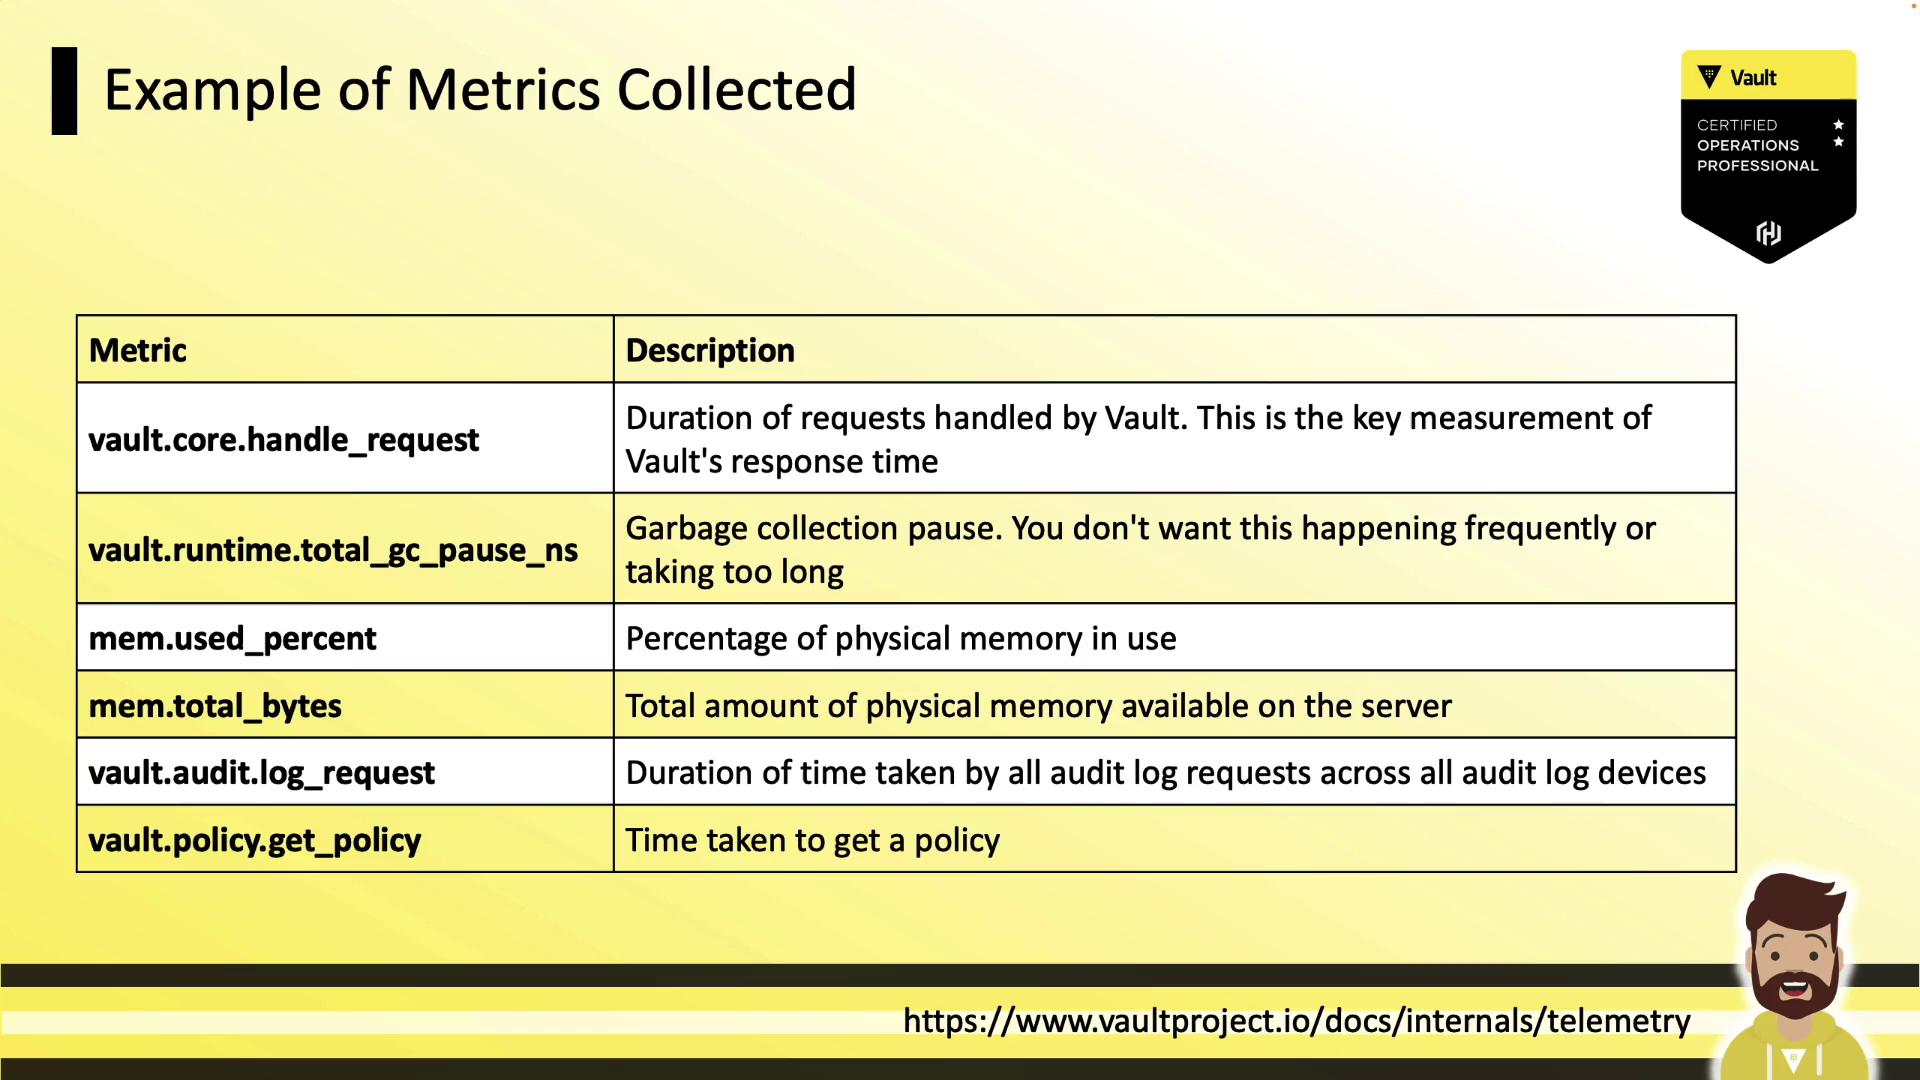
| Metric | Description |
|---|---|
| vault.core.handleRequest | Time taken to handle API requests |
| vault.runtime.totalGCPauseNS | Nanoseconds spent in garbage collection (stop-the-world) |
| vault.runtime.memoryUsePercentage | Percentage of physical memory in use |
| vault.runtime.memoryUseTotalBytes | Total physical memory in use (bytes) |
| vault.audit.log.request | Latency of sending audit log entries |
| vault.policy.getPolicy | Duration to retrieve policy definitions |
Configuring Telemetry in Vault
To enable telemetry, add atelemetry block to your Vault server’s HCL configuration. For example, to configure DogStatsD:
SIGHUP to reload the settings.
Incorrect telemetry configuration can lead to missing metrics or excessive network traffic. Always validate your HCL syntax and test connectivity to your metrics endpoint.
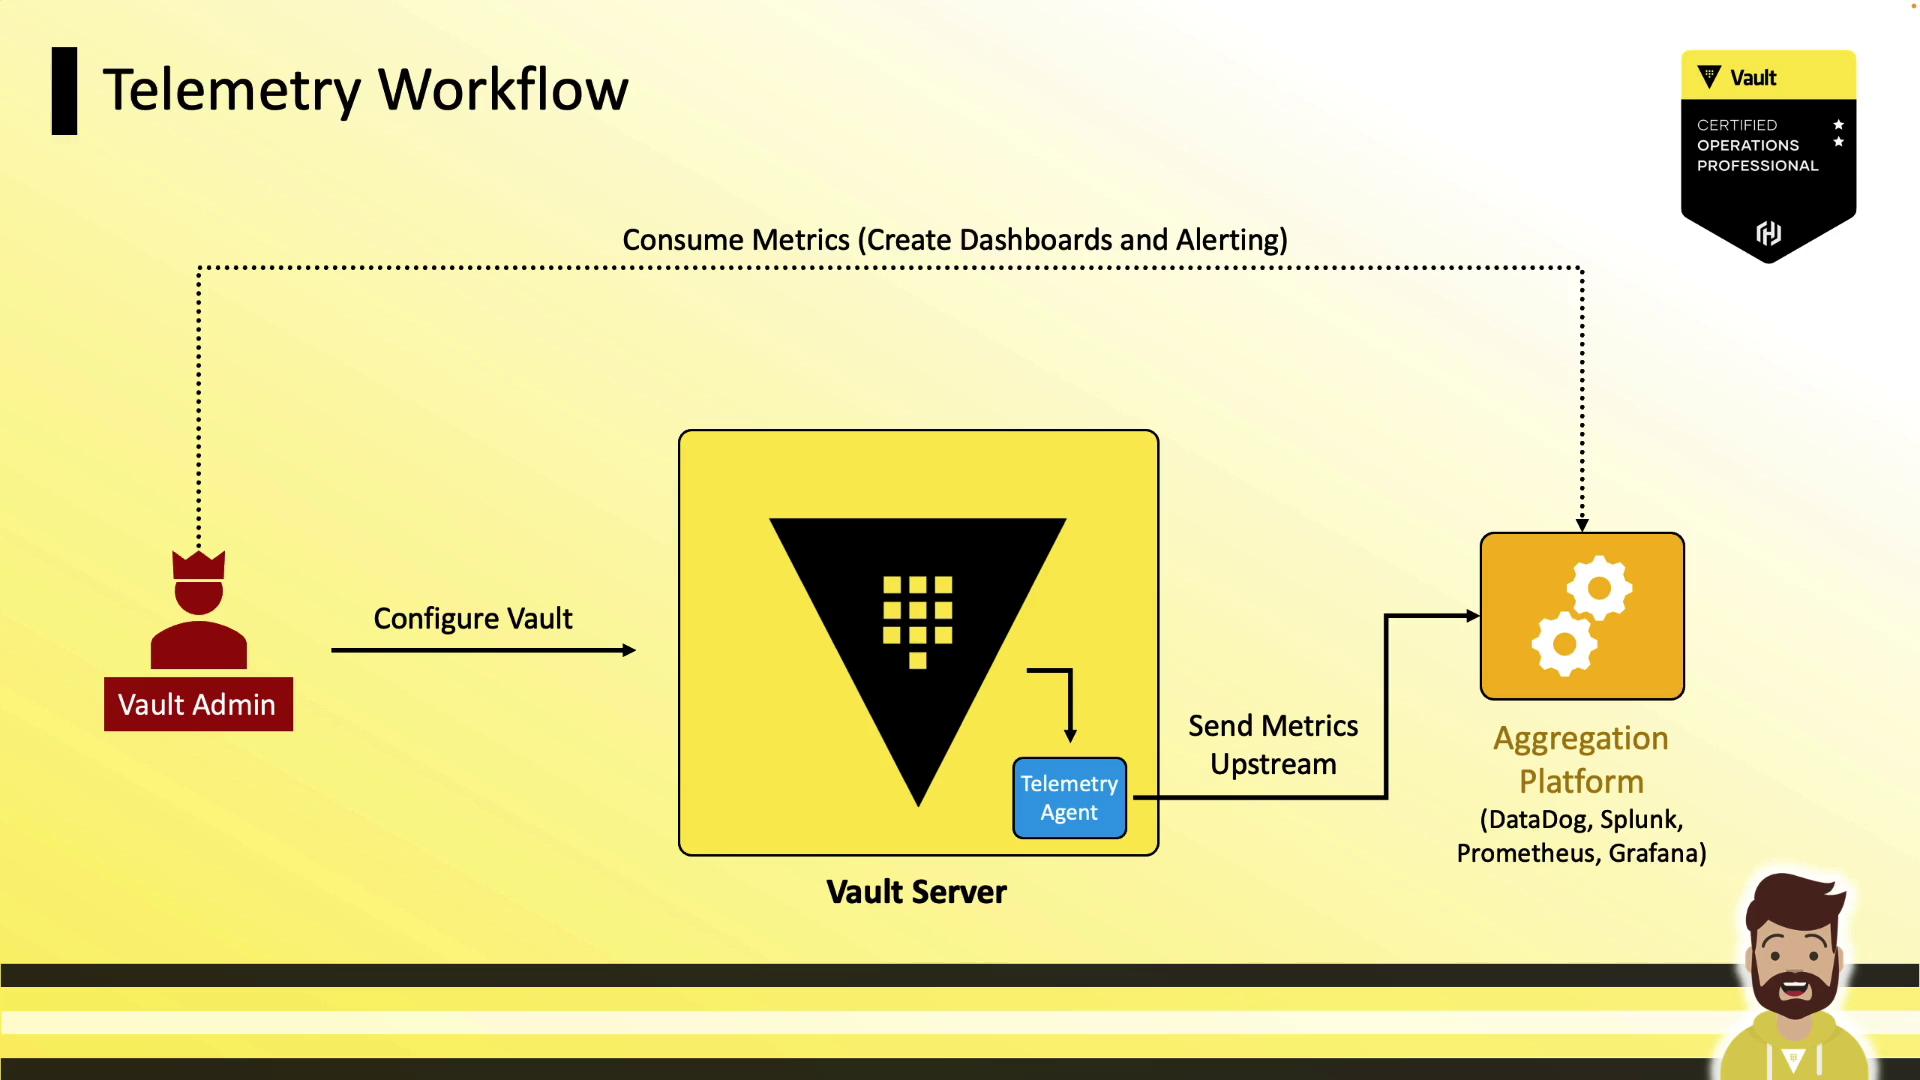
Telemetry Workflow
A typical Vault telemetry workflow involves:- Vault emits runtime metrics on each node.
- Local telemetry agent scrapes metrics (e.g., via DogStatsD or Prometheus endpoint).
- Agent forwards data to a centralized system:
- DataDog
- Splunk
- Prometheus
- Grafana
- Operations teams build dashboards and set up alerts based on these metrics.
Sample Monitoring Dashboard
Below is an example Vault monitoring dashboard in DataDog, showing key metrics such as garbage collection pause durations, login request latency, and backend performance. This view helps you quickly assess the status and health of your Vault cluster.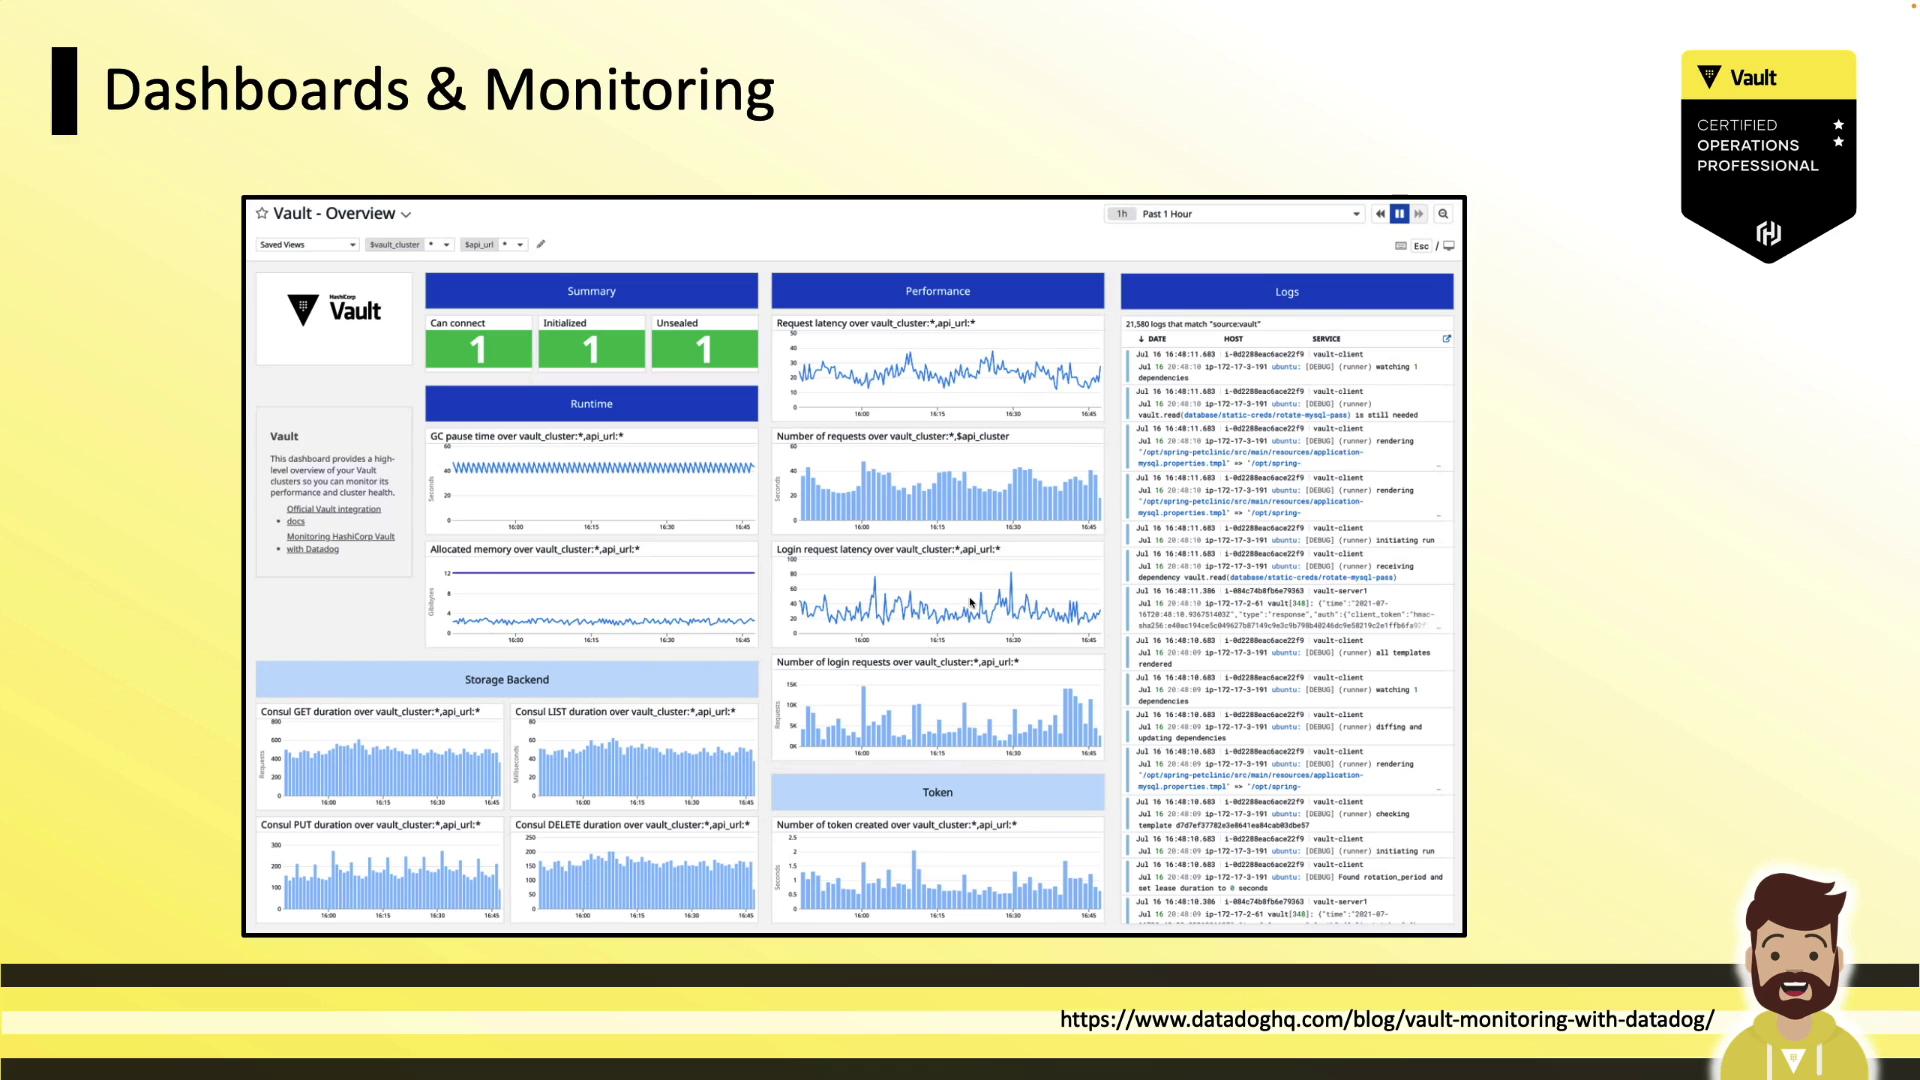
Key Takeaways
- Telemetry provides real-time metrics about Vault’s performance and health.
- Metrics aggregation occurs every 10 seconds and is retained for 60 seconds in memory.
- Supported providers include statsite, statsd, circonus, dogstatsd, prometheus, and stackdriver.
- Monitor essential metrics: request duration, GC pause, memory usage, and audit log latency.
- On the exam, you may need to interpret or identify telemetry configurations; full hands-on setup is uncommon.
Links and References
- Vault Telemetry Configuration
- Vault Metrics
- Vault Audit Logging
- Prometheus Documentation
- DataDog Docs