Prerequisites
Ensure the Bookinfo application is running in your cluster and is experiencing significant load.Accessing the Jaeger Dashboard
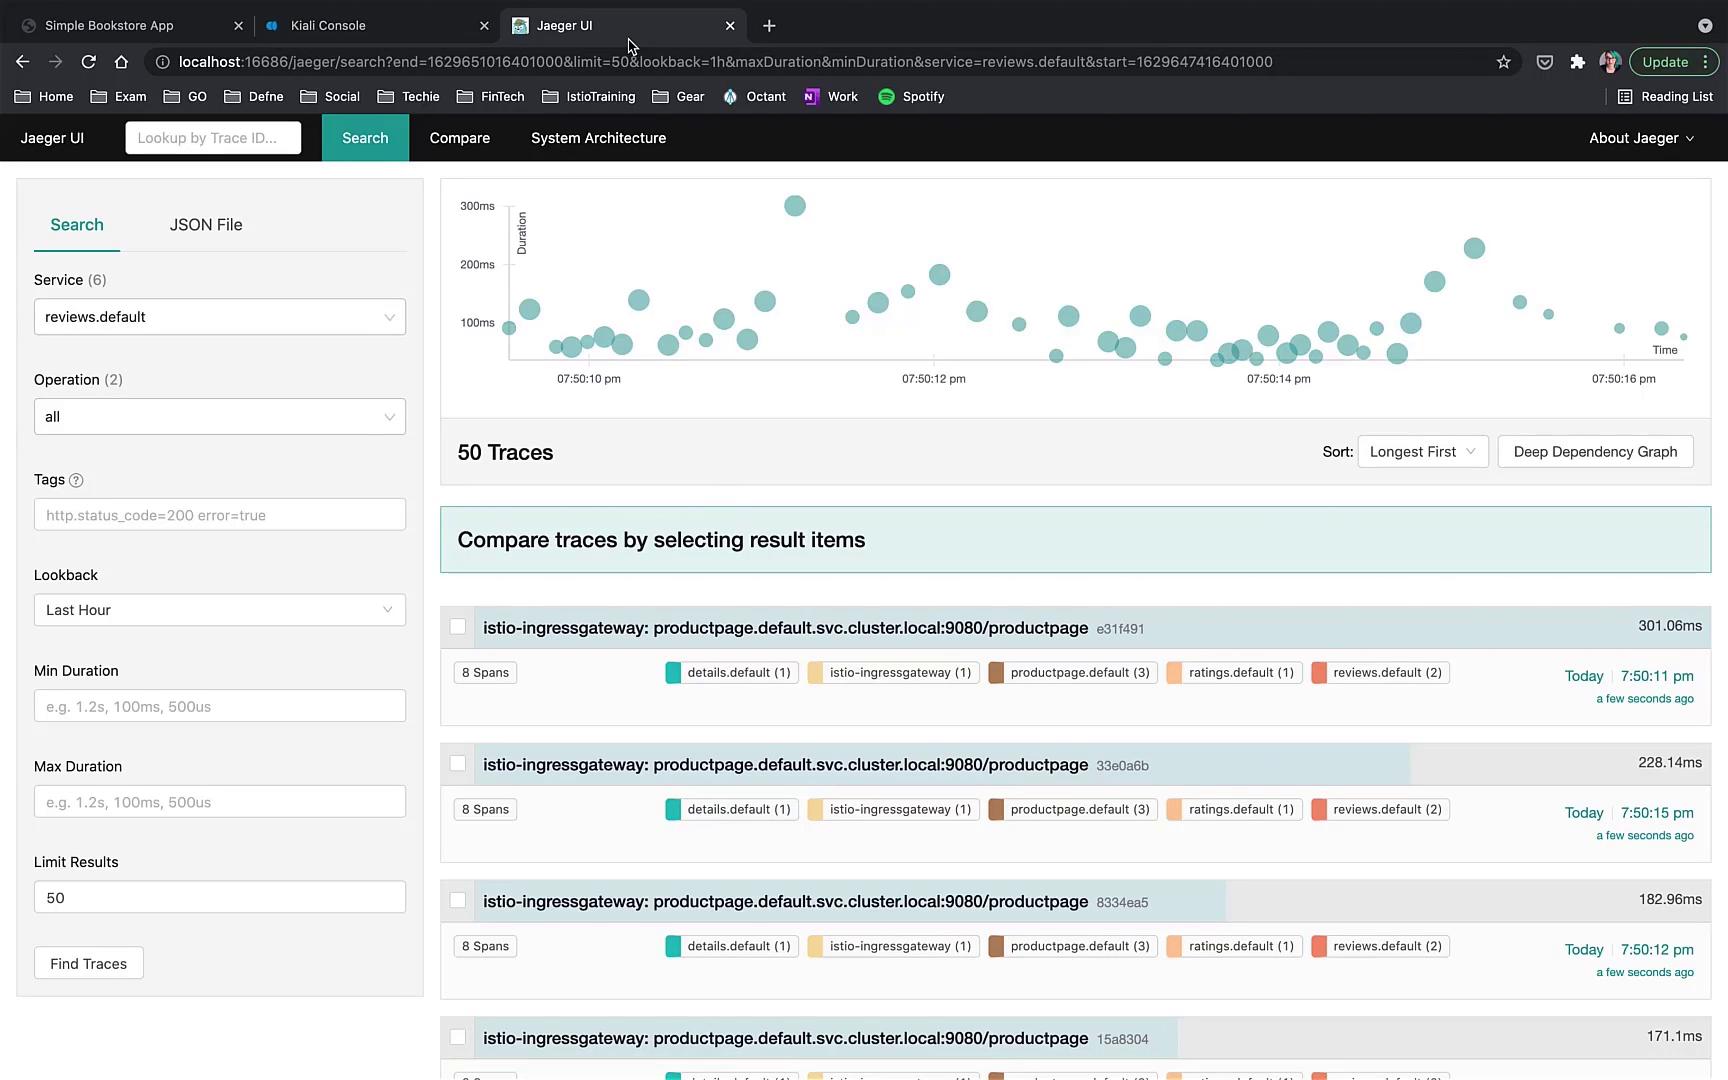
Open the Jaeger dashboard by executing the following command:For a broader view, increase the number of traces to 50. Keep in mind that under heavy load, Jaeger may sample only a few seconds (typically 3 or 4) of the timeline for these traces. You can also sort the traces by criteria such as longest duration, shortest duration, most spans, or least spans.
Analyzing Traces
Zoom into individual traces to inspect specific spans. Each line in a trace represents a span—a logical unit of work. For instance, a single trace might include 8 spans. When you expand a span, you can view:- Detailed timing information
- Associated tags for further filtering
Filtering by Service
To focus on the review service, filter the traces to display only those specific to reviews. The filtered results will clearly show the interactions involving the review service.Introducing Delays
Next, we introduce delays in the detail service to simulate performance issues. As seen in the traffic management section, a delay in the detail service causes the product service to wait for 3 seconds before returning an error. This confirms the delay is functioning as expected.When applying delays, ensure your environment is properly monitored to avoid unintended performance degradations in production.
Verifying with Kiali
To validate the delay, open the Kiali dashboard. Although the initial overview might not display significant changes, the graph view will reveal that the detail service is encountering issues, with error indicators visible for the affected services.Deep Dive with Jaeger
Switch back to the Jaeger dashboard and filter by the “product page” service. The image below illustrates the Jaeger UI with:- A scatter plot graph representing trace data
- A list of traces showing details like duration and spans
- You may identify a faulty trace where only 70% of the calls have delays.
- Drill down into the affected trace to observe that the product page encountered an error after a 3-second wait for a response from the detail service.
- Review additional traces: one might display a warning that its parent span hasn’t been reported yet (with all associated tags visible), while another trace shows the product service returning successfully in just 52 milliseconds without errors.