Istio Service Mesh
Observability
Demo Kiali in Detail
In this article, we explore various advanced features of Kiali using a modern configuration on the Bookinfo application. Kiali not only provides observability but also assists in configuring, updating, and validating your Istio service mesh. We will guide you through modifying fault injection settings, analyzing traffic flow, and reviewing Istio configurations to ensure your service mesh operates smoothly.
Prerequisite
Ensure your Bookinfo app is deployed and your Kiali and Istio environments are correctly configured before following these steps.
Adjusting Fault Injection Delay
To begin, we lower the fault injection delay percentage to 10%. This adjustment reduces error occurrences while still allowing a controlled amount of traffic flow. Apply the following VirtualService configuration:
kind: VirtualService
apiVersion: networking.istio.io/v1alpha3
metadata:
name: details
namespace: default
uid: 0b36d4c1-43e5-836f-5c8a7f83e0
resourceVersion: '12064'
generation: 6
creationTimestamp: '2021-08-21T18:01:39Z'
annotations:
kubectl.kubernetes.io/last-applied-configuration: >
{"apiVersion":"networking.istio.io/v1alpha3","kind":"VirtualService","metadata":{"annotations":{},"name":"details","namespace":"default"},"spec":{"hosts":["details"],"http":[{"fault":{"delay":{"fixedDelay":"7s","percentage":{"value":10}}},"route":[{"destination":{"host":"details","subset":"v1"}}]}]}}
spec:
hosts:
- details
http:
- fault:
delay:
fixedDelay: 7s
percentage:
value: 10
route:
- destination:
host: details
subset: v1
Observing Service Mesh Behavior
In the diagram below, you can notice that some errors exist in the mesh, yet traffic continues to be processed.
Exploring Kiali Features
Overview
Start with the Overview section in Kiali to get a high-level summary of your mesh—displaying workloads, services, and their health, mTLS status, or namespace labels. For this demo, we only have the "default" and "Istio system" namespaces. Use the namespace filtering options to view health details for apps, workloads, and services.
Graph Menu
Navigate to the Graph menu for a detailed visualization of inter-service traffic. Kiali supports multiple views, such as:
- App Graph
- Service Graph
- Versioned App Graph
- Workload Graph
The Display section in the lower-left corner of the interface lets you customize graph details. You can enable:
- Request rate
- Request distribution (traffic percentages between services)
- Response time on traffic arrows
- Cluster boxes and namespace boxes
- Traffic animation (animate traffic flow)
- Service badges (alert for missing sidecars or circuit breakers)
Below is an enhanced view of the service mesh graph with additional display options:
Removing Fault Injection
After observing the initial behavior, remove the fault injection rule. As you apply the update, you'll notice red error indicators disappearing and the details service transitioning to a green status.
Apply the updated VirtualService configuration without the fault injection delay:
kind: VirtualService
apiVersion: networking.istio.io/v1alpha3
metadata:
name: details
namespace: default
uid: 0ba36dc4-43e5-836f-5c8ba7f83e0
resourceVersion: '14865'
generation: 10
creationTimestamp: '2021-08-21T18:01:39Z'
annotations:
kubectl.kubernetes.io/last-applied-configuration: >
{"apiVersion":"networking.istio.io/v1alpha3","kind":"VirtualService","metadata":{"annotations":{},"name":"details","namespace":"default"},"spec":{"hosts":["details"],"http":[{"fault":{"delay":{"fixedDelay":"7s","percentage":{"value":100}}},"route":[{"destination":{"host":"details","subset":"v1"}}]}]}}
spec:
hosts:
- details
http:
- route:
- destination:
host: details
subset: v1
Simulating a Service Disruption
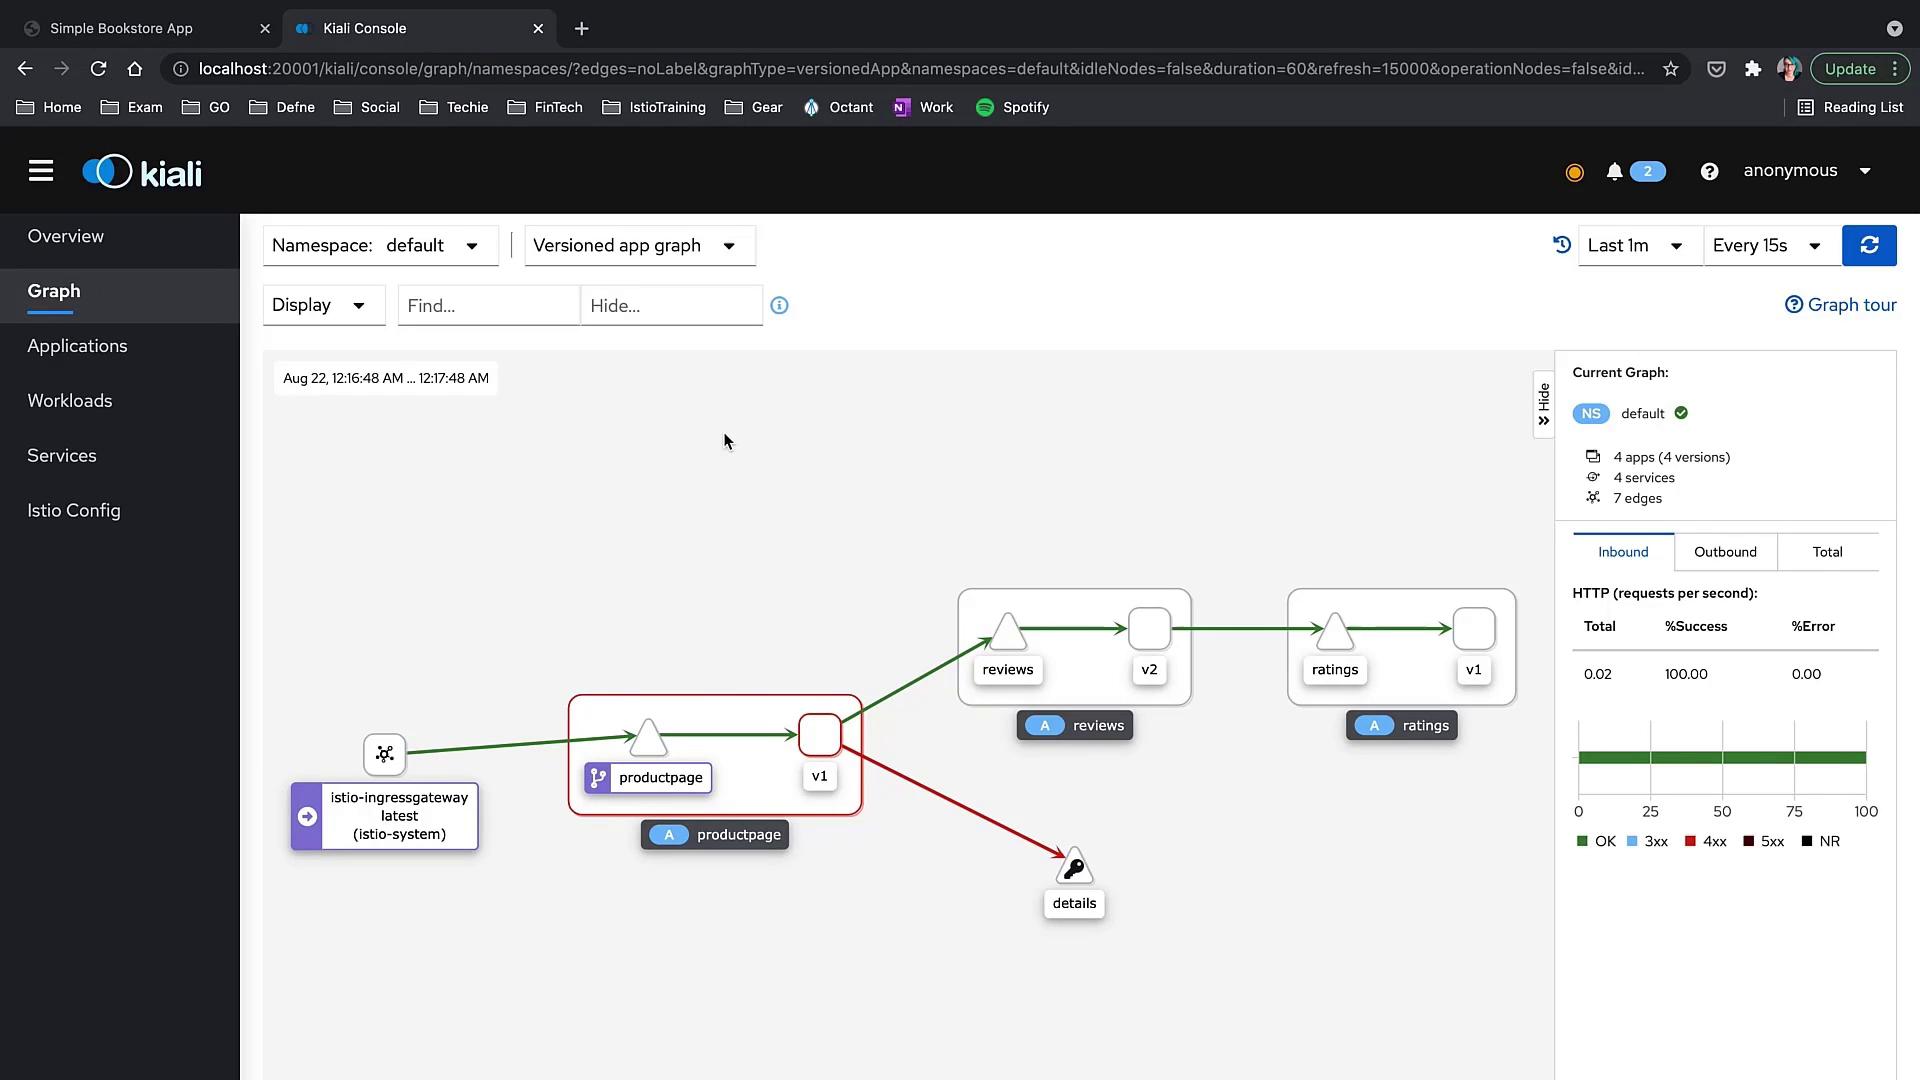
Next, pause the traffic animation and simulate an issue by deleting the review service. Run the following command:
kubectl get serv
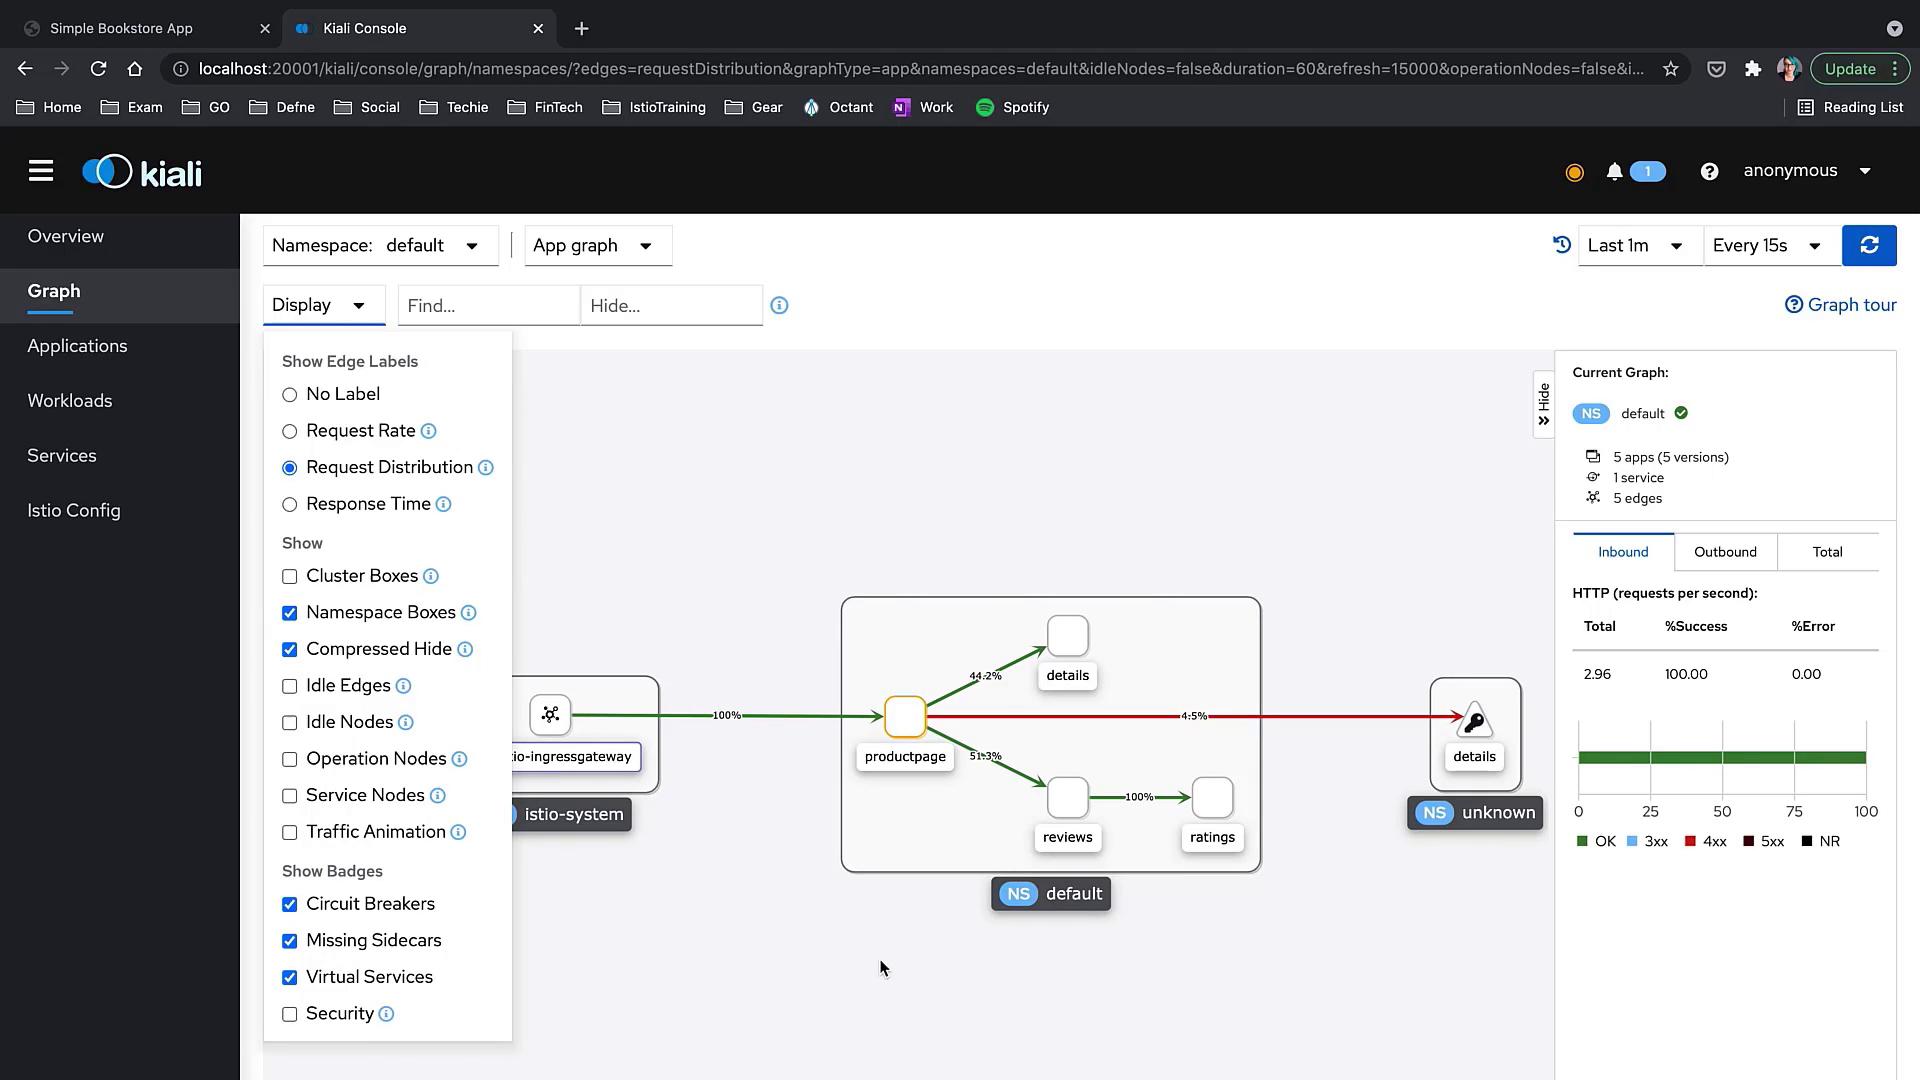
Within seconds, the graph updates to reflect the disruption. Notice the reviews service stopping traffic. After reapplying sample YAMLs, normal functioning resumes.
Pay attention to the small watch icon in the interface—this indicates replay mode. Replay mode lets you view the graph's transformation over time at customizable speeds, making it easier to identify and troubleshoot transient issues.
Double-clicking a service node (e.g., "reviews") brings you to a detailed view of that service, including tabs for Traffic, Inbound Metrics, and Traces.
Analyzing Traffic Metrics
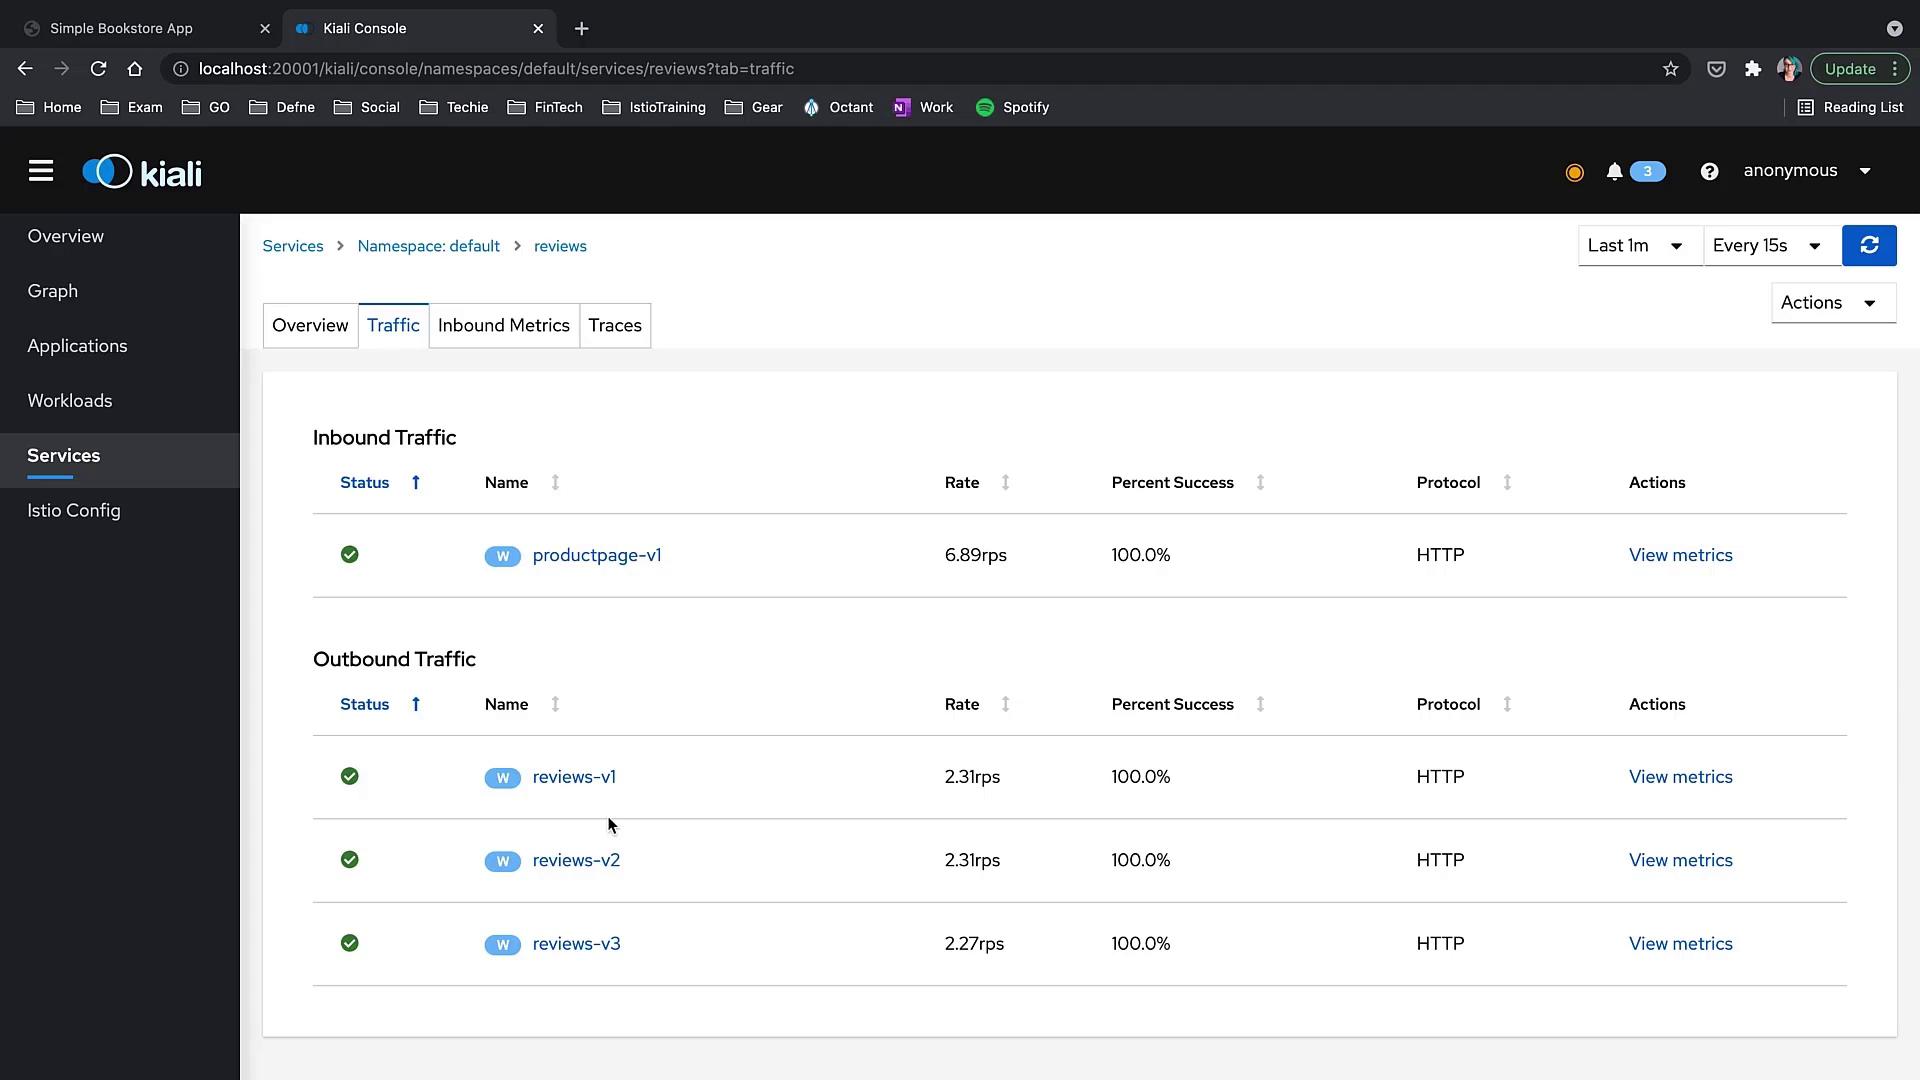
In the Traffic tab, you can evaluate both inbound and outbound traffic details, including data on rate, success percentage, protocol, and links to detailed metrics. Here is an example of the reviews service traffic metrics interface:
Workload Logs and Metrics
From the service details page, you can navigate to an outbound workload page presenting:
- Traffic details
- Logs from the workload
Below is a sample snippet from the workload logs:
[2021-08-21T22:06:20.542] "GET /reviews/0 HTTP/1.1" 200 - via_upstream "curl/7.64.1" 200 295 1 0 "curl/7.64.1" "352a6351-9524-5bfd-b229-39ef9b23bba"
[2021-08-21T22:06:21.243] "GET /reviews/0 HTTP/1.1" 200 - via_upstream "curl/7.64.1" 200 295 1 0 "curl/7.64.1" "4c76b6d-1be0-9eb5-ab4d-27401319a83d"
[2021-08-21T22:06:21.261] "GET /reviews/0 HTTP/1.1" 200 - via_upstream "curl/7.64.1" 200 295 1 0 "curl/7.64.1" "03b1da0a-11c9-94f3-6f05e167a020"
[2021-08-21T22:06:21.262] "GET /reviews/0 HTTP/1.1" 200 - via_upstream "curl/7.64.1" 200 295 1 0 "curl/7.64.1" "e3f7b72c-8922-4a58-5e86-725b11ec6d94"
[2021-08-21T22:06:21.385] "GET /reviews/0 HTTP/1.1" 200 - via_upstream "curl/7.64.1" 200 295 1 0 "curl/7.64.1" "c8b8d00-1169-93d5-be12-0d79ead15d2a"
[2021-08-21T22:06:22.367] "GET /reviews/0 HTTP/1.1" 200 - via_upstream "curl/7.64.1" 200 295 2 1 "curl/7.64.1" "5e64b939-4e5c-4f92-a75b-7c7b2e09ea04"
[2021-08-21T22:06:22.384] "GET /reviews/0 HTTP/1.1" 200 - via_upstream "curl/7.64.1" 200 295 2 1 "curl/7.64.1" "5297d9e-9029-9b51-b816-1e922dfac368"
[2021-08-21T22:06:22.402] "GET /reviews/0 HTTP/1.1" 200 - via_upstream "curl/7.64.1" 200 295 1 0 "curl/7.64.1" "8c07f639-4039-9b51-8e12-3c6f80c6ace2"
[2021-08-21T22:06:23.523] "GET /reviews/0 HTTP/1.1" 200 - via_upstream "curl/7.64.1" 200 295 1 0 "curl/7.64.1" "bda1c4e3-3460-9648-a2b7-62b71f76c5b5"
[2021-08-21T22:06:23.652] "GET /reviews/0 HTTP/1.1" 200 - via_upstream "curl/7.64.1" 200 295 1 0 "curl/7.64.1" "a4291c9c-b273-98ed-6a18b3048942"
[2021-08-21T22:06:26.896] "GET /reviews/0 HTTP/1.1" 200 - via_upstream "curl/7.64.1" 200 295 1 0 "curl/7.64.1" "33eab8dc-6b68-469b-ae3c-68657dcd58cf"
The interface also allows you to filter logs by Istio proxy and application container, monitor inbound metrics (like request volume, duration, throughput, and size), and view TCP metrics when available. Outbound metrics and traces are displayed similarly, with visual indicators for healthy (green) and problematic (red) statuses.
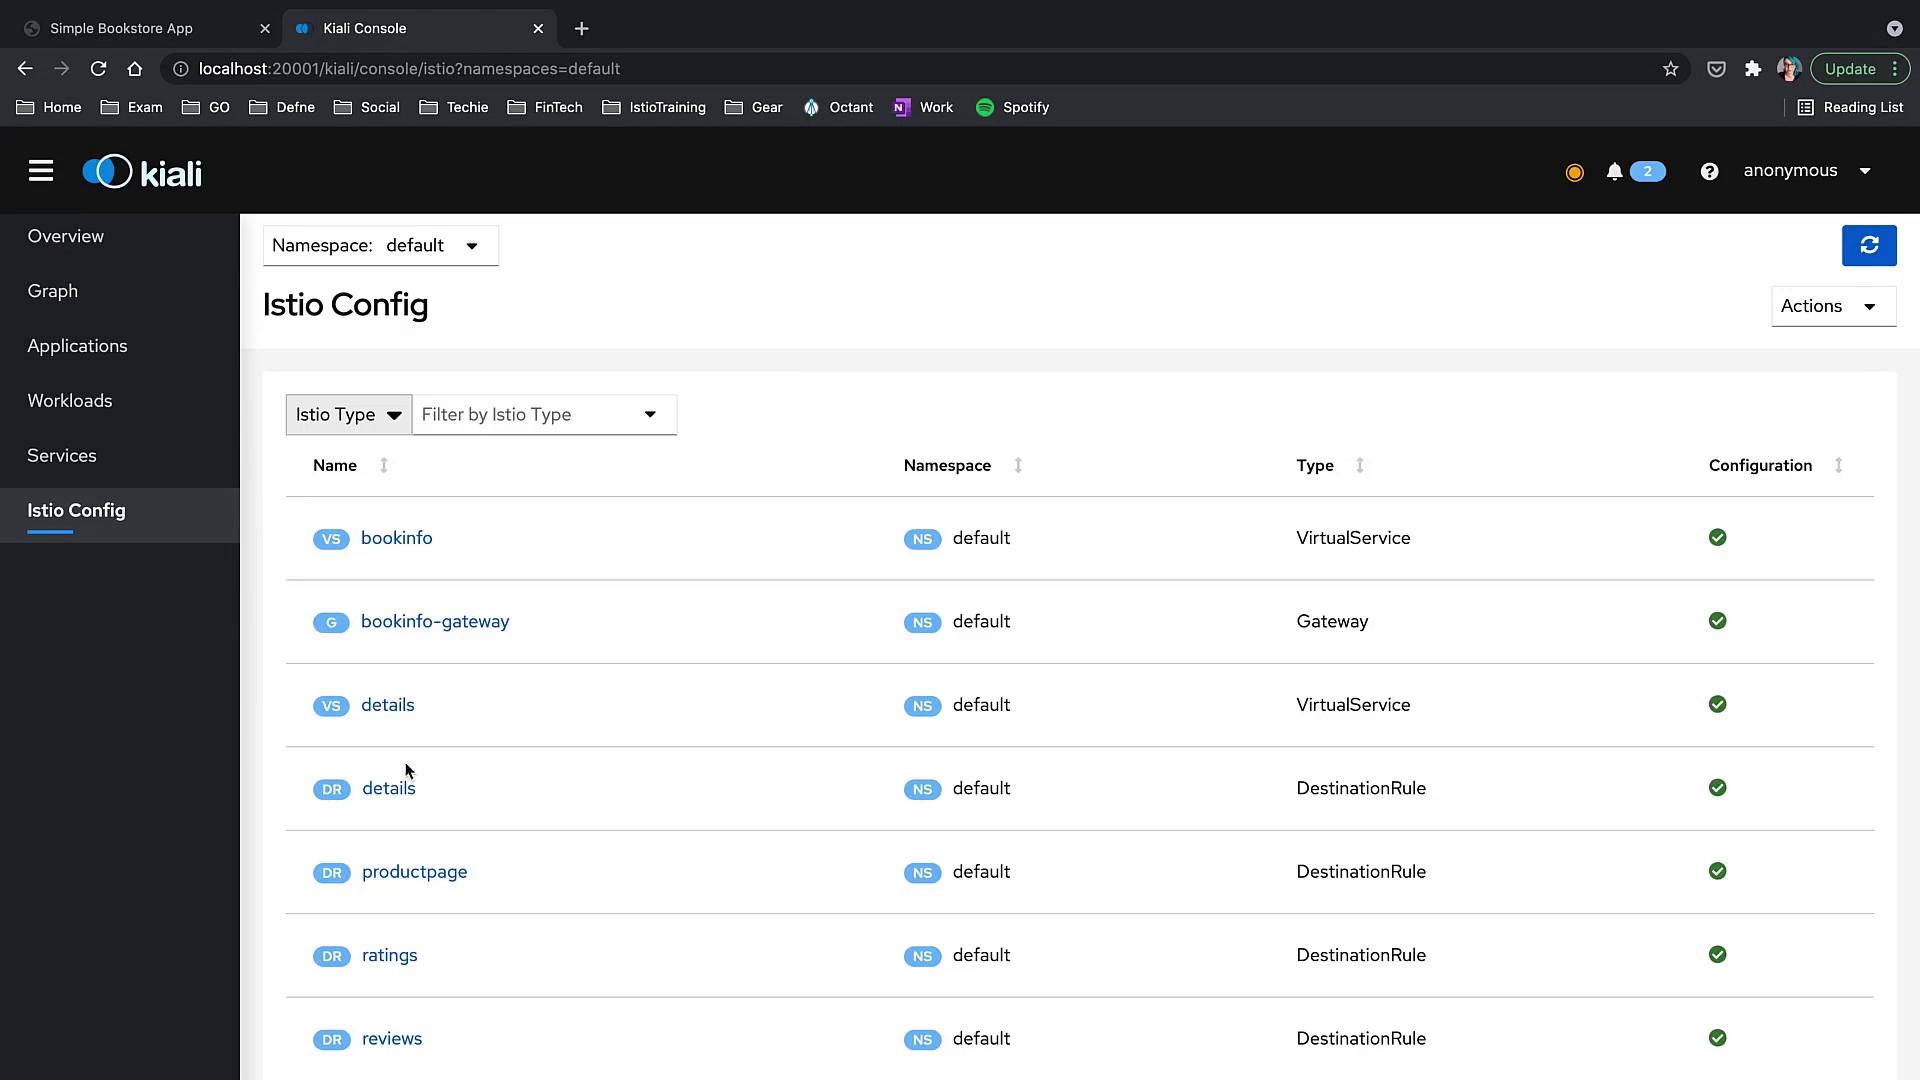
Reviewing Istio Configuration
Kiali's Istio Config section simplifies the management and validation of Istio objects. It enhances your workflow with features that go beyond basic YAML application via kubectl. You can quickly filter and navigate through Istio configuration objects such as Virtual Services and Gateways.
Additionally, Kiali provides wizards to help you create configurations without editing raw YAML. For example, here is a sample DestinationRule for the reviews service:
kind: DestinationRule
apiVersion: networking.istio.io/v1alpha3
metadata:
name: reviews
namespace: default
uid: badf8e8c-4c53-43bf-8855-e2a5c0c73b
resourceVersion: '1488'
generation: 1
creationTimestamp: '2021-08-21T17:55:36Z'
annotations:
kubectl.kubernetes.io/last-applied-configuration: >
{"apiVersion":"networking.istio.io/v1alpha3","kind":"DestinationRule","metadata":{"annotations":{},"name":"reviews","namespace":"default"},"spec":{"host":"reviews","subsets":[{"labels":{"version":"v1"},"name":"v1"},{"labels":{"version":"v2"},"name":"v2"},{"labels":{"version":"v3"},"name":"v3"}]}}
spec:
host: reviews
subsets:
- labels:
version: v1
name: v1
- labels:
version: v2
name: v2
- labels:
version: v3
name: v3
Tip
Using Kiali wizards to create Istio configurations minimizes manual errors and ensures your service mesh definitions are validated in real-time.
Conclusion
Kiali provides a powerful graphical and configuration toolset to manage and monitor your Istio service mesh. By using its detailed views, real-time metrics, and configuration wizards, you can quickly identify and resolve issues within your mesh. For additional information and further learning, visit Kiali's Official Website.
Explore all the interesting features of Kiali and enhance your observability and management of your service mesh today!
Watch Video
Watch video content