This lesson explores the Build Monitor View plugin for Jenkins, providing a clear view of job status and progress with automatic updates.
This lesson explores the Build Monitor View plugin for Jenkins, a powerful tool that offers a clear view of the status and progress of selected Jenkins jobs. The view refreshes automatically every few seconds, even displaying the user responsible for each job when applicable.
Before you begin, ensure that the Build Monitor View plugin is installed and that your Jenkins controller has been restarted.Follow these steps to set up a new view:
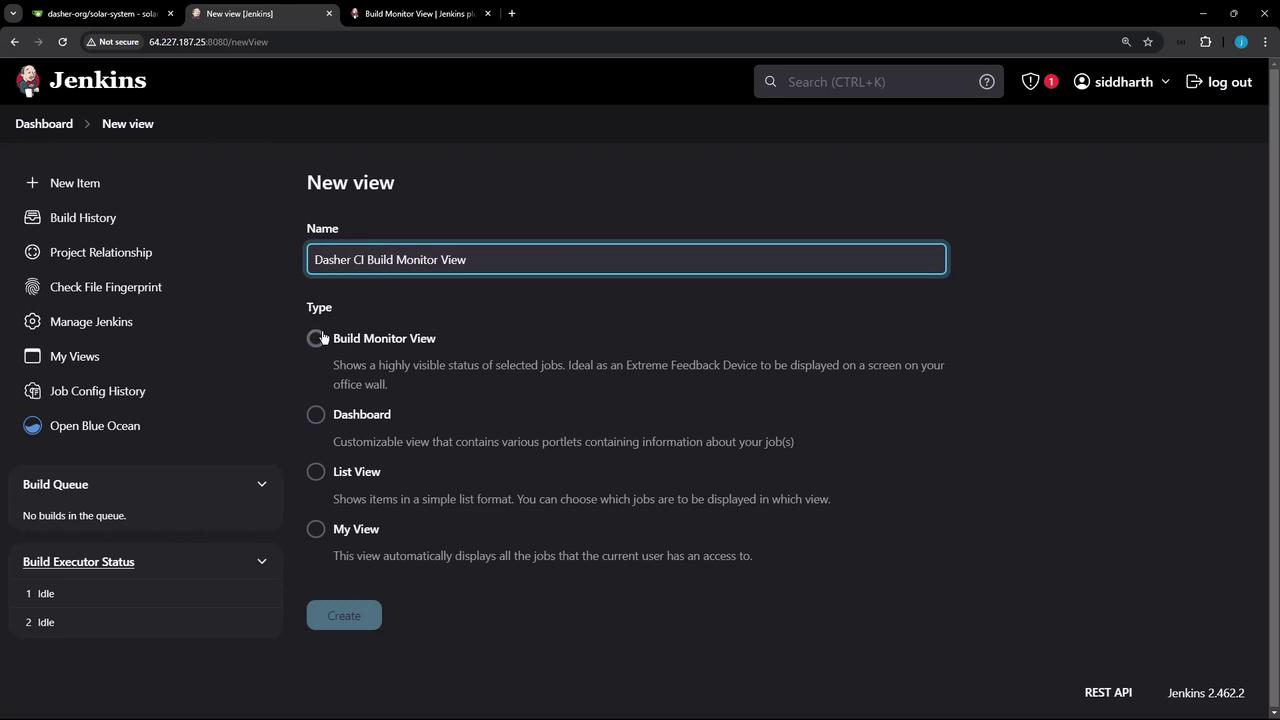
Navigate to the Jenkins dashboard and click “New View.”
Enter a unique view name (for example, “Build Monitor View” or “Dashboard CI Build Monitor View”).
Select the appropriate view type and click “Create.”
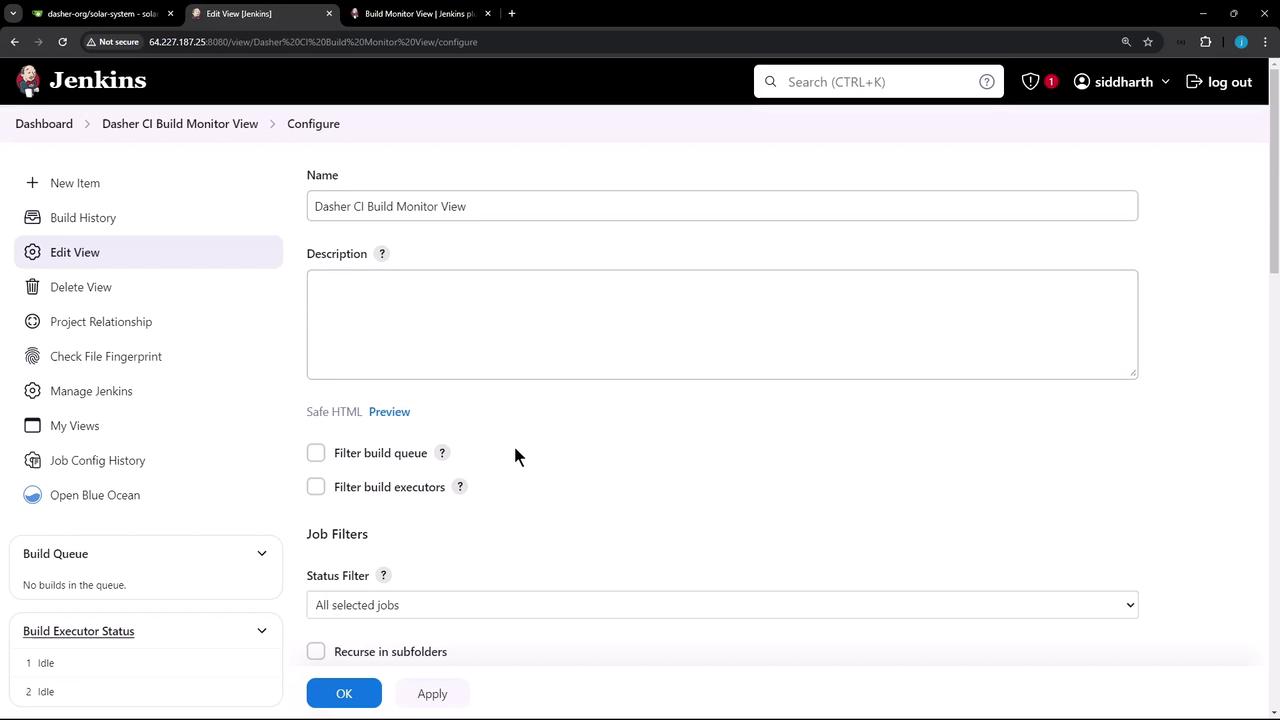
Next, provide a description and define filters. You can choose to display all jobs or use a regex pattern to dynamically monitor a specific subset of jobs.
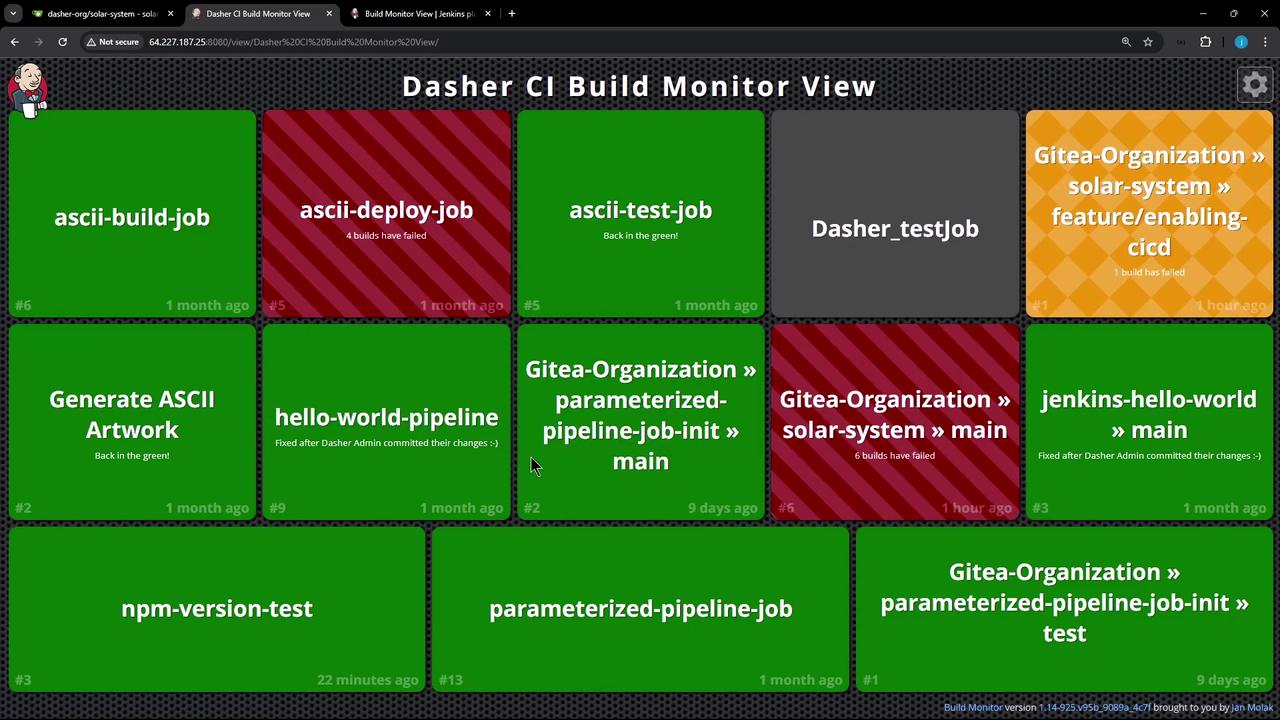
After configuring the filter options, click “Apply” to save your settings. The view will now showcase your selected jobs. You can adjust the display settings directly through the user interface—for example:
Increasing text scale
Changing the number of columns (from one up to four)
Enabling colorblind mode
Reducing motion
Displaying badges
Resetting to the default settings
Additionally, when a job is running, the view integrates with the Pipeline plugin to display the current stage name and the elapsed time (for example, during a sleep stage).
Green tiles indicate successful builds, while red signifies failures.
Testing the Build Monitor View with a Pipeline Job
To see the Build Monitor View in action, create a new Jenkins pipeline job to simulate a build process.
Create a new job by clicking “New Item” and selecting “Pipeline.”
In the pipeline script, define a simple “Hello World” stage along with another stage that pauses for 60 seconds.
Below is an initial pipeline script example:
Copy
pipeline { agent any stages { stage('Hello') { steps { echo 'Hello World' } } stage('Hello') { // Duplicate stage name; will be corrected below. steps { sh 'sleep' } } }}
After noticing the duplicate stage name, update the script to assign unique names to each stage. For example, rename the second stage from “Hello” to “Sleep for” as shown below:
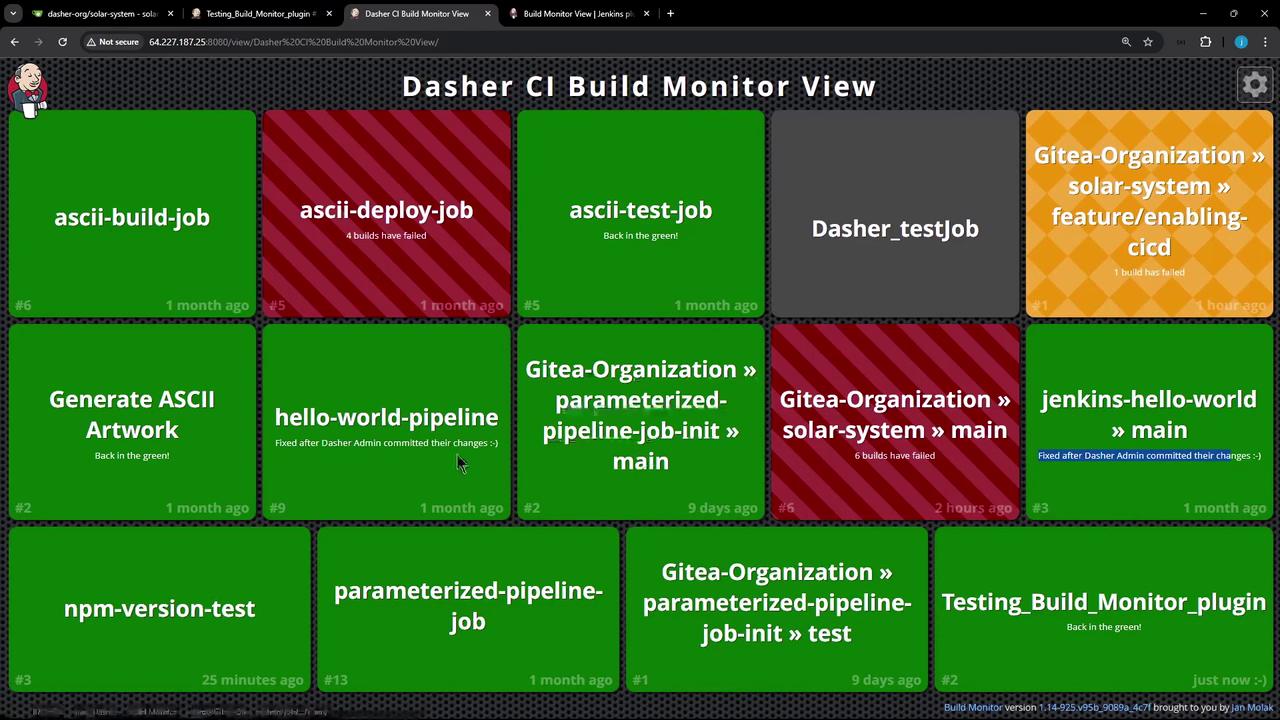
Save and build the job. This triggers the pipeline to run both stages. As the “Sleep for” stage executes, the Build Monitor View updates automatically to show the current stage name, stage ID, and elapsed time. When the stage completes successfully, the corresponding tile turns green.Below is a sample snippet of the console output during the build:
Copy
Started by user siddharth[Pipeline] Start of Pipeline[Pipeline] nodeRunning on Jenkins in /var/lib/jenkins/workspace/Testing_Build_Monitor_plugin[Pipeline] {[Pipeline] stage[Pipeline] { (Hello)[Pipeline] echoHello World[Pipeline] }[Pipeline] // stage[Pipeline] stage[Pipeline] { (Sleep for 60s)[Pipeline] sh+ sleep 60
After approximately 60 seconds, when the pipeline completes, the monitor view updates the job status to green. The view also provides additional details such as the build cause (e.g., “Started by user siddharth”) and branch information.
This plugin streamlines monitoring by aggregating the status and details of multiple Jenkins jobs on a single screen.
Thank you for reading this article. For further information, refer to the Jenkins Documentation for more details on advanced configurations and usage scenarios.