Jenkins Pipelines
Kubernetes and GitOps
DAST and Manual Input
In this guide, we will demonstrate how to configure multiple stages in your CI/CD pipeline that accept manual user input and perform Dynamic Application Security Testing (DAST).
Overview of DAST
Dynamic Application Security Testing (DAST) is an essential method for identifying vulnerabilities before an application goes live. DAST tools automatically scan web interfaces and APIs for common security issues such as SQL injection, cross-site scripting, and more. Unlike static analysis, which reviews source code without execution, DAST requires the application to be running so that it can inject malicious payloads and reveal potential exploits.
There are various tools available for DAST, ranging from open-source solutions to commercial products. In our example, we are utilizing the open-source tool OWASP ZAP (Zed Attack Proxy), one of the most popular options. Commercial alternatives include Netsparker and Burp Suite.
Using ZAP with Docker
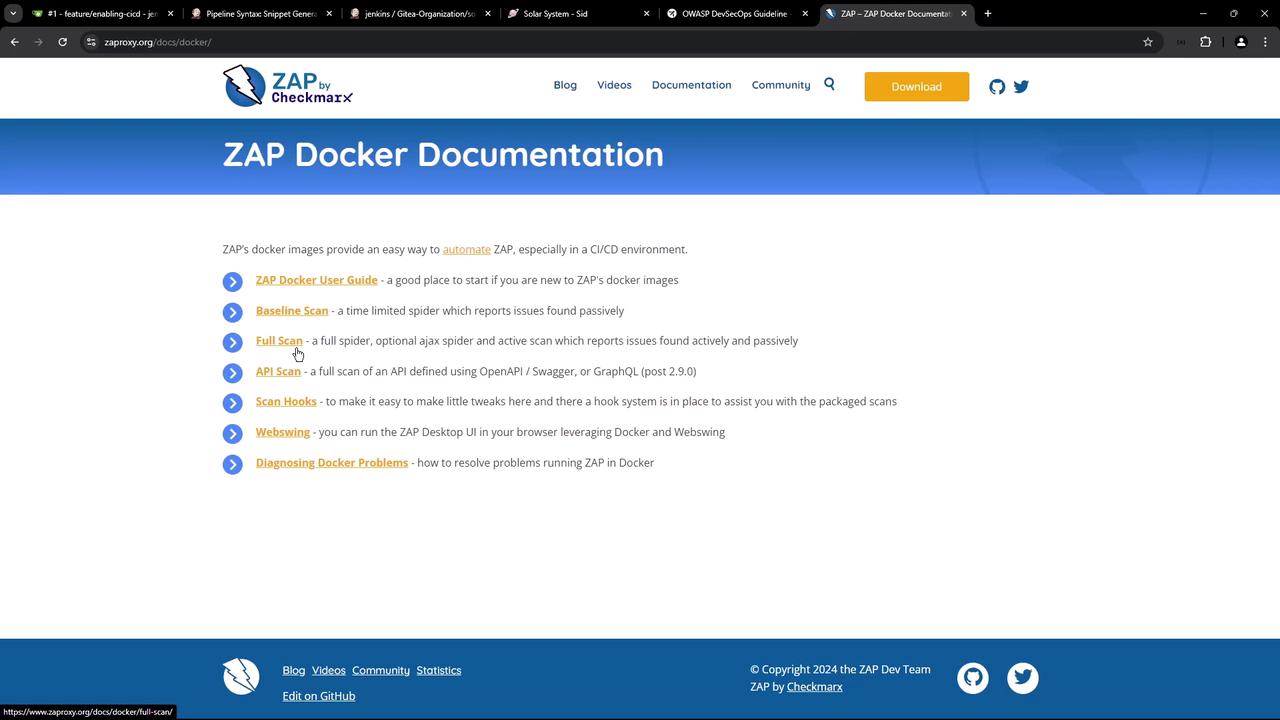
ZAP can be easily integrated into a CI/CD environment using Docker images. Different Docker images are provided for various scanning needs:
- Baseline Scan: A time-limited, passive scan that reports issues.
- Full Scan: Combines both active and passive scanning, using tools like Ajax spider, SpyDdos, and ActiveScan.
- API Scan: Performs a comprehensive scan of an API based on its specification (OpenAPI, GraphQL, or SOAP).
For this demo, we will perform an API scan. The API scan script accepts a target API definition (via a URL or local file) along with a format specification (e.g., openapi) and generates reports in HTML, Markdown, JSON, and XML formats.
The usage of the scan script is described below:
Usage: zap-api-scan.py -t <target> -f <format> [options]
-t target Target API definition (OpenAPI/Soap) as a local file or URL, e.g., https://www.example.com/openapi.json,
or target endpoint URL for GraphQL, e.g., https://www.example.com/graphql.
-f format OpenAPI, soap, or graphql
-h Print this help message
-c config_file Config file to use to INFO, IGNORE or FAIL warnings
--config_url URL of config file to use to INFO, IGNORE or FAIL warnings
-g gen_file Generate default config file (all rules set to WARN)
-r report_html File to write the full ZAP HTML report
-r report_md File to write the full ZAP Markdown report
-r report_xml File to write the full ZAP XML report
-r report_json File to write the full ZAP JSON report
-d Show debug messages
-p port Specify listen port
-D Delay in seconds to wait for passive scanning
-P Do not fail on warning (post 2.9.0)
Note
If URLs return unexpected content types, the script raises corresponding alerts. For more information on available options, please refer to the usage message above.
Configuring DAST in the Jenkins Pipeline
The following snippet from a Jenkinsfile illustrates how to configure the DAST stage using ZAP running in Docker. In this stage, a Docker container is executed to run an API scan against your application's OpenAPI specification, typically served from the /api-docs
endpoint.
Jenkinsfile Stage for DAST
stage('DAST - OWASP ZAP') {
when {
branch 'PR*'
}
steps {
sh '''
##### REPLACE below with Kubernetes http://IP_Address:30000/api-docs/ #####
chmod 777 $(pwd)
docker run -v $(pwd):/zap/wrk/:rw ghcr.io/zaproxy/zap-api-scan.py \
-t http://134.209.155.222:30000/api-docs/ \
-f openapi \
-r zap_report.html \
-w zap_report.md \
-J zap_json_report.json \
-x zap_xml_report.xml
'''
}
}
Note
The command chmod 777 $(pwd)
ensures that the generated reports have appropriate permissions, allowing them to be copied from the Docker container to the current working directory. Make sure to replace the target URL with your actual Kubernetes endpoint.
API Documentation
Before starting the scan, verify that the /api-docs
endpoint correctly returns your API's OpenAPI specification. Below is a sample JSON output:
{
"openapi": "3.0.0",
"info": {
"title": "Solar System API",
"version": "1.0"
},
"paths": {
"/": {
"get": {
"responses": {
"200": {
"description": "",
"content": {
"text/plain": {
"schema": {
"example": "Example",
"type": "string"
}
}
}
}
}
}
},
"/live": {
"get": {
"responses": {
"200": {
"description": "",
"content": {
"text/plain": {
"schema": {
"example": "Example",
"type": "string"
}
}
}
}
}
}
}
}
}
This JSON specification is also available in the repository as OAS.json
.
Integrating Manual Approval
To ensure that the DAST scan runs against the latest version of the application, we introduce a manual approval stage. This stage pauses the pipeline until a user verifies that the pull request has been merged and the application has been synchronized (typically via Argo CD).
Jenkins Pipeline Stages Overview
stage('Integration Testing - [Amazon Elastic Compute Cloud (EC2)](https://learn.kodekloud.com/user/courses/amazon-elastic-compute-cloud-ec2)') {
// Integration test steps
}
stage('K8S - Update Image Tag') {
// Update Docker image tag in Kubernetes deployment
}
stage('K8S - Raise PR') {
// Raise a pull request for the update
}
stage('App Deployed') {
when {
branch 'PR*'
}
steps {
timeout(time: 1, unit: 'DAYS') {
input message: 'Is the PR merged and is the Argo CD application synced?', ok: 'Yes, PR merged & Argo CD synced'
}
}
}
stage('DAST - OWASP ZAP') {
// DAST stage executed after confirmation
}
The "App Deployed" stage employs a Jenkins input step with a timeout to ensure that the DAST scan is only executed after the application has been updated.
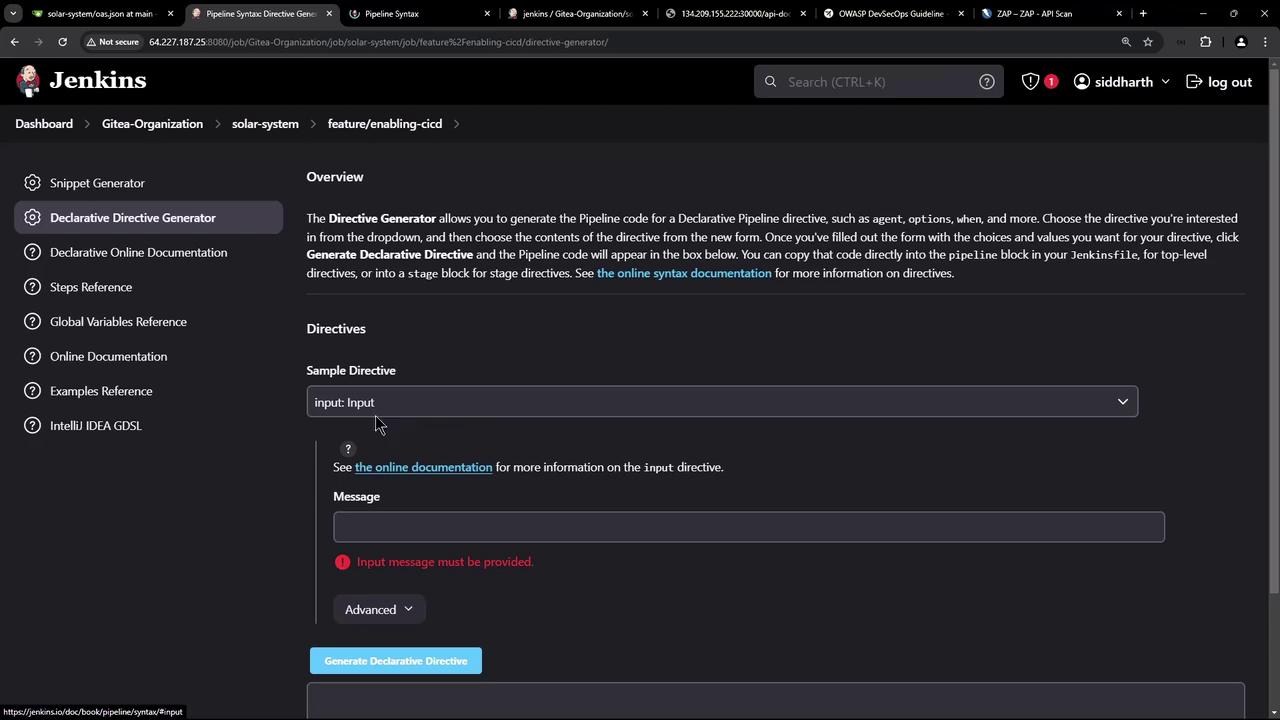
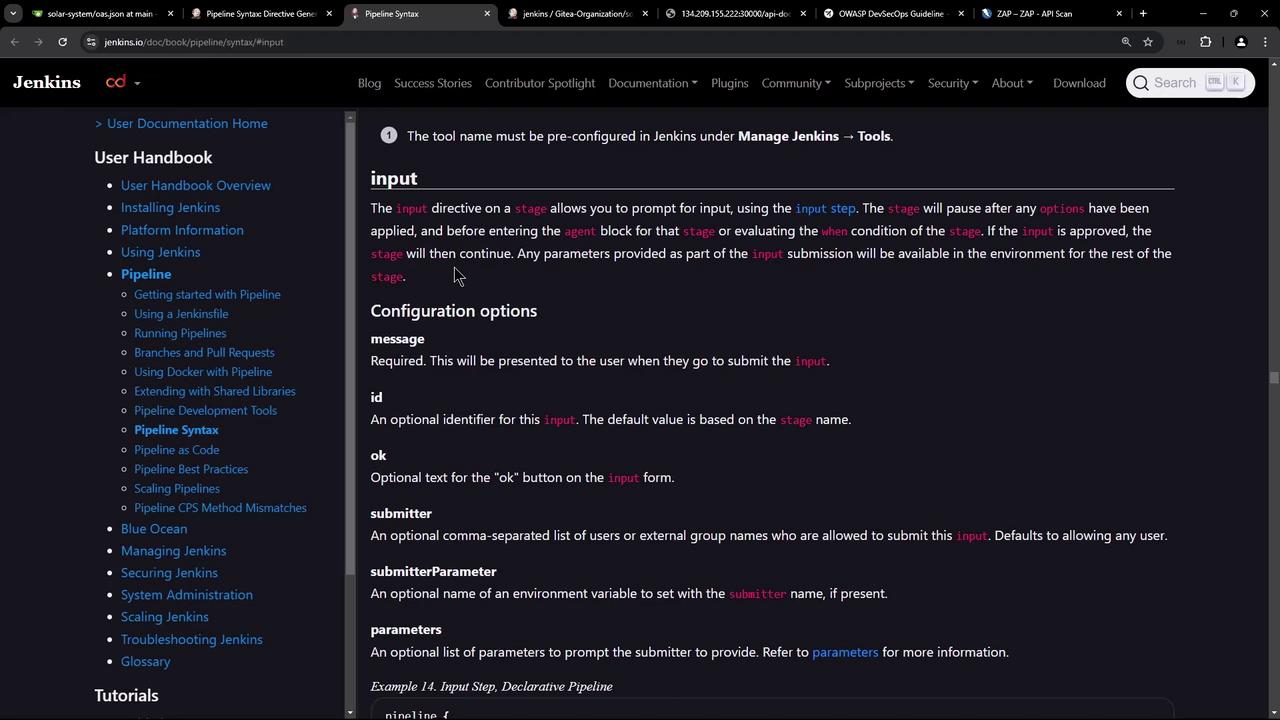
Example of the Input Step in Jenkins
When the pipeline reaches the input step, a prompt is displayed asking for confirmation before proceeding. The screenshots below illustrate examples of the Jenkins interface for input configuration:
If there's an error or a required input is missing, Jenkins will display an appropriate error message:
For more details on configuring the input directive, refer to the Jenkins documentation.
The Complete Flow
The complete CI/CD flow is as follows:
- Application Deployment: The latest changes are deployed using a GitOps approach. A pull request (PR) is created, manually merged, and synchronized via Argo CD.
- Manual Approval: The pipeline pauses at the "App Deployed" stage, awaiting confirmation that the PR is merged and the deployment is updated.
- DAST Execution: After approval, the "DAST - OWASP ZAP" stage is executed. The Docker container scans the API (served at
/api-docs
) according to the OpenAPI specification. - Results and Reporting: The scan generates multiple reports (HTML, Markdown, JSON, XML). Note that while tests may pass, warnings such as unexpected content types can trigger a non-zero exit code, causing the stage to fail until resolved.
Here’s an example of the final Docker command that outputs the scan logs:
chmod 777 $(pwd)
docker run -v $(pwd):/zap/wrk ghcr.io/zaproxy/zap-api-scan.py \
-t http://134.209.155.222:30000/api-docs/ \
-f openapi \
-r zap_report.html \
-w zap_report.md \
-J zap_json_report.json \
-x zap_xml_report.xml
Warning
If warnings are detected (e.g., unexpected content types), the scan might complete most tests successfully but still return a non-zero exit code. You can either address the warning or configure ZAP to ignore it in subsequent runs.
Thank you for following this guide to integrate DAST with manual approval into your CI/CD pipeline. This configuration not only improves security testing efficiency but also ensures that tests are run against the most recent application deployment.
Watch Video
Watch video content