Dashboard Overview
When you first access the dashboard, you might notice differences compared to previous layouts. After running several tests on the CI/CD pipeline, the updated dashboard now displays these test builds. For instance, click on “test one” to review its details. Upon selecting “test one”, you will observe that:- The pipeline is named “test one”.
- It consists of a single stage.
- That stage executed and completed successfully.
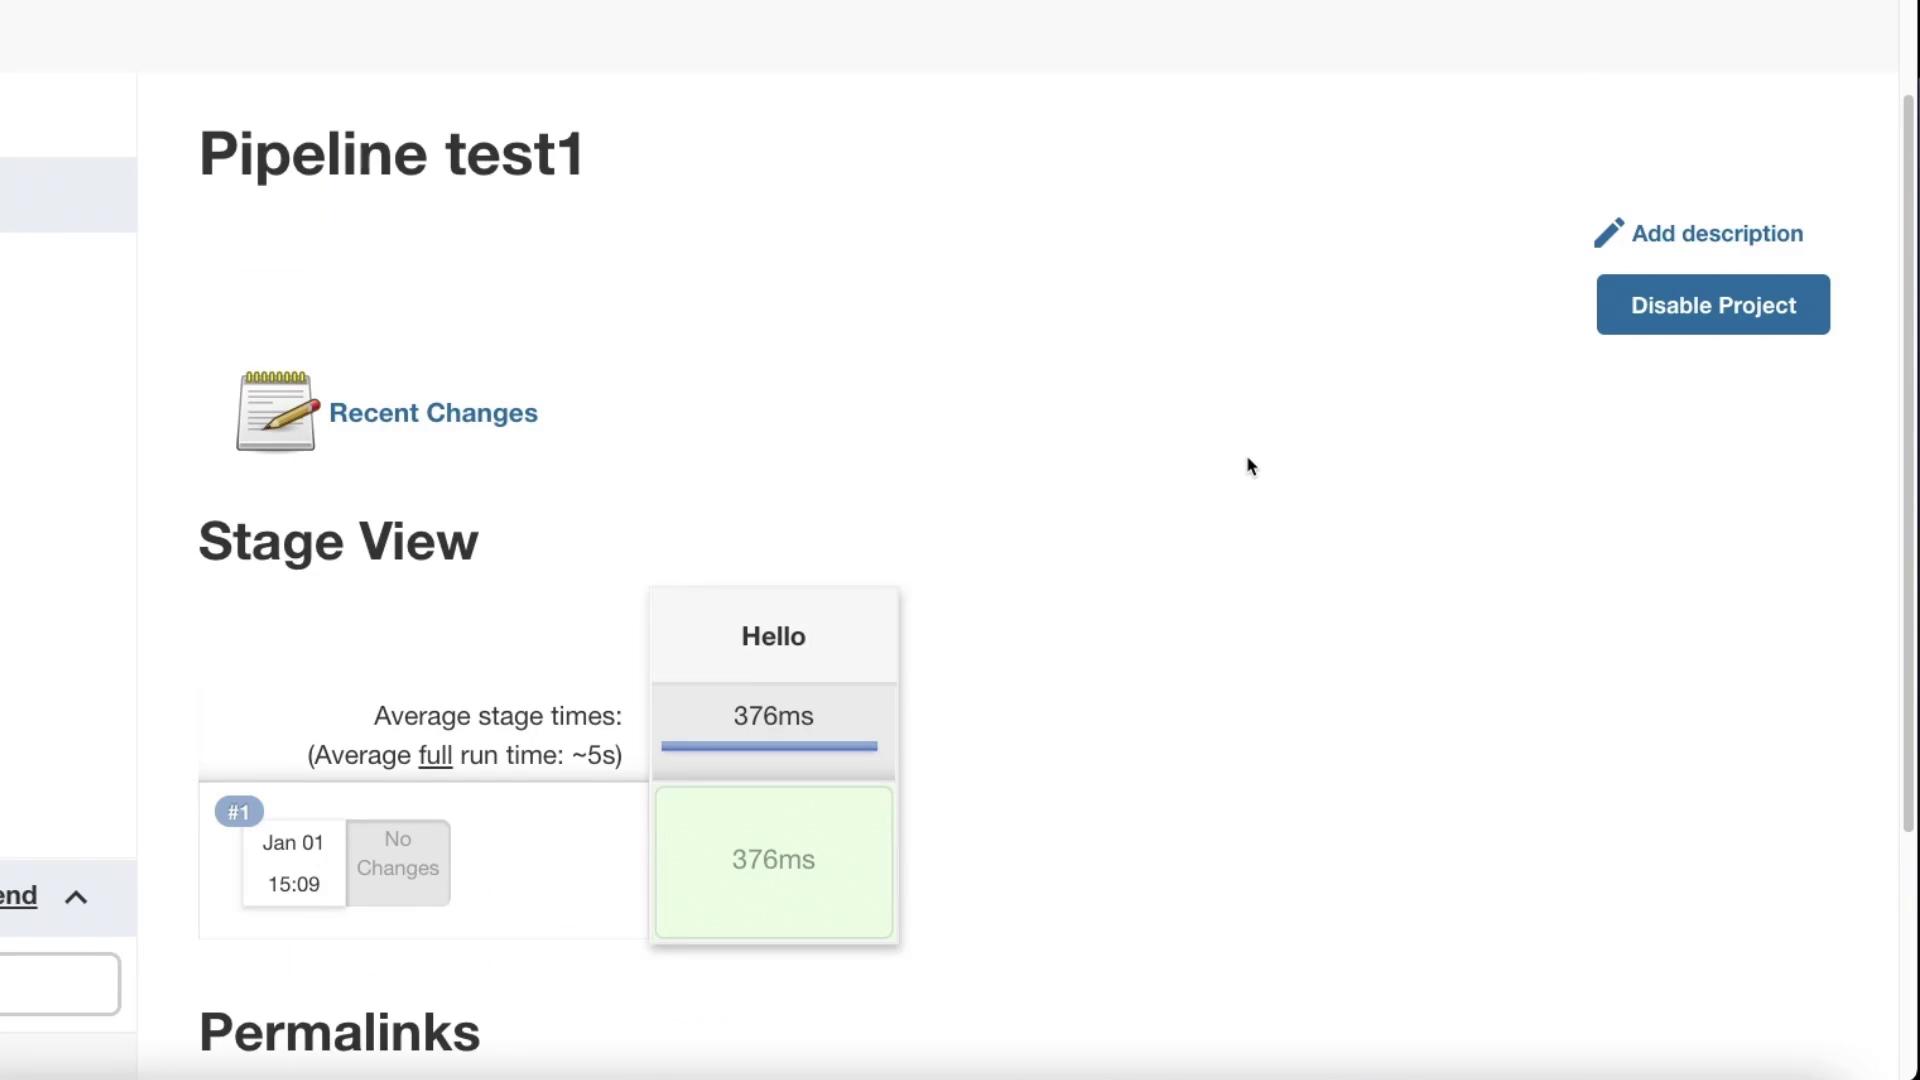
This simple pipeline run is used to quickly demonstrate how the Jenkins UI displays critical information such as build duration, failure status, and overall build history.
- Last Duration: Indicates how long the pipeline ran.
- Recent Failures: Displays the most recent failure, if any.
- Last Successful Build Timestamp: Shows when the last successful build occurred.
- Build Names and Aggregated Status: Offers an at-a-glance status report of recent builds, where a green checkmark marks a successful build and “not built” indicates a run that was skipped.
Initiating a Pipeline Build
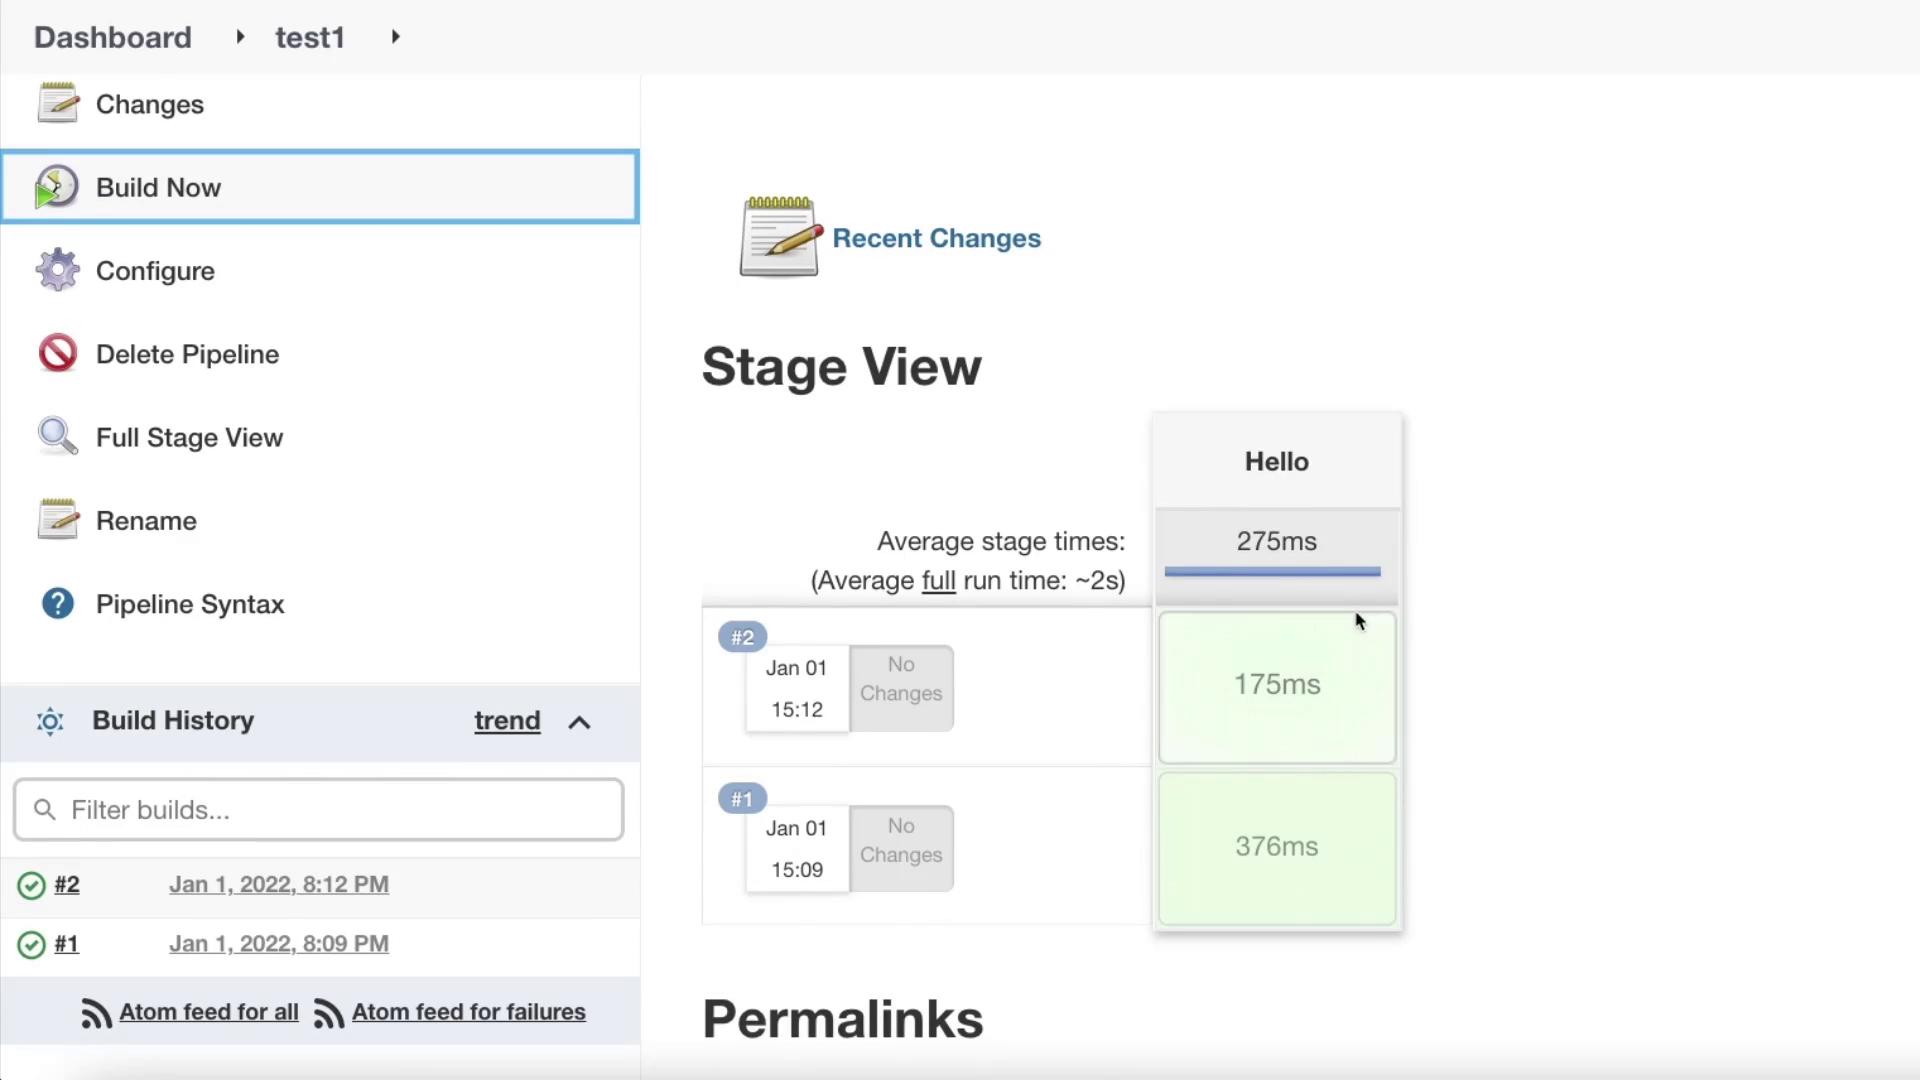
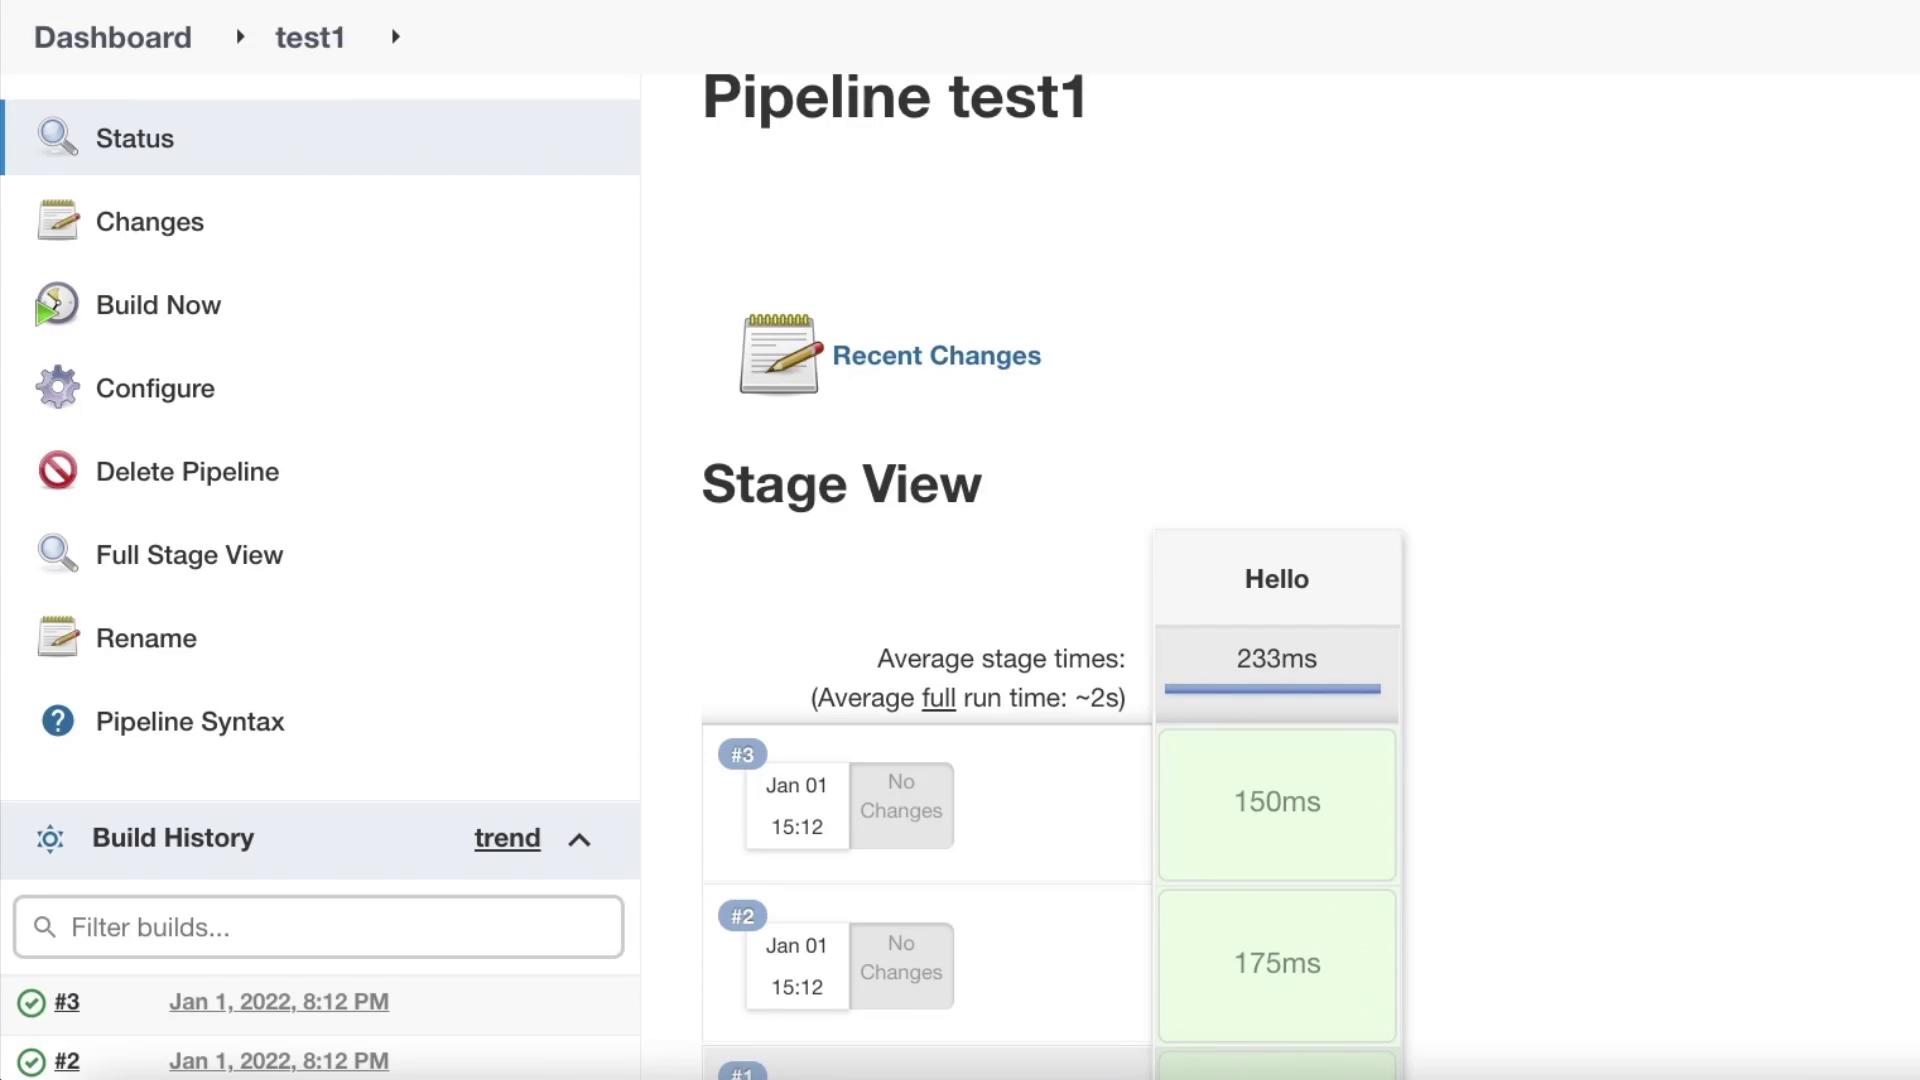
When you click on “Build Now”, a new pipeline run is triggered immediately. Notice how the dashboard reflects this change instantly: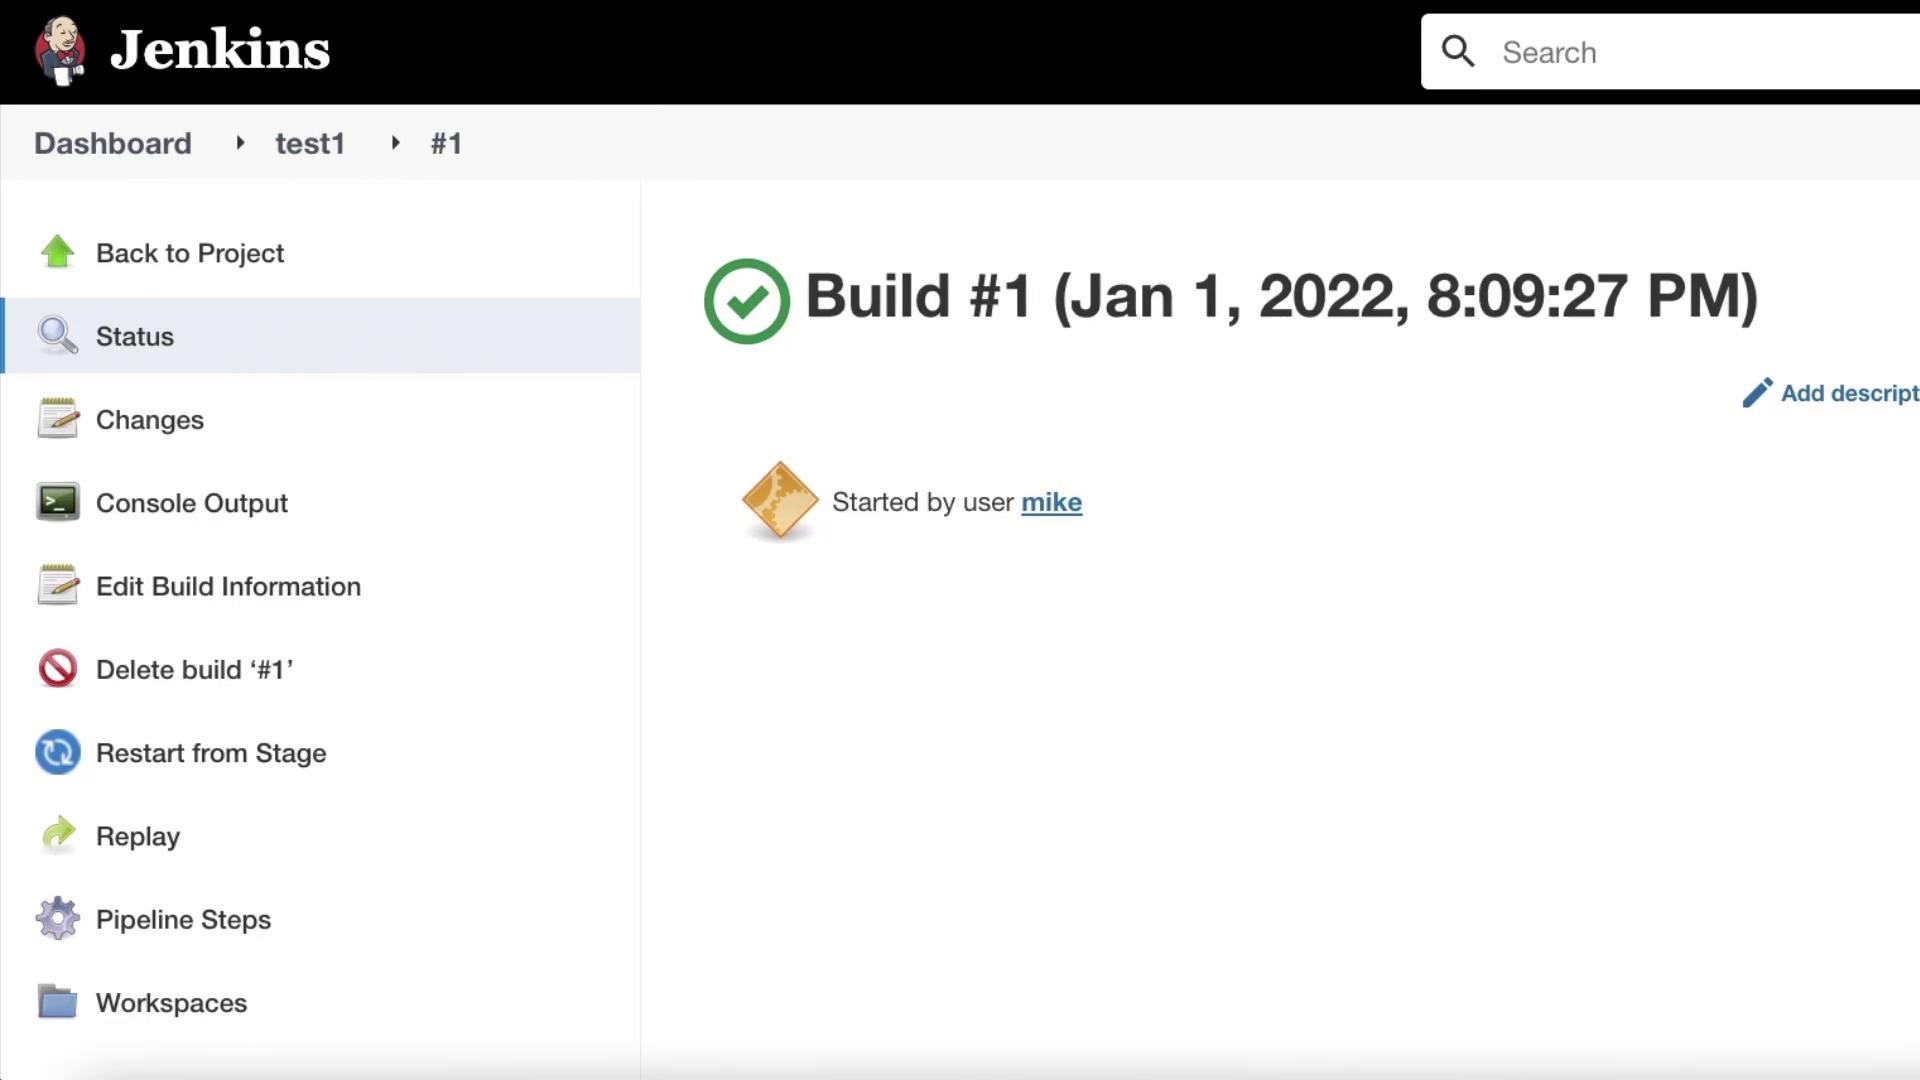
Pipeline Code Example
Below is the Groovy script used to define this simple pipeline:- What was executed.
- The current status.
- Any recent changes.
- Options to disable the job if necessary.
Conclusion
This lesson provided an overview of what your CI/CD pipelines will look like in Jenkins. You learned how to navigate the build dashboard, interpret vital details, and review the execution logs. Now, try some hands-on practice exercises to apply what you’ve learned and deepen your understanding of Jenkins pipelines.Explore additional resources such as Jenkins Documentation and CI/CD Best Practices to further enhance your skills.