This article provides an overview of the Jenkins dashboard and its key components for managing CI/CD processes.
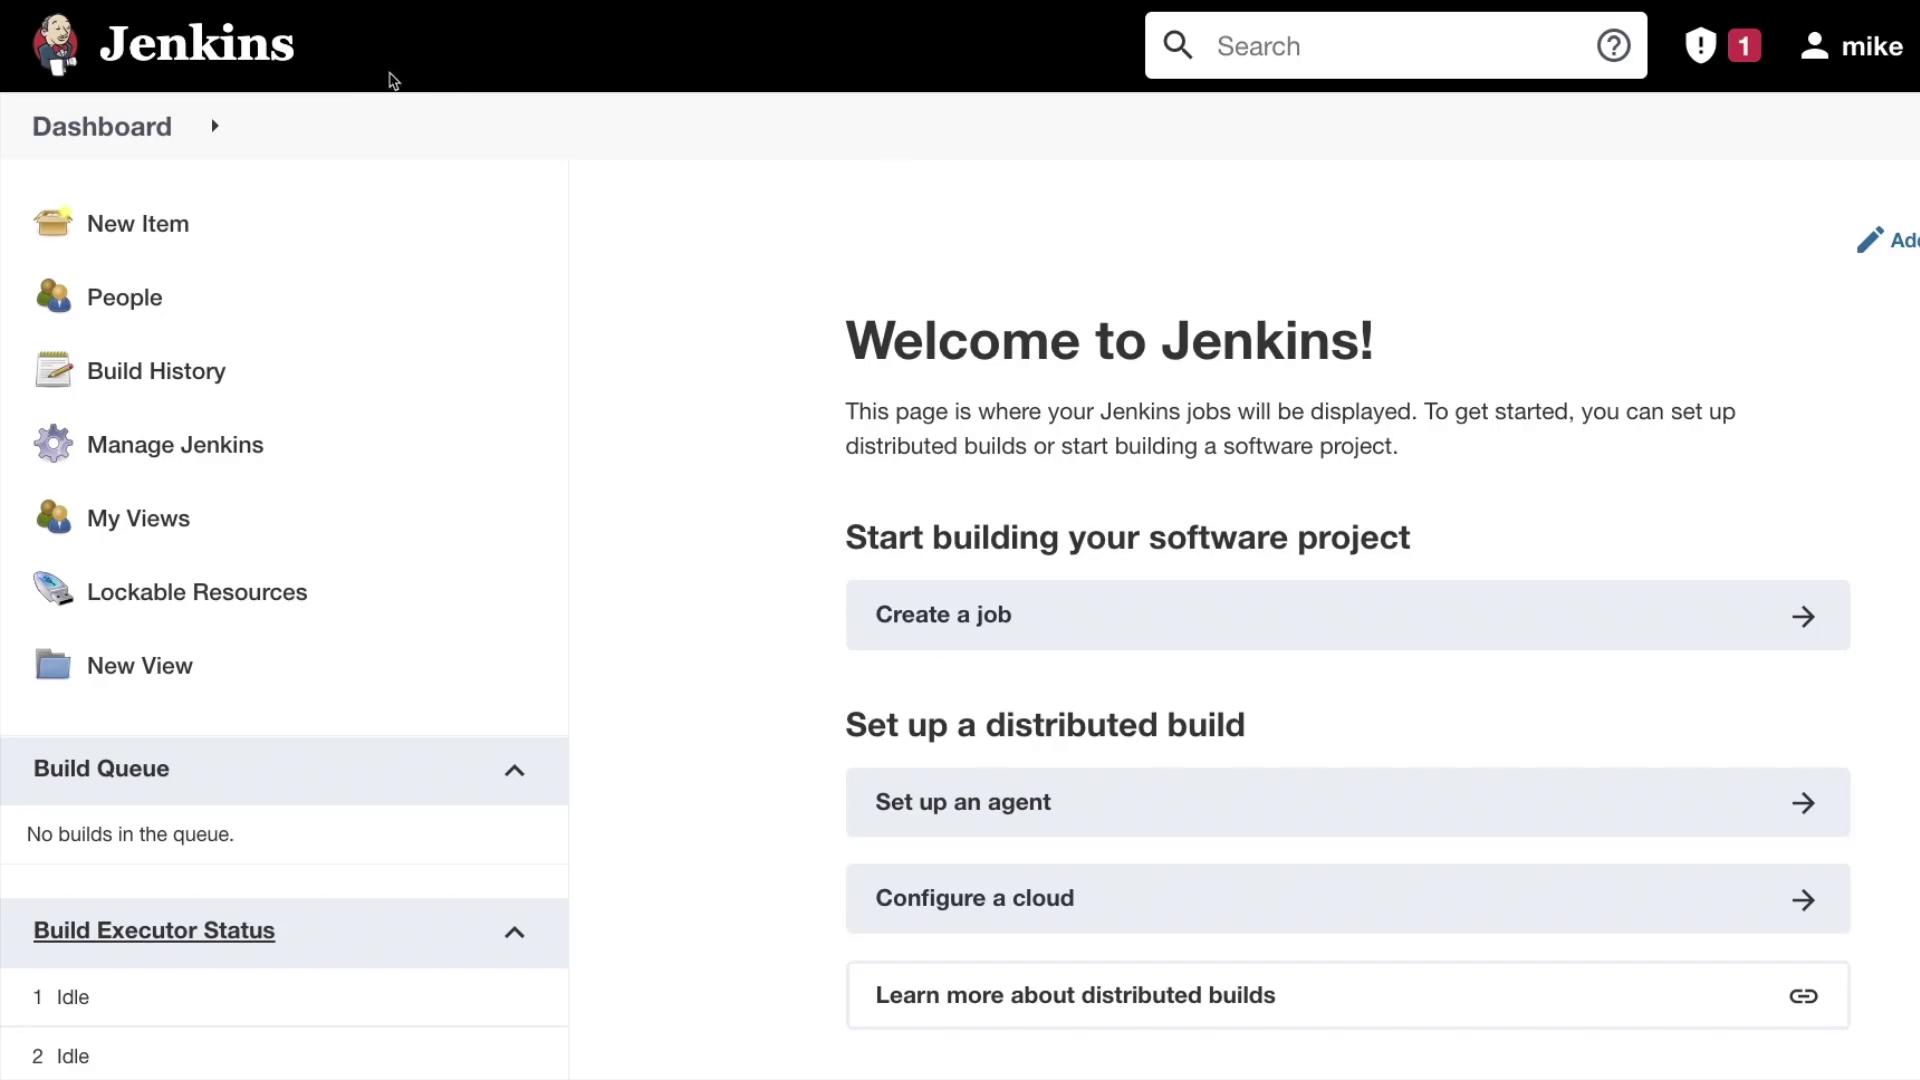
In this article, we take an in-depth look at the Jenkins dashboard and explore its key components. This guide will help you navigate through the various options available, making it easier to manage your continuous integration and continuous delivery (CI/CD) processes.Let’s start by examining the top section of the dashboard.
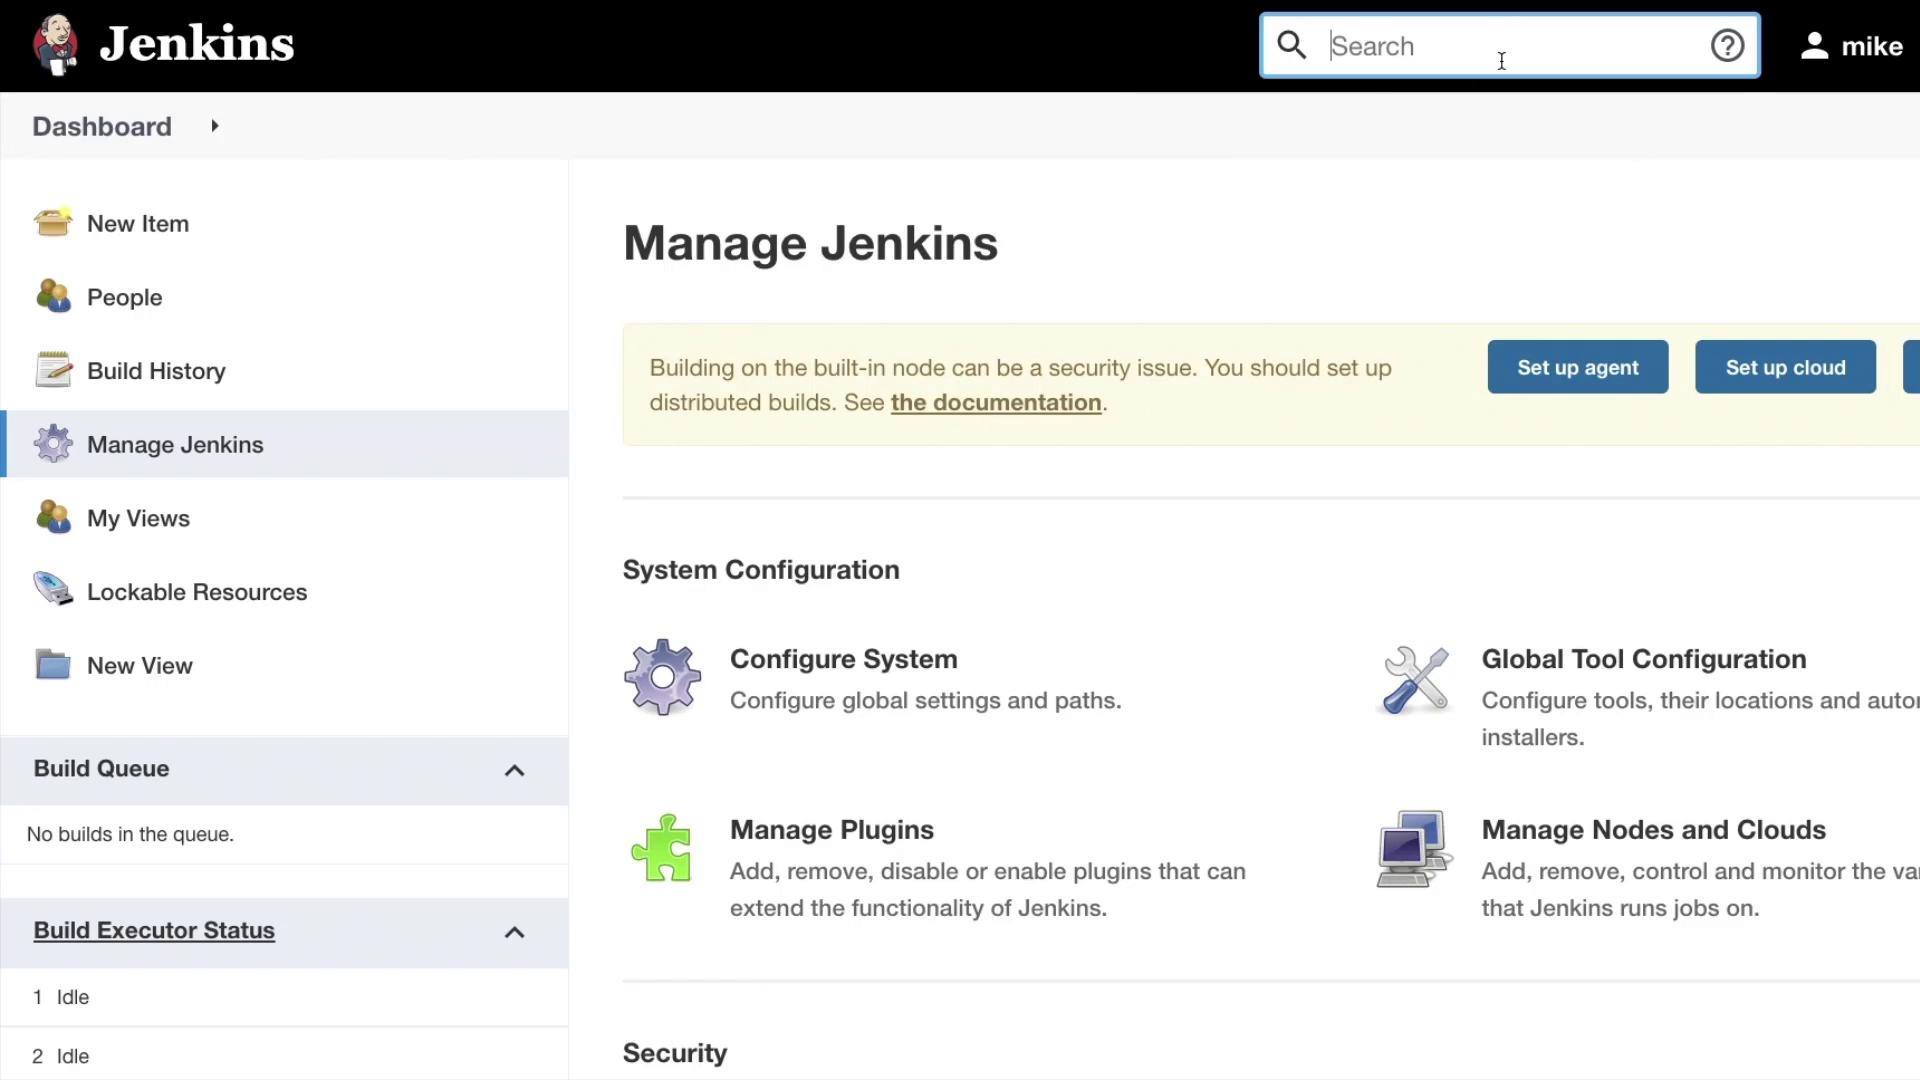
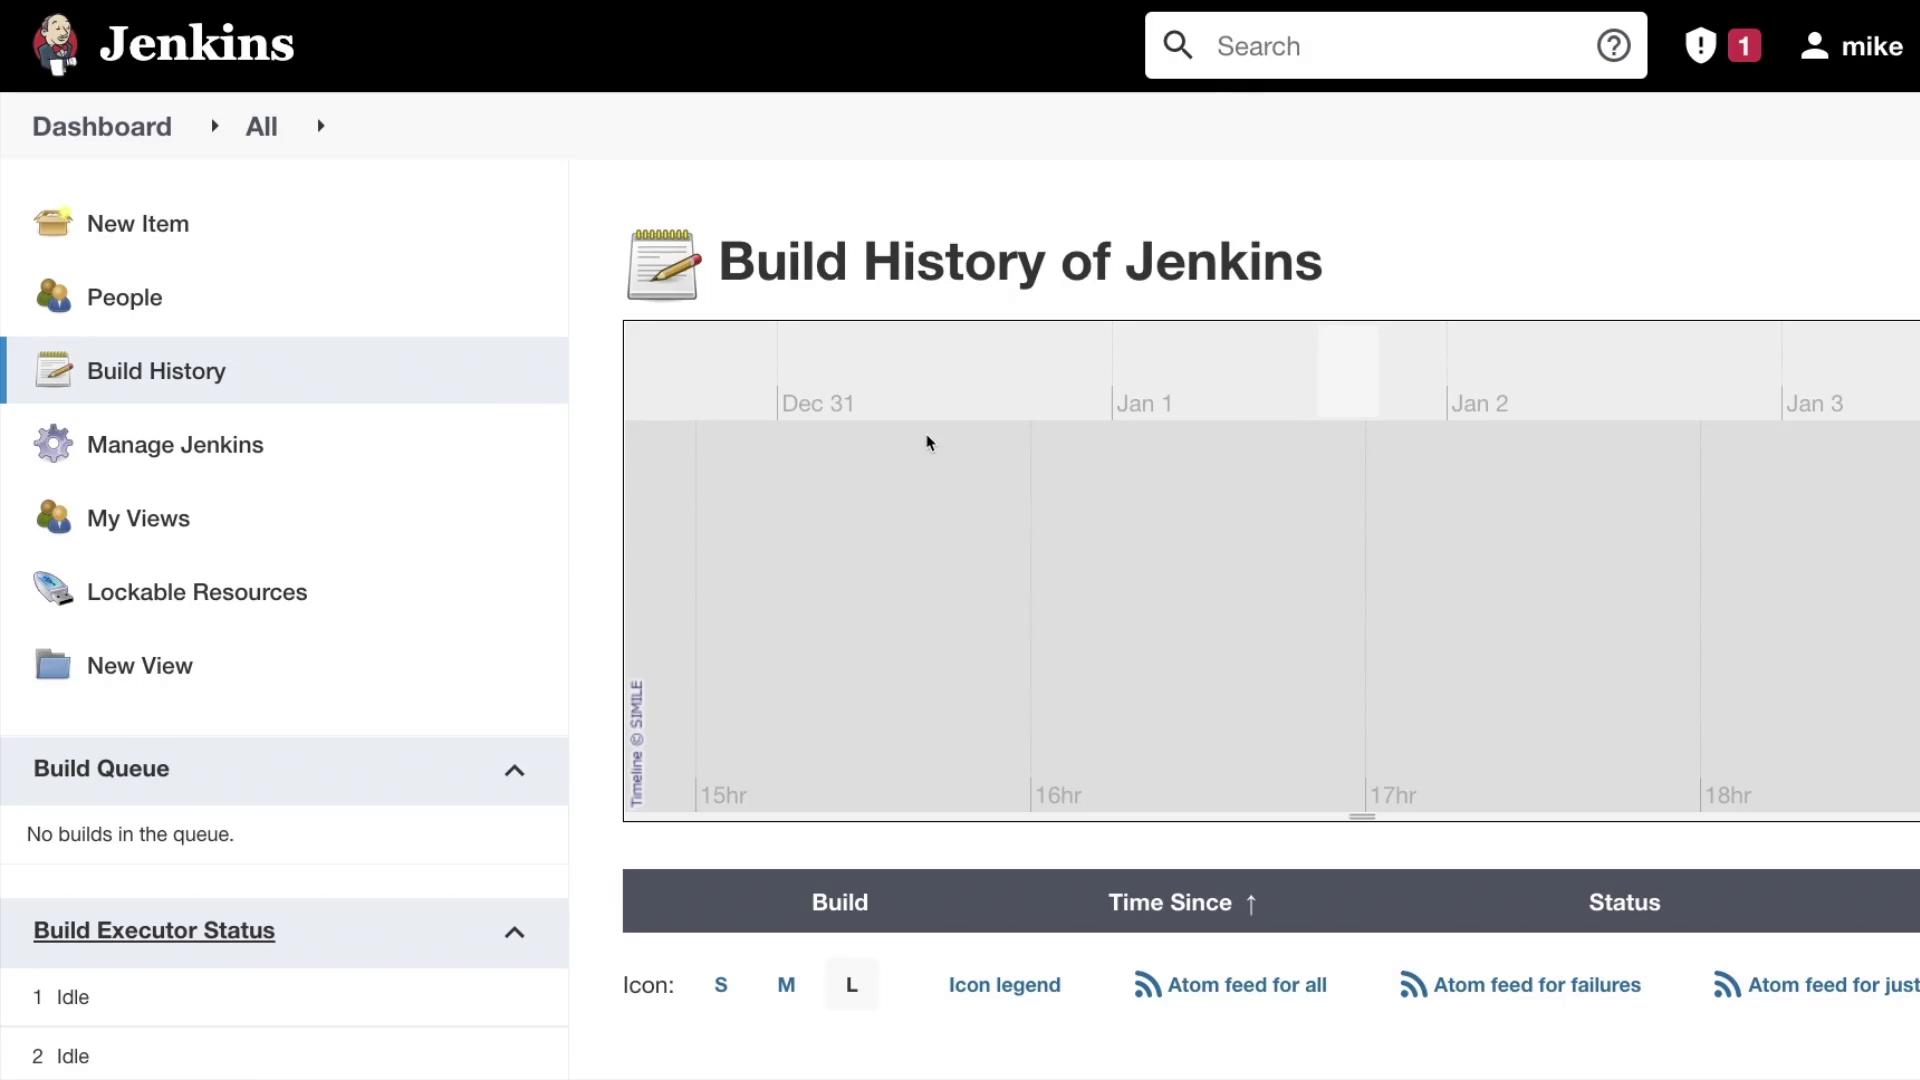
At the top-left corner, the Jenkins logo is prominently displayed. When clicked, the logo directs you to the login page if you’re not yet authenticated; otherwise, it returns you to the homepage. For instance, navigating to “Manage Jenkins” and then clicking the logo will always bring you back to the main screen.Beneath the logo lies the search bar. If you enter “manage” in this field, Jenkins promptly displays the “Manage Jenkins” option. On the other hand, a search for terms such as “people” may not return any results immediately. Although there might be a slight delay in displaying search results, the feature still efficiently guides you toward the relevant options.
Clicking the home icon once again confirms the navigation back to the main screen. When you click on your username, your account details are revealed. Under the “Dashboard” section in your account page, you can view information about your builds, views, credentials, and configurations associated with your account. Additionally, a logout option is provided, which returns you to the welcome page when used. You can sign back in anytime to continue your session.
The left sidebar is a central hub for Jenkins navigation. Below is a breakdown of its primary options:
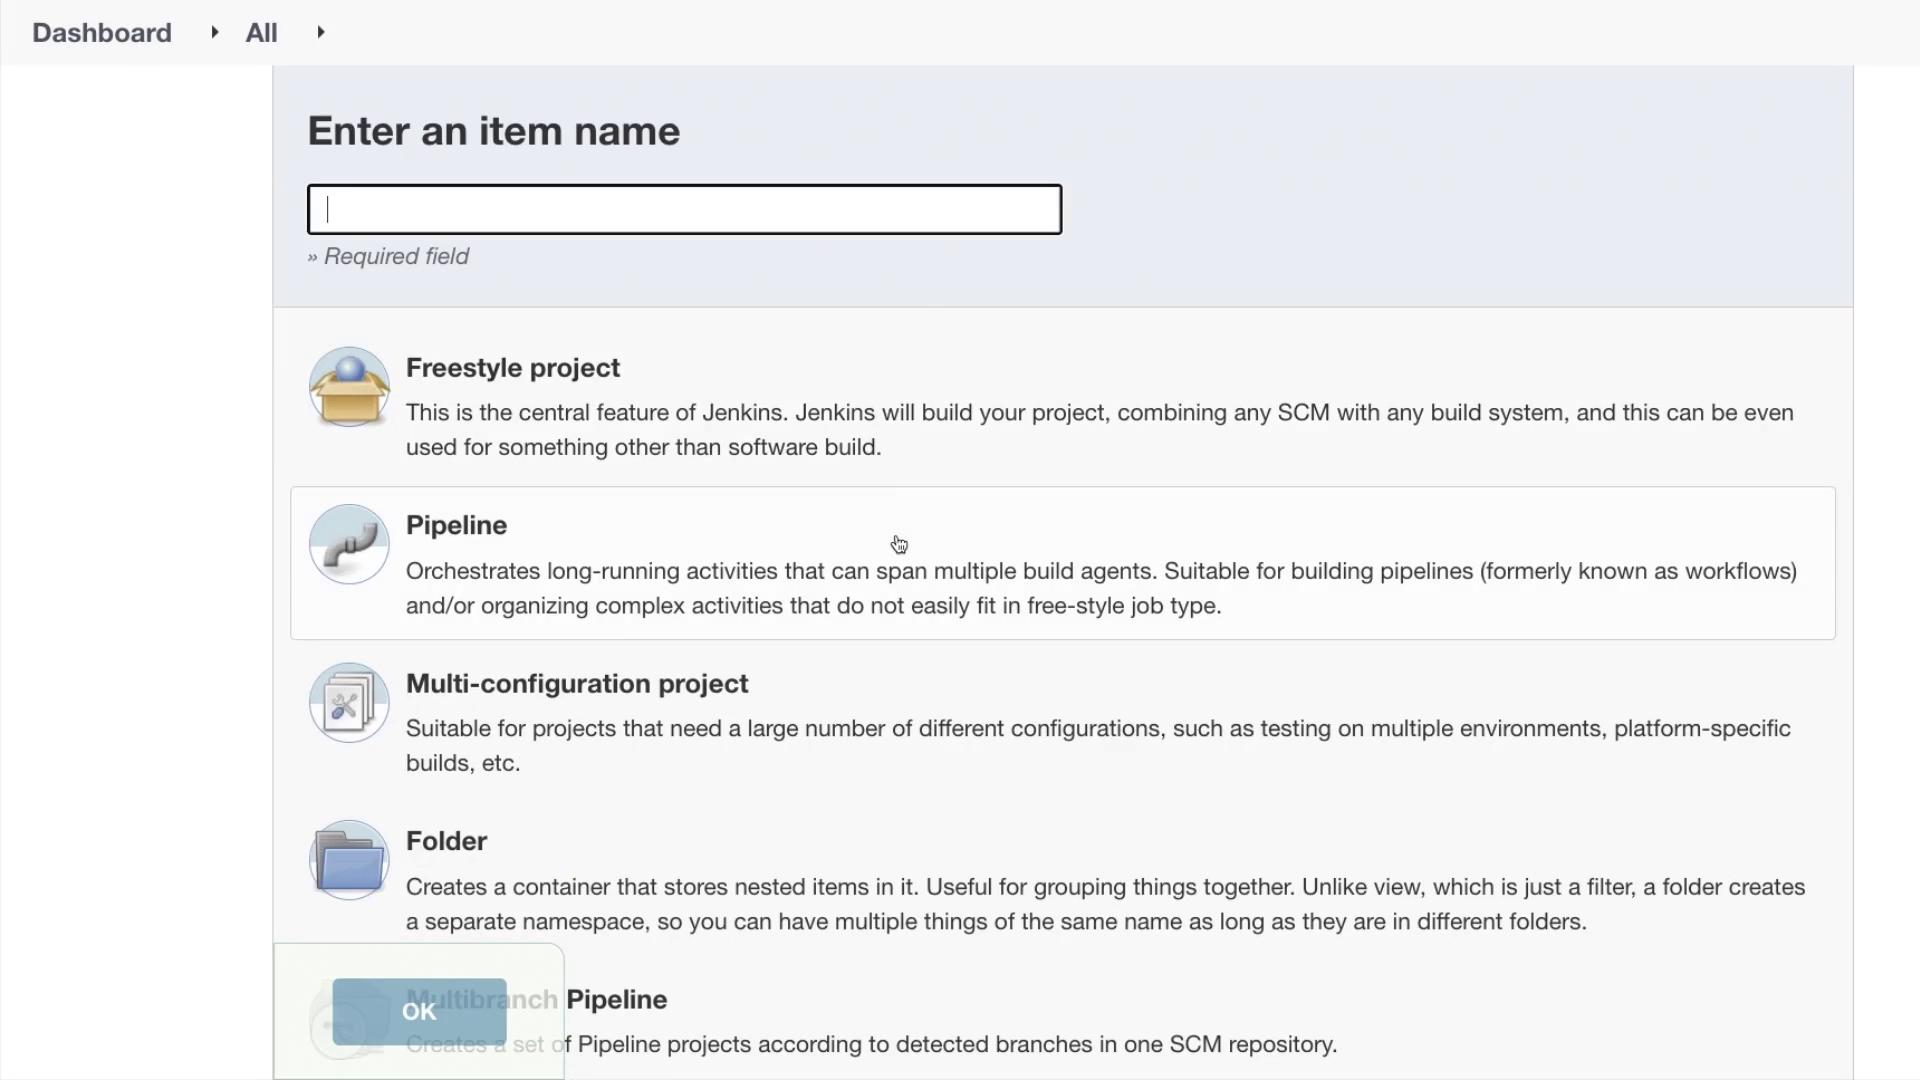
New Item:
This menu option is the starting point of your CI/CD process. By selecting “New Item,” you can create various types of jobs for your projects.
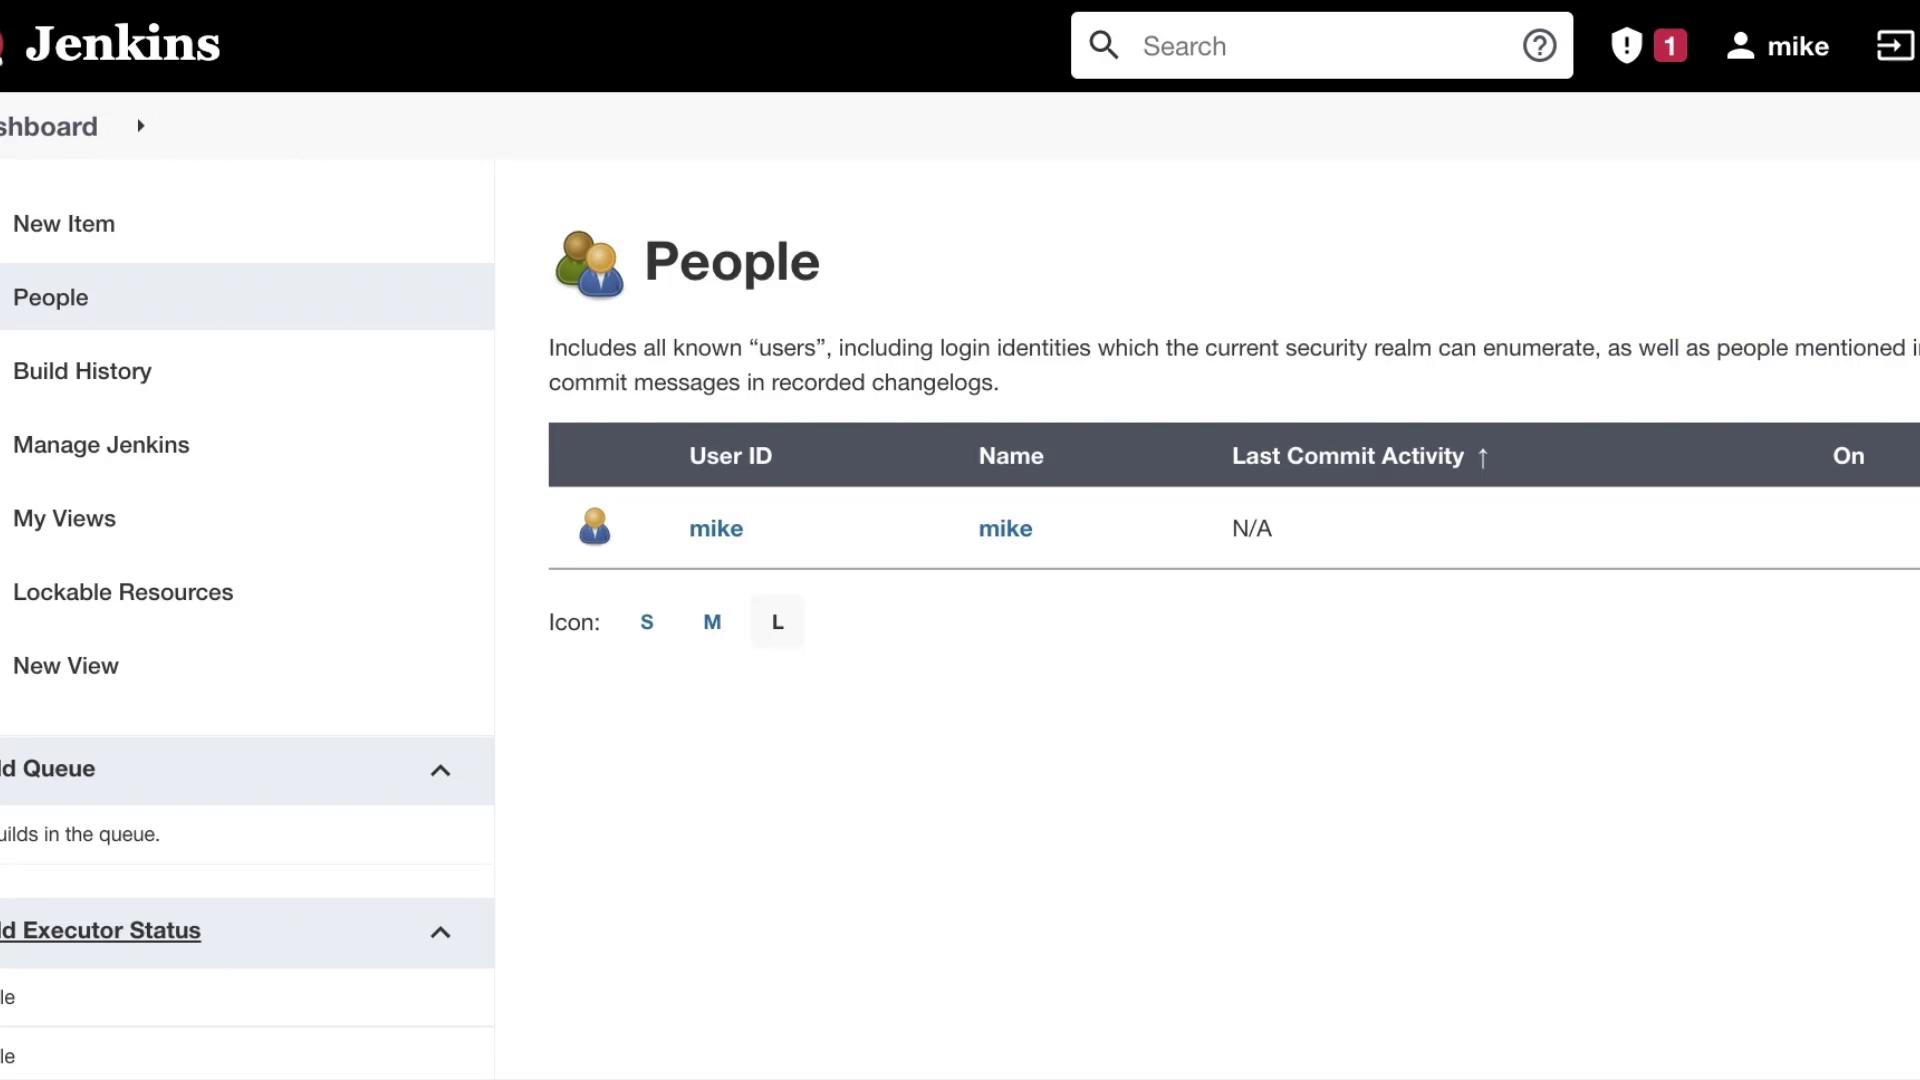
People:
Manage users and perform actions like creating new user accounts.
Build History:
This section keeps a record of your build history, which is particularly useful when working with Jenkins pipelines.
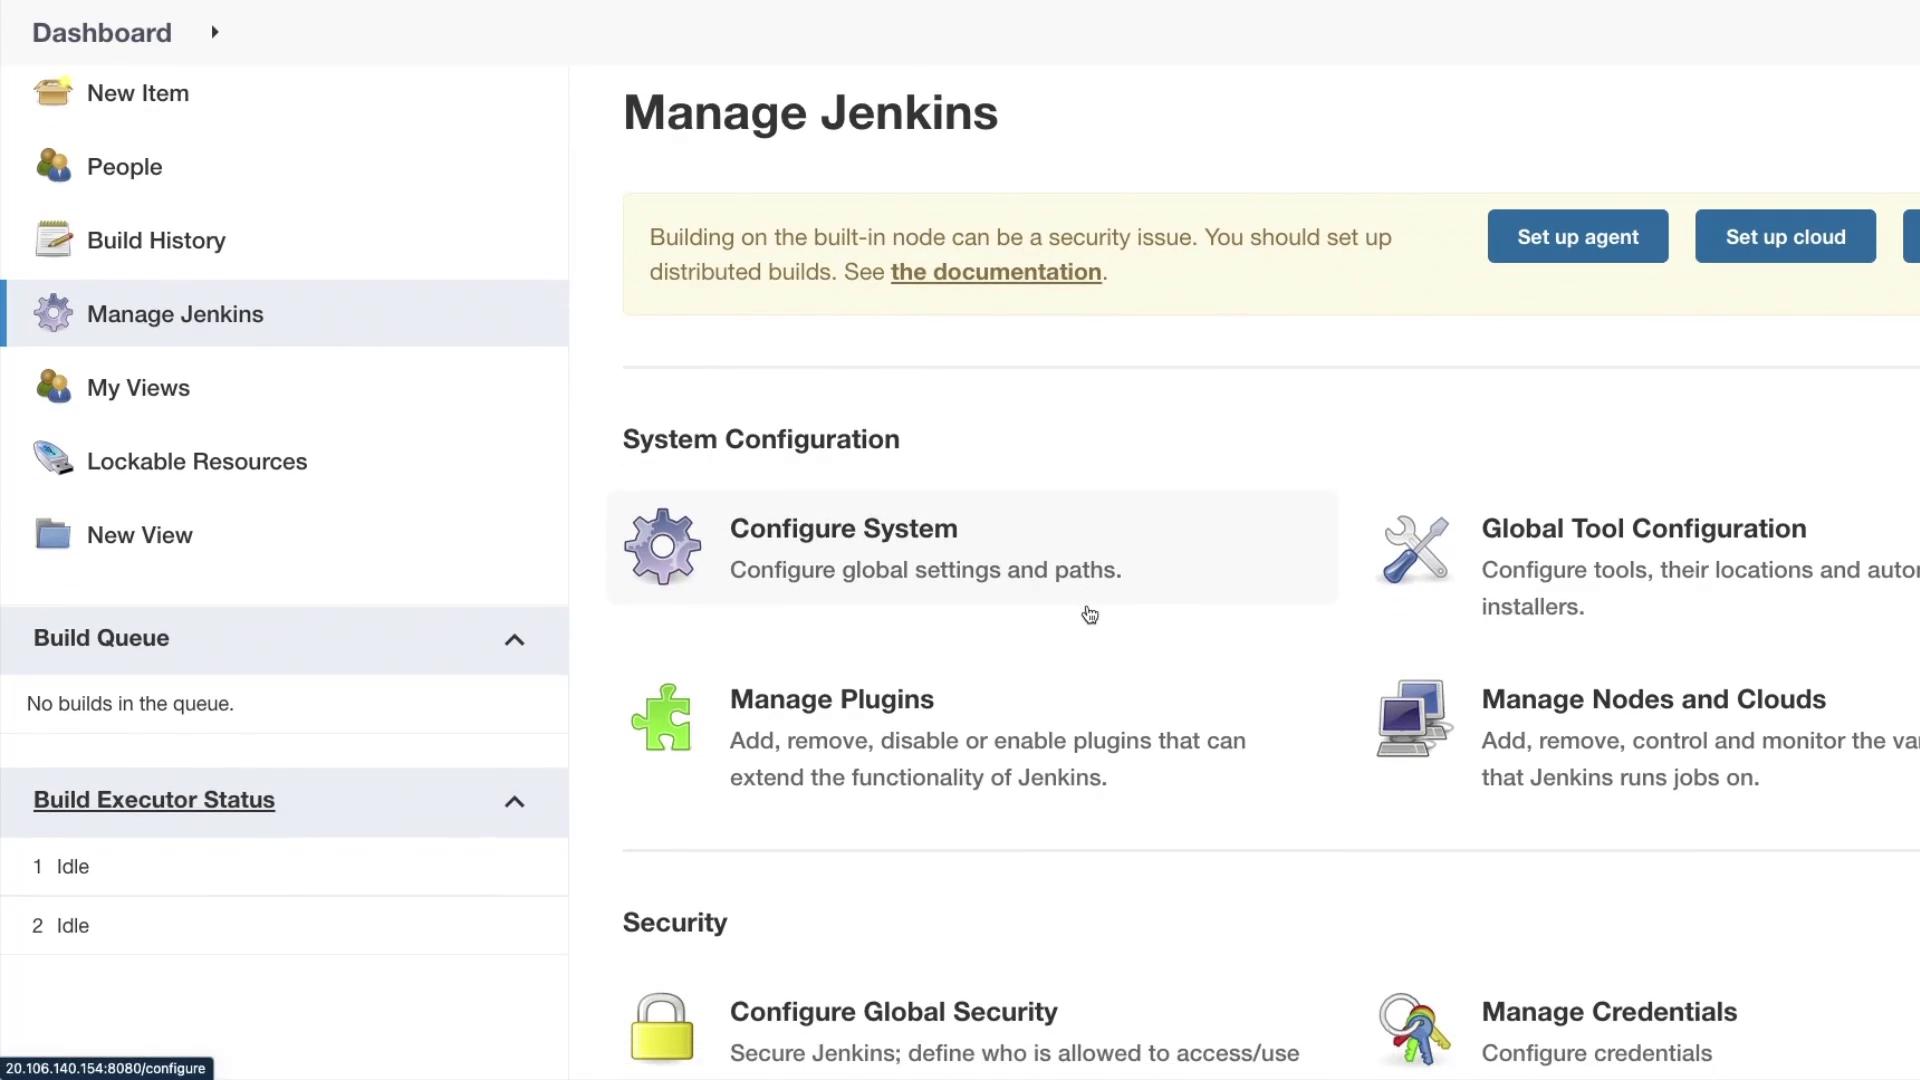
Manage Jenkins:
Access system configurations, security settings, plugin management, and troubleshooting tools from here.
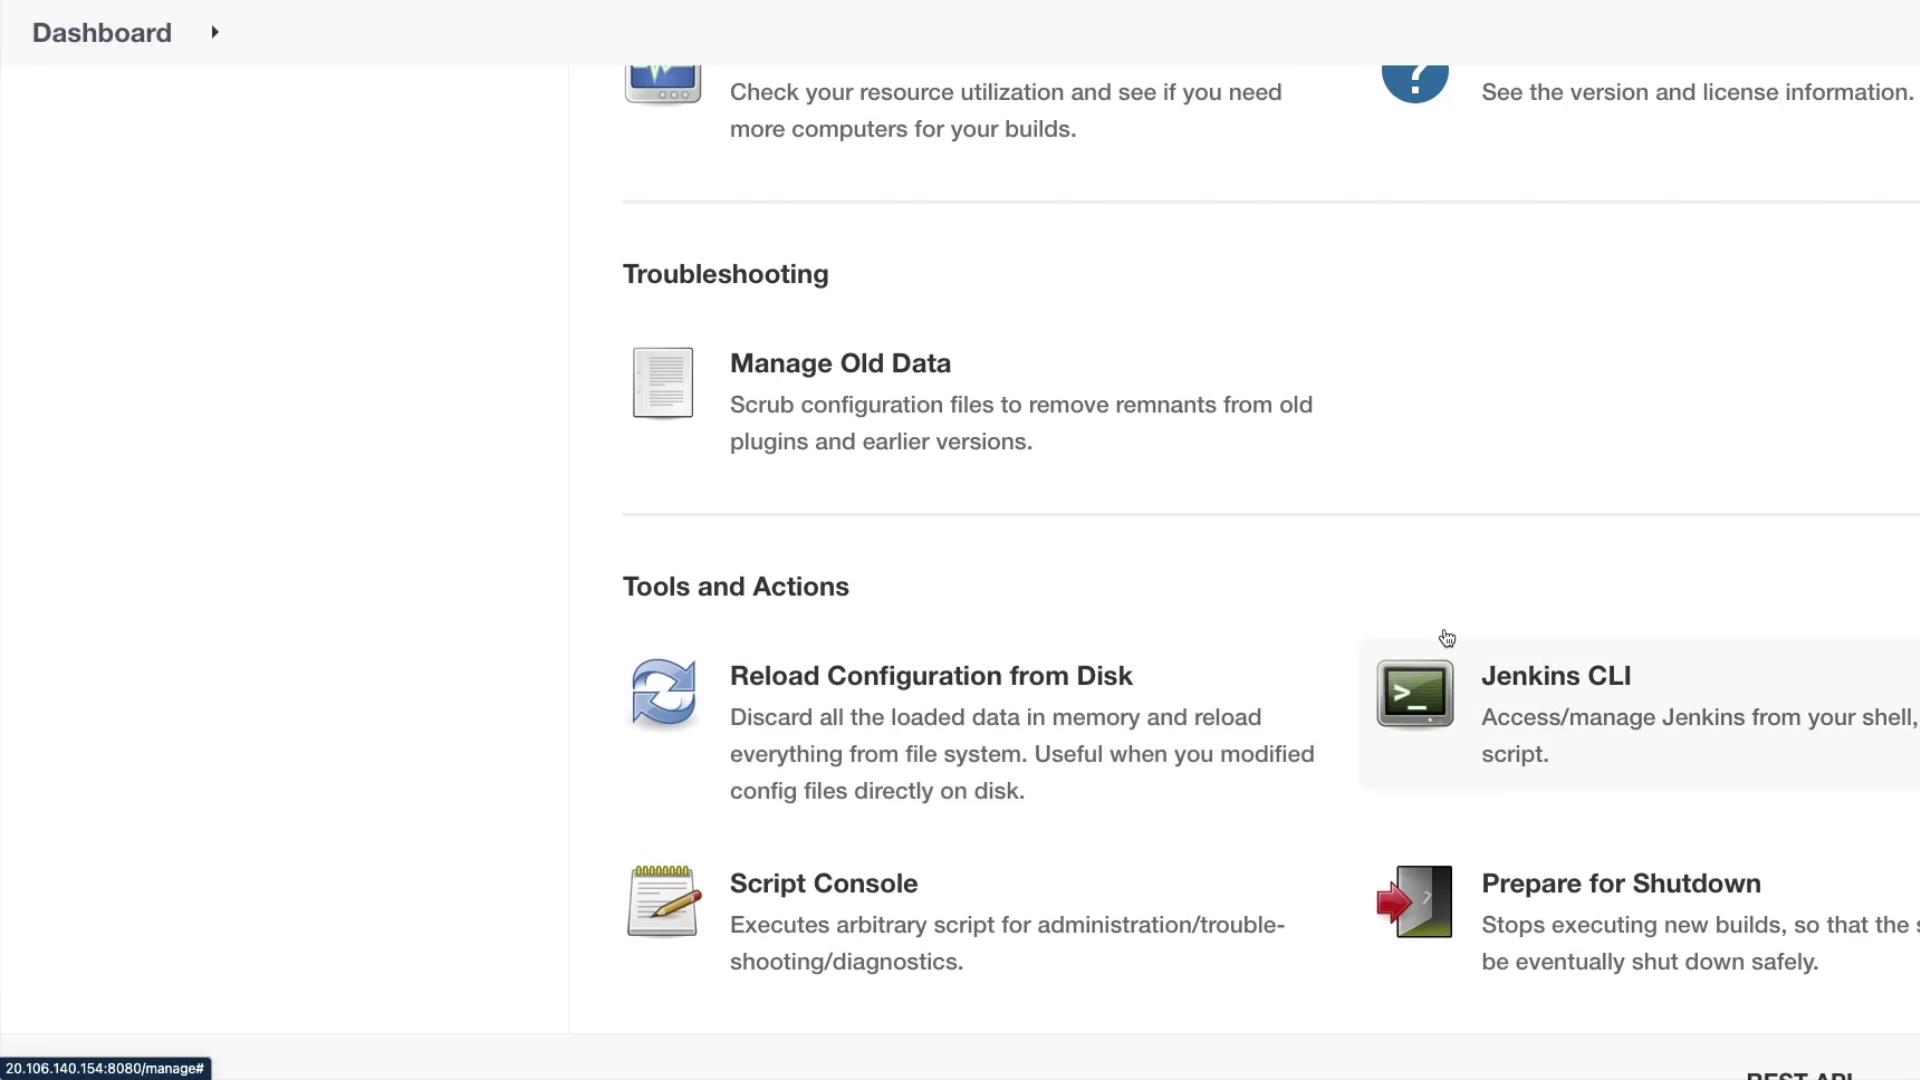
This section also displays status information and offers a selection of tools to help trace and resolve configuration issues.
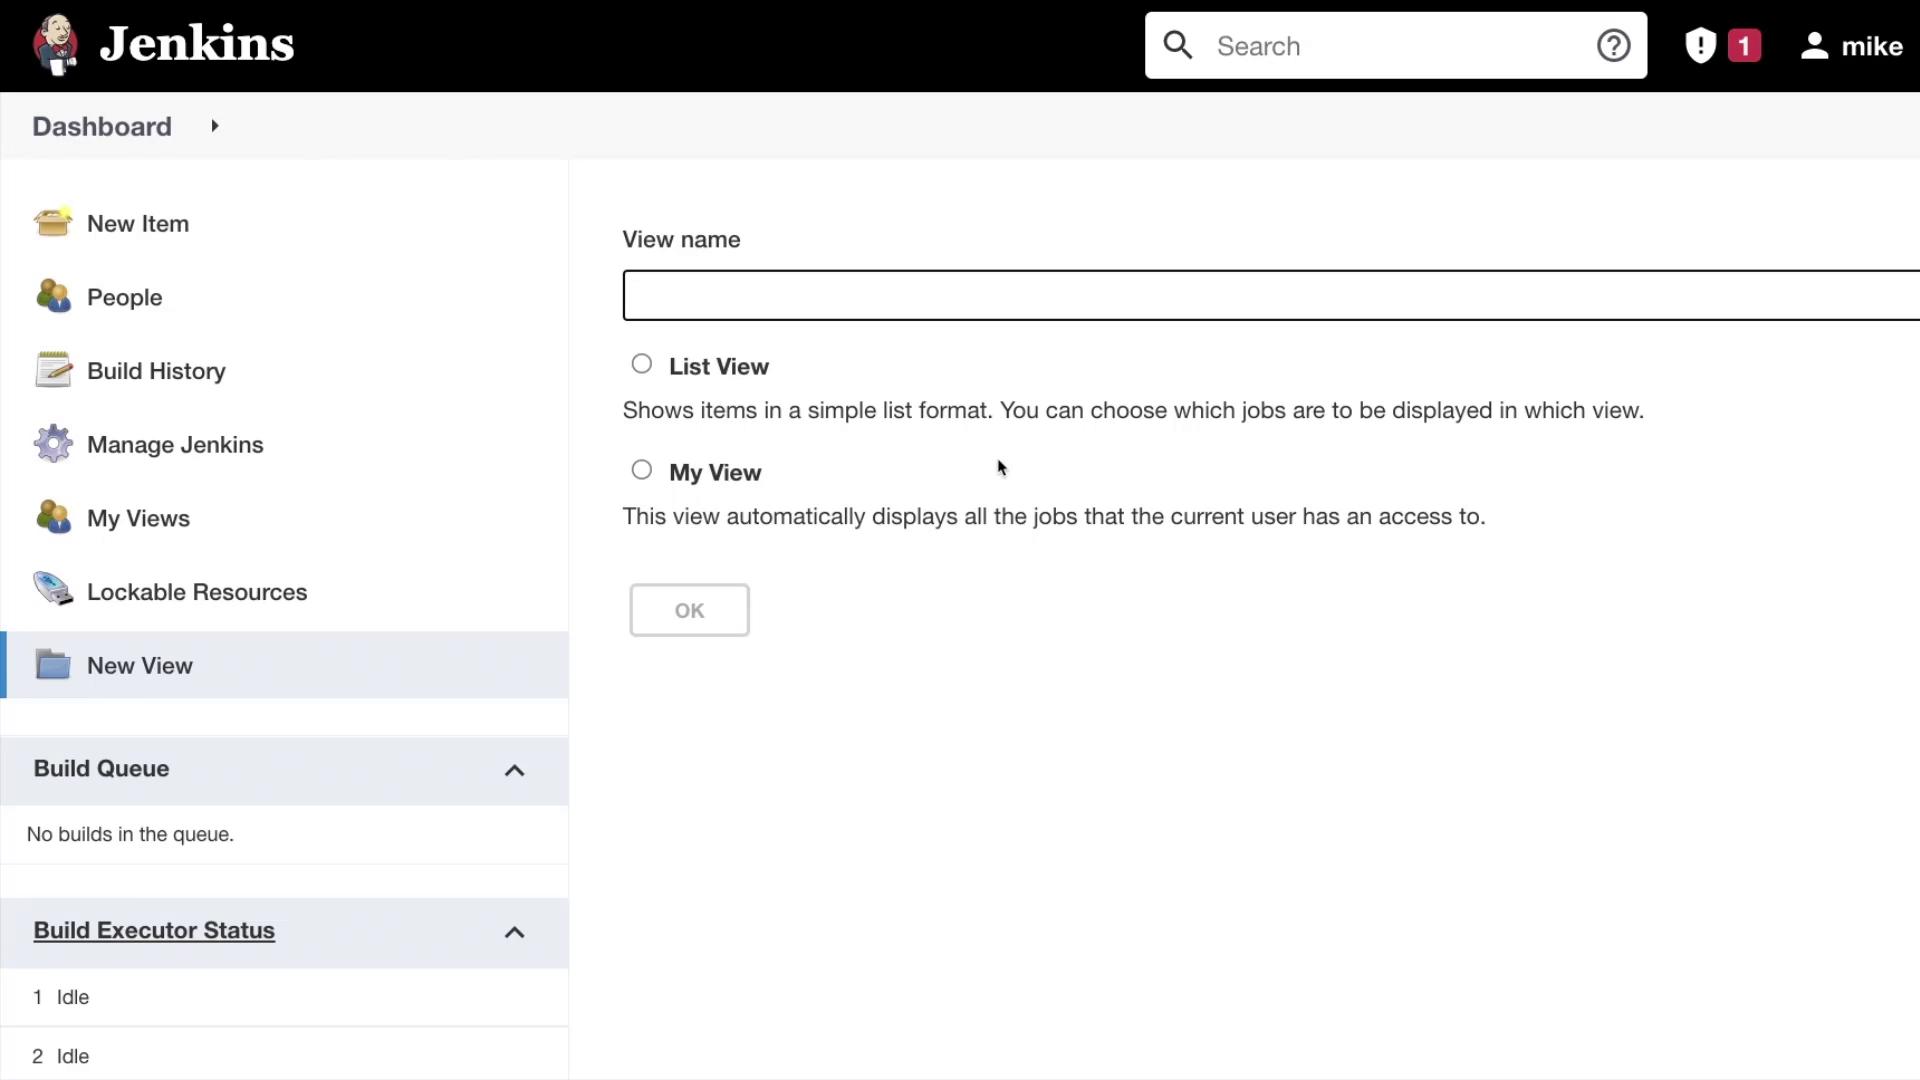
Views:
Customize how your jobs are displayed. Whether you prefer a simple list format or an automatic display of all your accessible jobs, Jenkins gives you the flexibility to create and manage various views.
Scrolling down further, you’ll observe the following dashboard components:
Build Queue:
This area shows the queue of jobs waiting to be executed.
Build Executor Status:
Monitor the status of active jobs and see which executors are currently running builds.
Footer Information:
At the bottom of the dashboard, you’ll find the Jenkins version along with a link to the REST API. The API provides comprehensive information about Jenkins’ configuration and system details.
This comprehensive overview of the Jenkins dashboard highlights its key components and navigation features. In future sections, we will delve deeper into each area for a more detailed exploration.
For enhanced clarity, consider adding a description to your Jenkins projects. A brief description can help you and your team quickly understand the purpose and configuration of each project.
That wraps up this session. We look forward to exploring more Jenkins functionalities in the next article.For more useful guides and tips on Jenkins, visit Jenkins Documentation.