Jenkins
Systems Administration with Jenkins
Monitoring Jenkins
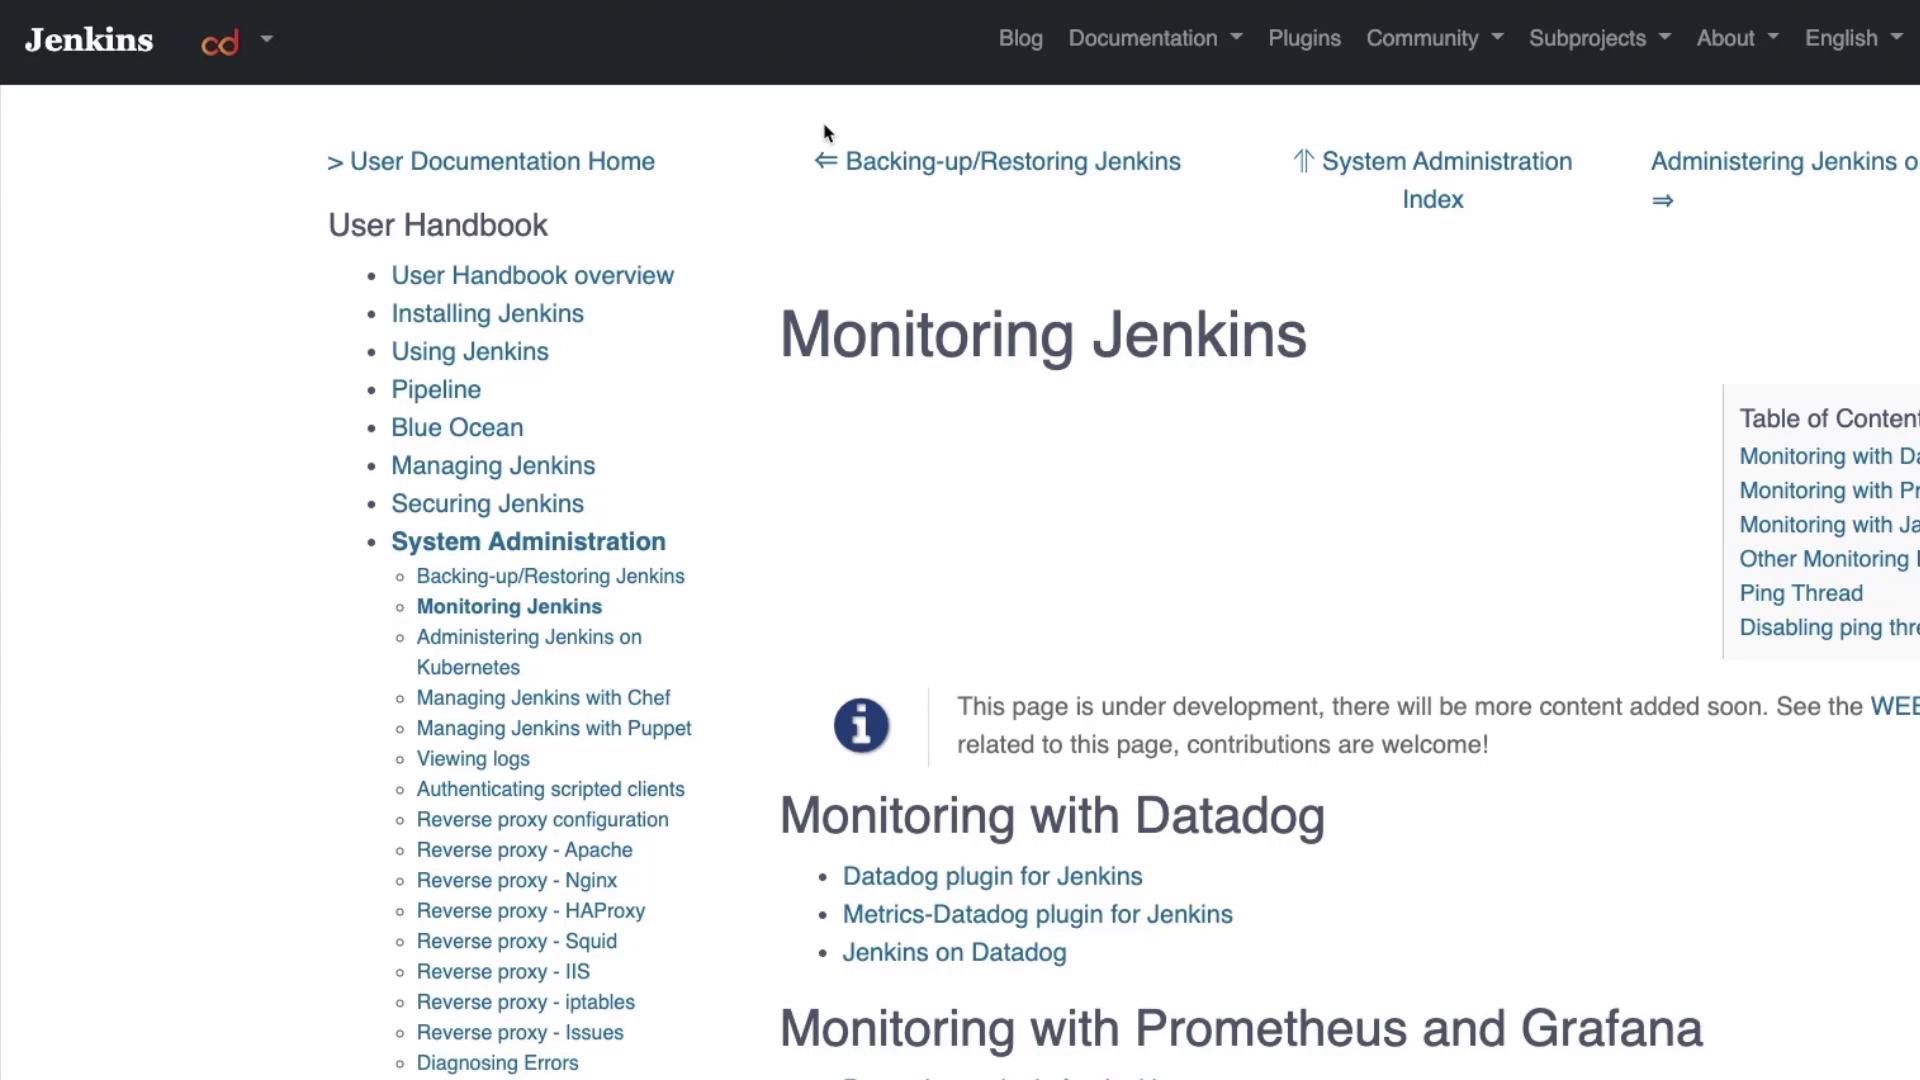
In this guide, we explain how to monitor Jenkins using various plugins and integrate Jenkins metrics with Prometheus. Organizations can choose from several monitoring solutions such as Datadog, Prometheus with Grafana, and Java Melody. This article focuses on leveraging the Prometheus plugin for Jenkins monitoring.
Overview of Available Monitoring Plugins
Jenkins provides a range of monitoring plugins to fit different requirements:
- Datadog Monitoring: Several plugins are available to integrate Jenkins with Datadog.
- Prometheus and Grafana Monitoring: A dedicated plugin makes it easy to export and visualize metrics.
- Java Melody Monitoring: Additional plugins support detailed application monitoring.
To view these plugins:
- Log into your Jenkins dashboard.
- Navigate to Manage Jenkins > Manage Plugins.
- Click on the Available tab and search for "Monitoring".
As you browse the search results, you may notice plugins such as:
- Prometheus Metrics: Scroll down for details.
- Dynatrace:
Warning
This plugin appears outdated and may have security issues.
For example, a search for Datadog will display the available Datadog plugin:
In this tutorial, we will use the Prometheus plugin.
Installing the Prometheus Plugin
To install the Prometheus plugin:
- Select the Prometheus plugin from the list.
- Click Install Without Restart.
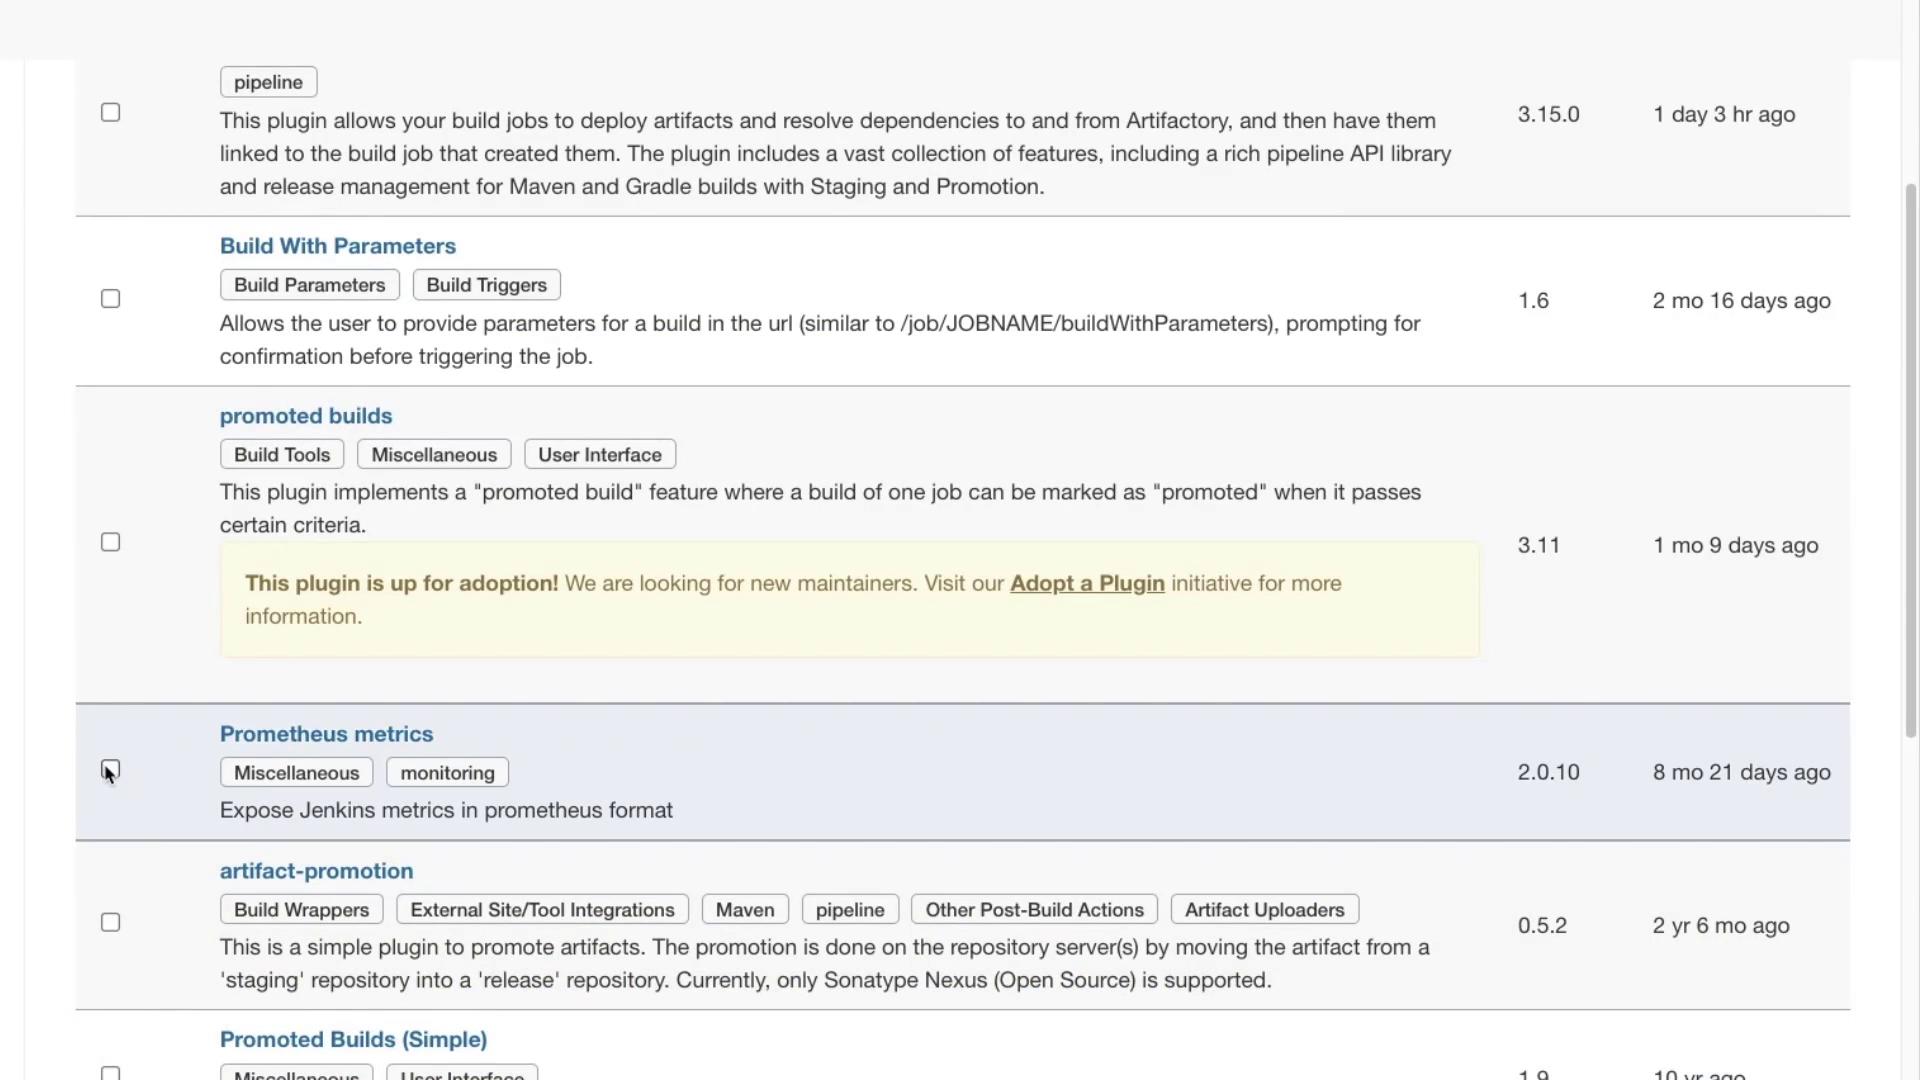
After starting the installation, you will see the progress. Note that the Prometheus plugin, like some other plugins, might require a Jenkins restart to work completely.
Restart Jenkins
After installation, open your terminal and run the following command to restart Jenkins:
sudo systemctl restart jenkins
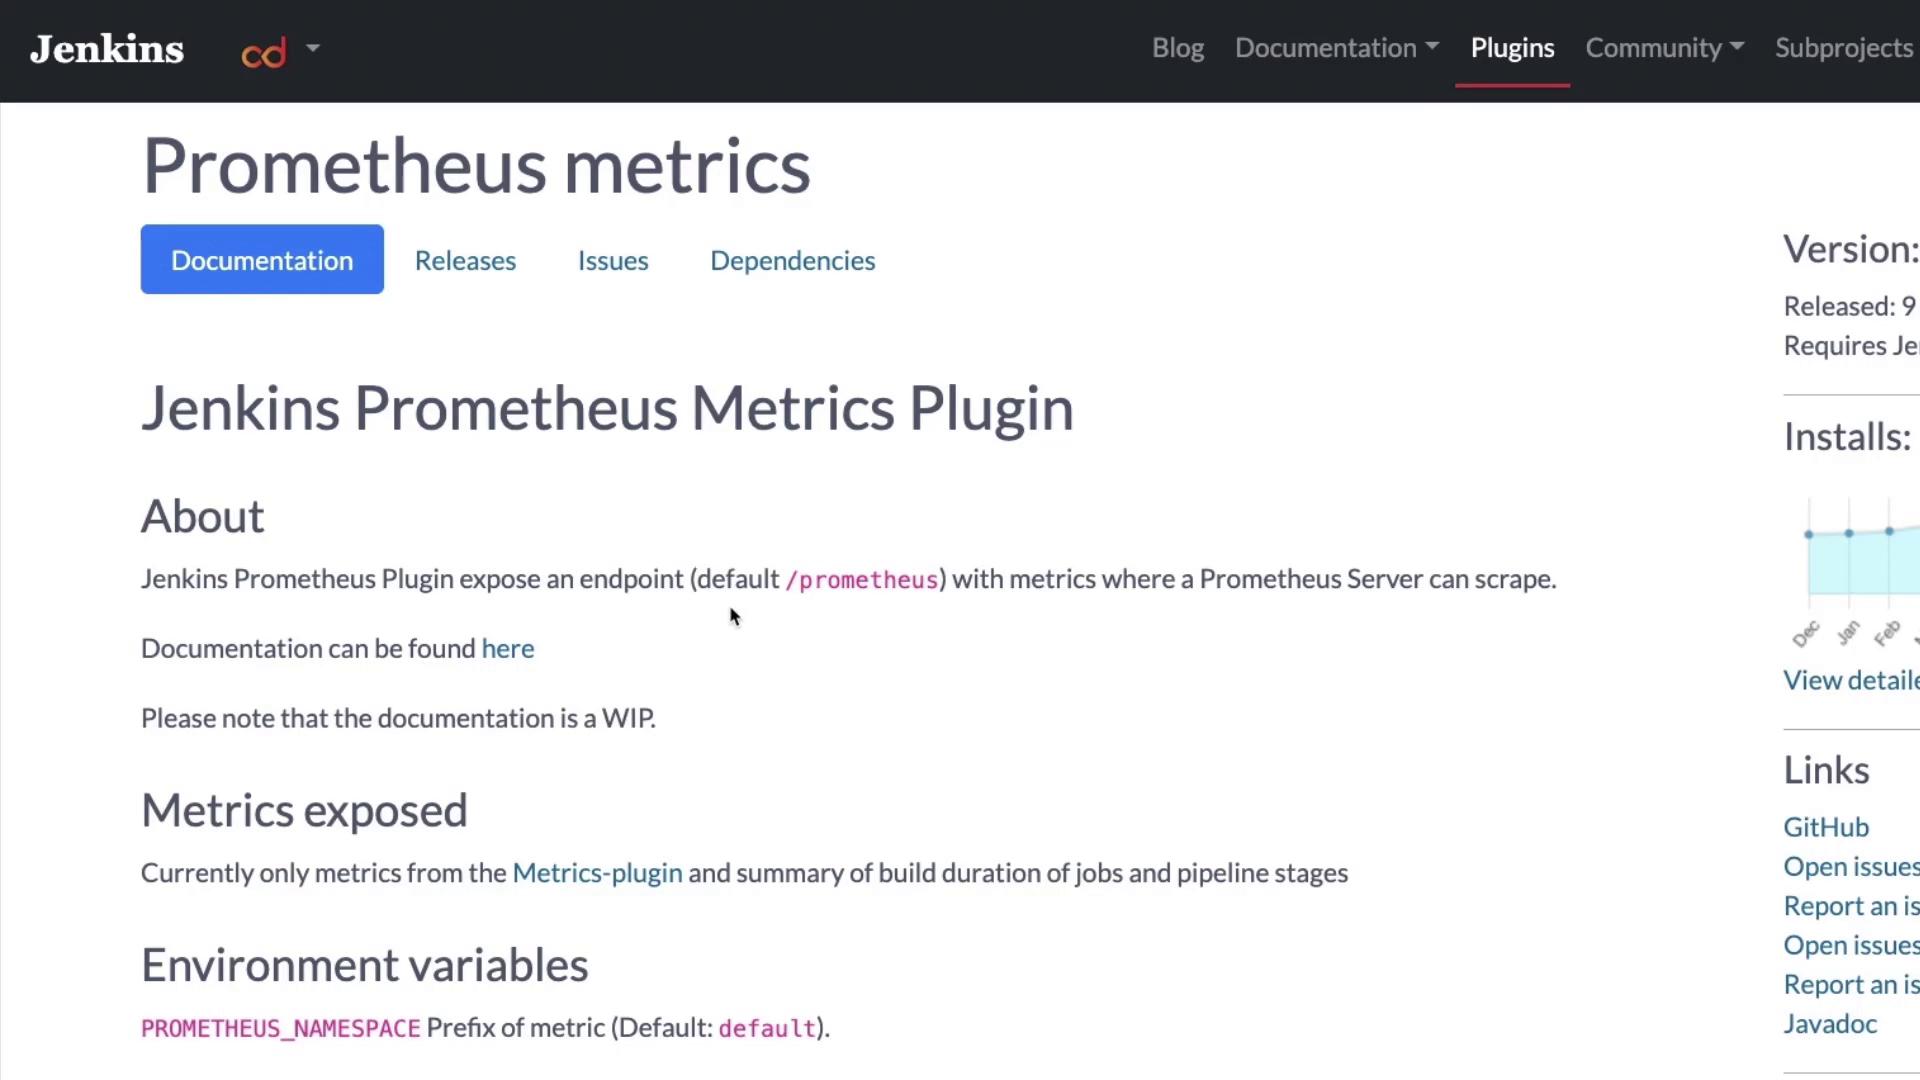
Allow Jenkins some time to restart. Once restarted, log in again. Then, navigate to the plugin's documentation to review the default environment variables and understand how Jenkins exposes metrics at the /prometheus
endpoint.
Integrating Jenkins with Prometheus
After setting up your Prometheus server (for instance, on Azure), configure it to scrape metrics from Jenkins. Follow these steps:
SSH into your Prometheus server and open the configuration file:
mike@prometheus01:~$ sudo vi /etc/prometheus/prometheus.yml
Update the configuration by modifying the "targets" section. Remove any unnecessary comments and paste the following snippet:
scrape_interval: 15s # Scrape every 15 seconds. Default is every 1 minute. evaluation_interval: 15s # Evaluate rules every 15 seconds. Default is every 1 minute. # Alertmanager configuration alerting: alertmanagers: - static_configs: - targets: - alertmanager:9093 # Load rules periodically based on 'evaluation_interval'. rule_files: # - "first_rules.yml" # - "second_rules.yml" scrape_configs: # Scraping Prometheus itself. - job_name: 'prometheus' static_configs: - targets: ['localhost:9090'] # Scraping Jenkins metrics. - job_name: 'Jenkins' metrics_path: '/prometheus' static_configs: - targets: ['52.146.45.251:8080']
Replace the IP address and port in the
targets
field with your actual Jenkins server details.Restart Prometheus to apply the new configuration:
mike@prometheus01:~$ sudo systemctl restart prometheus mike@prometheus01:~$ systemctl status prometheus
When successful, you should see output similar to:
● prometheus.service - Prometheus Time Series Collection and Processing Server Loaded: loaded (/etc/systemd/system/prometheus.service; enabled; vendor preset: enabled) Active: active (running) since Tue 2022-01-04 18:56:47 UTC; 5s ago Main PID: 3431 (prometheus) Tasks: 7 (limit: 2298) Memory: 59.6M CGroup: /system.slice/prometheus.service └─3431 /usr/local/bin/prometheus --config.file /etc/prometheus/prometheus.yml --storage.tsdb.path /var/lib/prometheus
Once Prometheus restarts, check the dashboard to confirm that it is successfully scraping Jenkins logs and metrics.
Conclusion
This guide covers the essentials of monitoring Jenkins by installing the Prometheus plugin and integrating it with a Prometheus server. For further details and resources, consider exploring the following links:
Next Steps
Practice the setup in your development environment to gain hands-on experience with Jenkins monitoring and Prometheus integration.
Watch Video
Watch video content