Kubernetes Autoscaling

Horizontal Pod Autoscaler HPA

Custom Metrics Mechanisms

Learn how to feed application-specific metrics into the Kubernetes Horizontal Pod Autoscaler (HPA) to achieve advanced scaling based on request rates, latency, queue depth, and other performance indicators.

What Are Custom Metrics?

Custom metrics are in-cluster, application-specific data points—distinct from CPU/memory (native) and external metrics. They help:

  • Maintain optimal performance under variable workloads
  • Scale based on business-critical or user-centric KPIs

Workflow Components

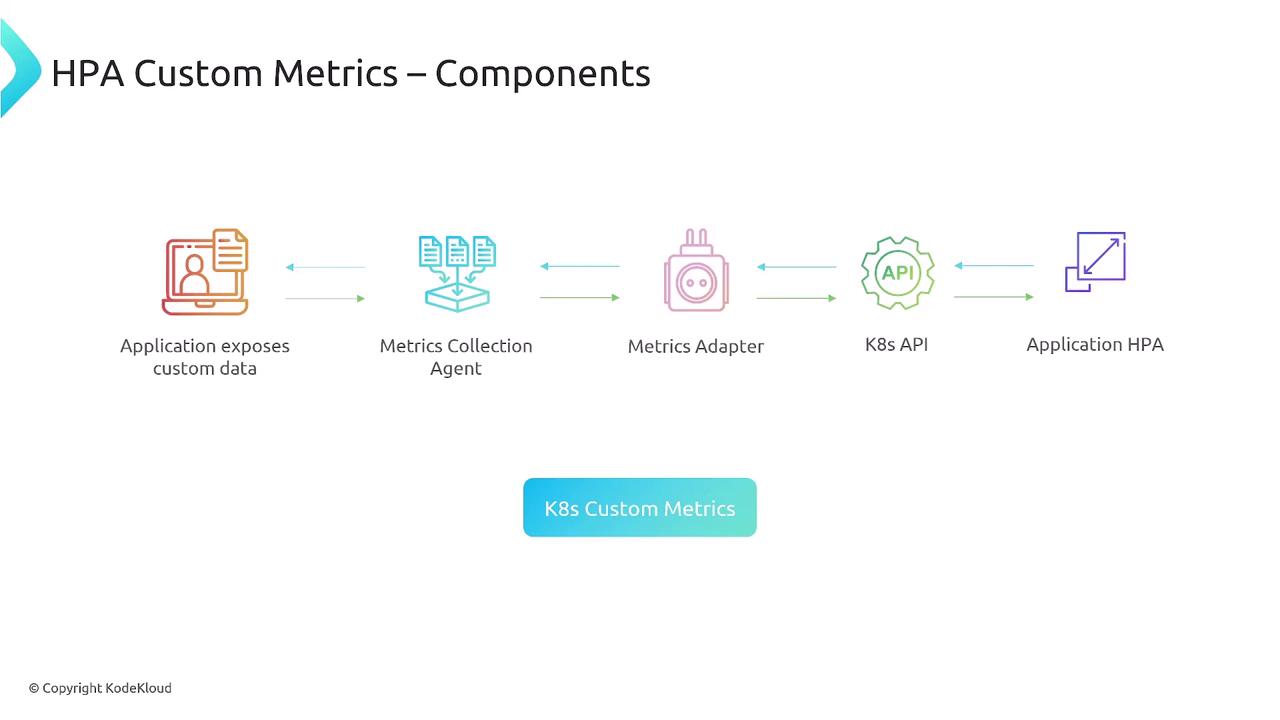
At a high level, custom metrics integration with HPA involves the following flow:

ComponentRoleExample
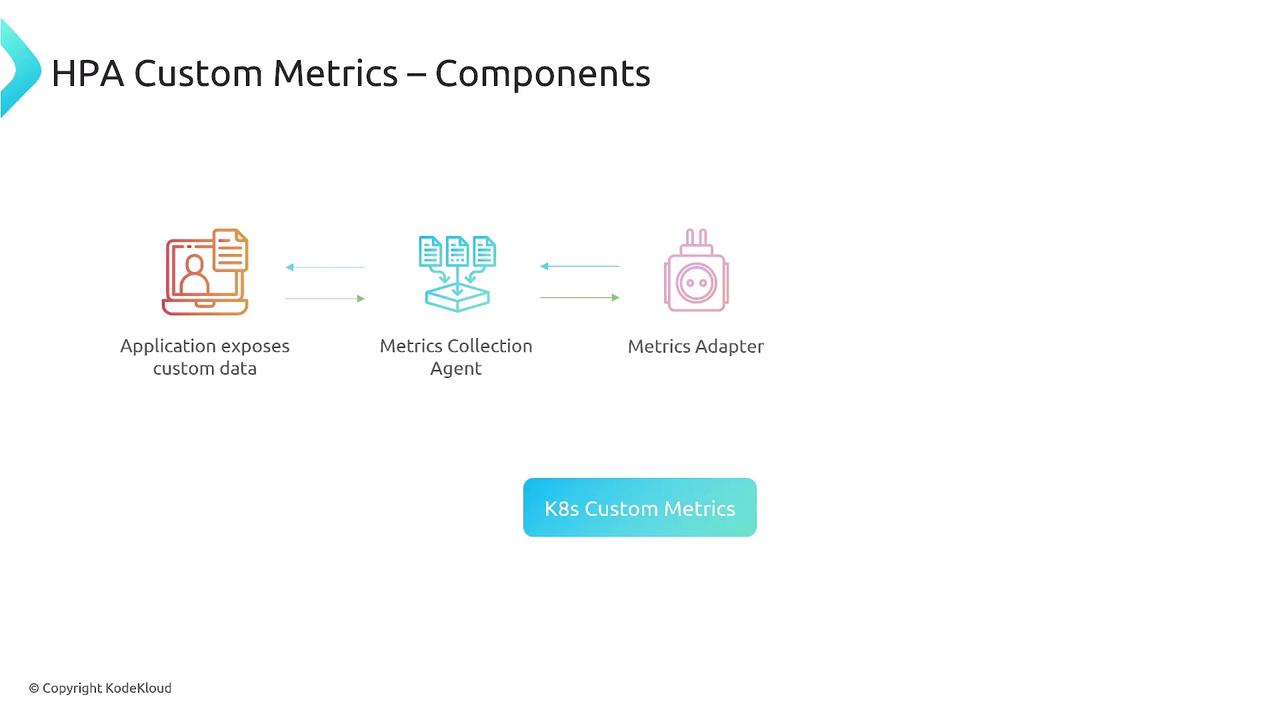
ApplicationExposes metrics via a monitoring libraryMicrometer, client_golang
Metrics Collection AgentScrapes and stores metricsPrometheus exporter
Metrics AdapterTranslates stored metrics to the Kubernetes Custom Metrics APIprometheus-adapter
Kubernetes API ServerServes custom metrics to consumersN/A
HPA ControllerQueries metrics and adjusts ReplicaSetsHorizontalPodAutoscaler

The image illustrates the components of HPA Custom Metrics, showing a flow from an application exposing custom data to a metrics collection agent and then to a metrics adapter, labeled "K8s Custom Metrics."

In practice, your application library emits metrics, Prometheus scrapes them, and the adapter registers them under the Custom Metrics API.

The image illustrates the components of HPA Custom Metrics, showing a flow from an application exposing custom data to a metrics collection agent, metrics adapter, Kubernetes API, and finally to application HPA.


Deploying Custom Metrics Support

Warning

The default Kubernetes metrics-server only exposes CPU and memory. You must install a monitoring backend and metrics adapter to enable custom metrics.

  1. Deploy Prometheus (or another monitoring system) with exporters in your cluster.
  2. Install prometheus-adapter and configure values.yaml to map Prometheus metrics to the Custom Metrics API.
  3. Ensure the adapter exposes metrics under the correct API group (e.g., custom.metrics.k8s.io).

Sample HPA Definition

Below is a simplified example of an HPA using a custom Pods metric (requests_per_second):

apiVersion: autoscaling/v2beta2
kind: HorizontalPodAutoscaler
metadata:
  name: webapp-hpa
spec:
  scaleTargetRef:
    apiVersion: apps/v1
    kind: Deployment
    name: webapp
  minReplicas: 2
  maxReplicas: 10
  metrics:
  - type: Pods
    pods:
      metric:
        name: requests_per_second
      target:
        type: AverageValue
        averageValue: 100

Note

Scrape interval and query timeouts can impact HPA responsiveness. Adjust your adapter’s prometheus.yaml mapping and scrape configs accordingly.


Key Considerations

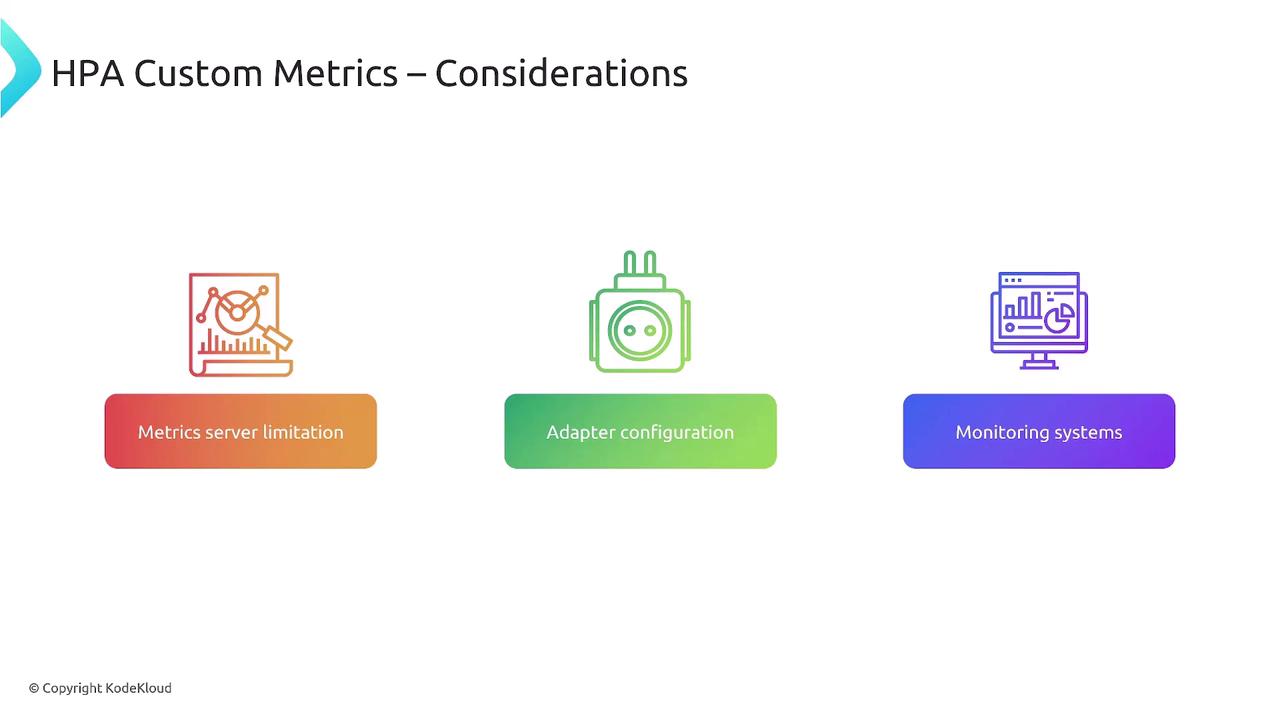
The image outlines considerations for HPA Custom Metrics, featuring three elements: metrics server limitation, adapter configuration, and monitoring systems, each represented with an icon.

  • Native metrics-server doesn’t serve custom metrics
  • You need an in-cluster data source (e.g., Prometheus)
  • The adapter bridges your monitoring backend to Kubernetes
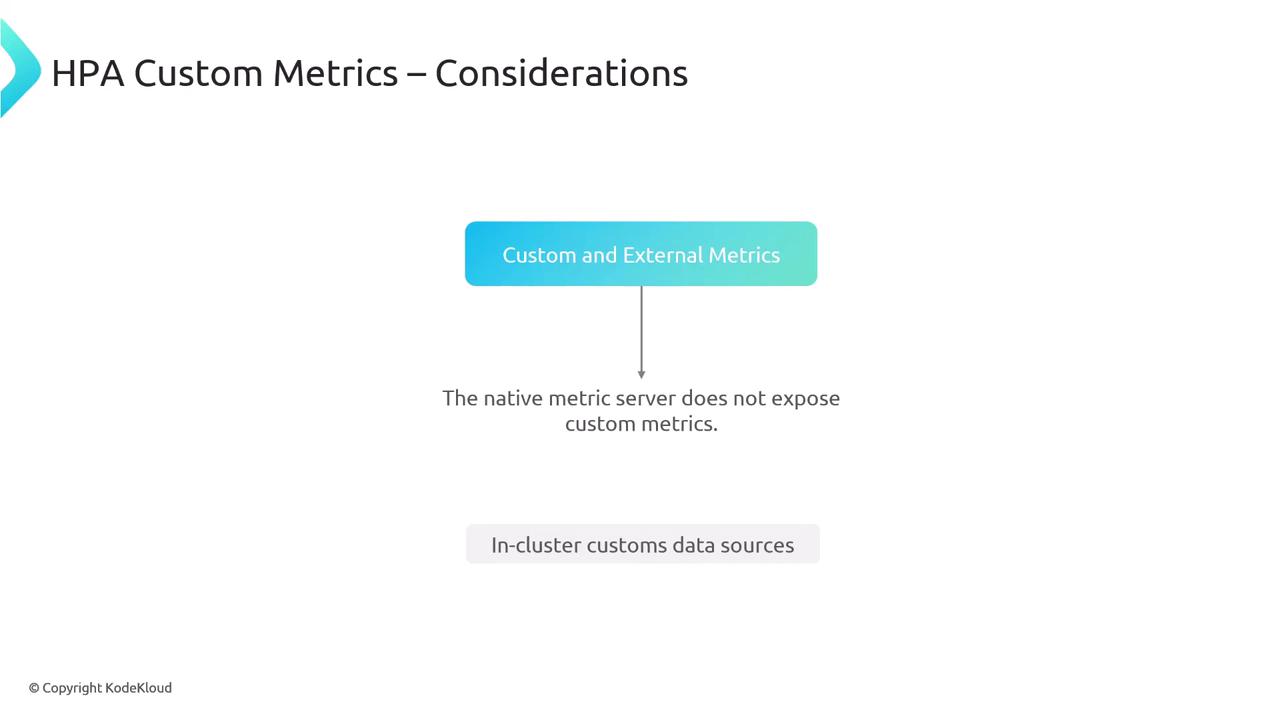
The image is a diagram titled "HPA Custom Metrics – Considerations," indicating that the native metric server does not expose custom metrics and mentioning "In-cluster customs data sources."


Next Steps

Once your adapter is in place, HPA will dynamically scale pods based on real-time application metrics. External metrics (e.g., from a cloud provider) are handled differently and will be covered in a dedicated lesson.

References

Watch Video

Watch video content

Practice Lab

Practice lab

Previous
HPA Architecture