Kubernetes Autoscaling

Horizontal Pod Autoscaler HPA

HPA Architecture

The Horizontal Pod Autoscaler (HPA) automatically adjusts the number of pod replicas in your deployments, StatefulSets, or ReplicaSets by monitoring live metrics. This guide walks through the HPA architecture, from core components to control loops, illustrating how Kubernetes leverages resource, custom, and external metrics to scale workloads.

Metric CategoryDescriptionAPI Endpoint
ResourceCPU & memory usagemetrics.k8s.io
CustomIn-cluster application metricscustom.metrics.k8s.io
ExternalThird-party or cloud metricsexternal.metrics.k8s.io

The image is a diagram titled "HPA Architecture Framework," showing components like HPA Resource Definition, Metrics API Availability, Metrics Collection Source, and Metrics Adapters connected to HPA.

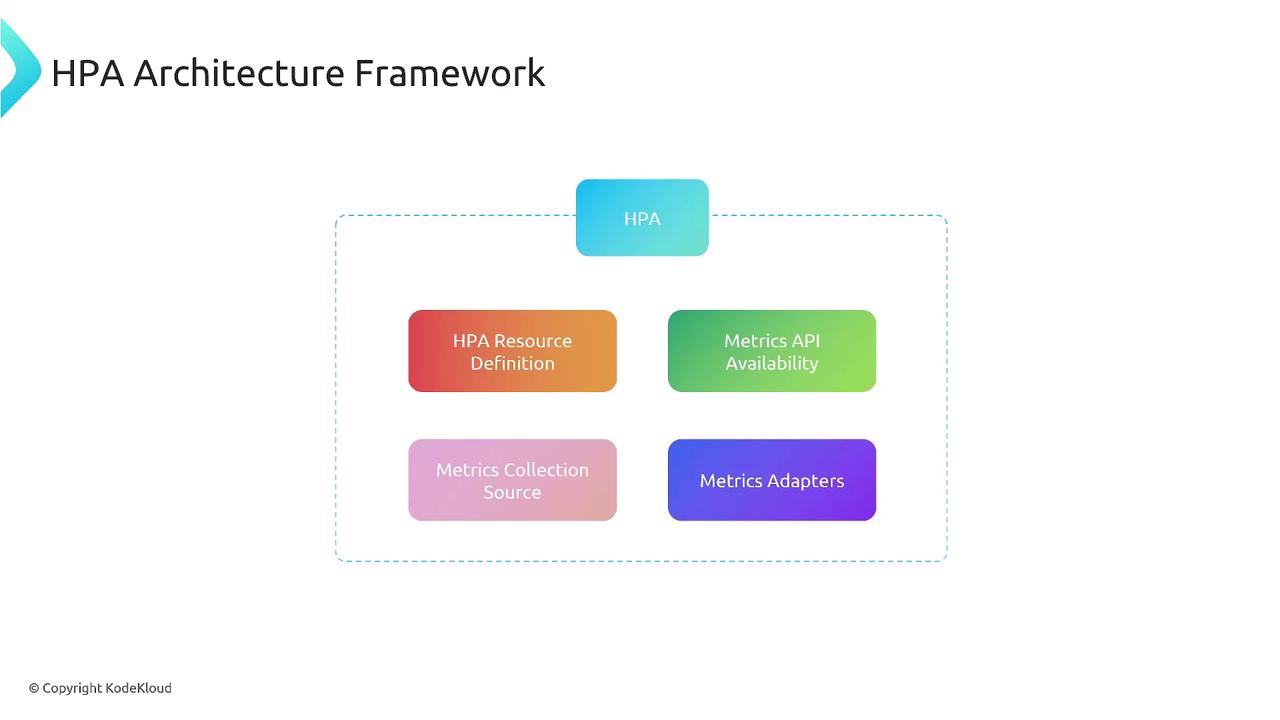
1. HPA Resource Definition

Define which workload to scale, the minimum/maximum replicas, and the metric targets.

apiVersion: autoscaling/v2
kind: HorizontalPodAutoscaler
metadata:
  name: my-statefulset-hpa
  namespace: default
spec:
  scaleTargetRef:
    apiVersion: apps/v1
    kind: StatefulSet
    name: my-statefulset
  minReplicas: 2
  maxReplicas: 10
  metrics:
    - type: Resource
      resource:
        name: cpu
        target:
          type: Utilization
          averageUtilization: 50

Here, the HPA keeps average CPU utilization around 50%, scaling the StatefulSet between 2 and 10 pods.

2. Native Resource Metrics Collection

By default, HPA retrieves CPU and memory metrics from the Kubernetes Metrics Server via metrics.k8s.io.

The image is a flowchart illustrating the process of metrics collection in a Kubernetes cluster, involving components like HPA Definition, Kube API, Metrics Server, and Workload (Deployment). It shows the interactions for resource monitoring and workload adjustments.

The HPA control loop (every 15s by default) performs:

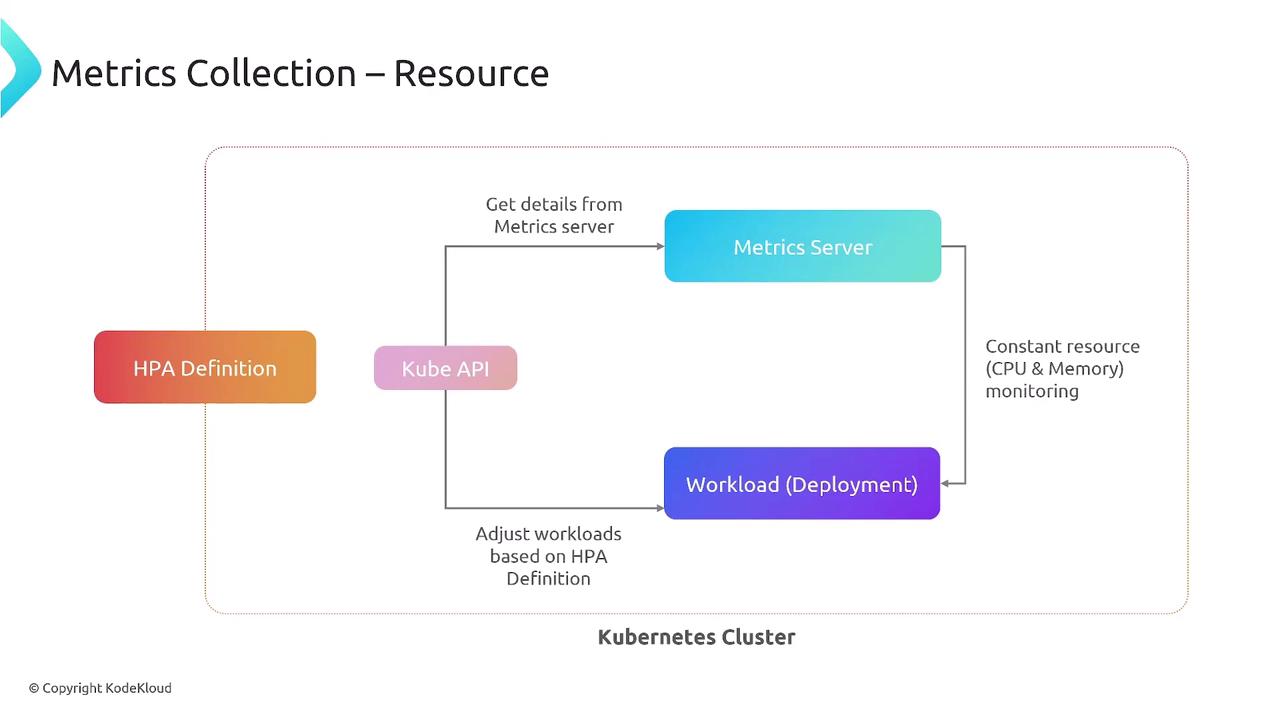
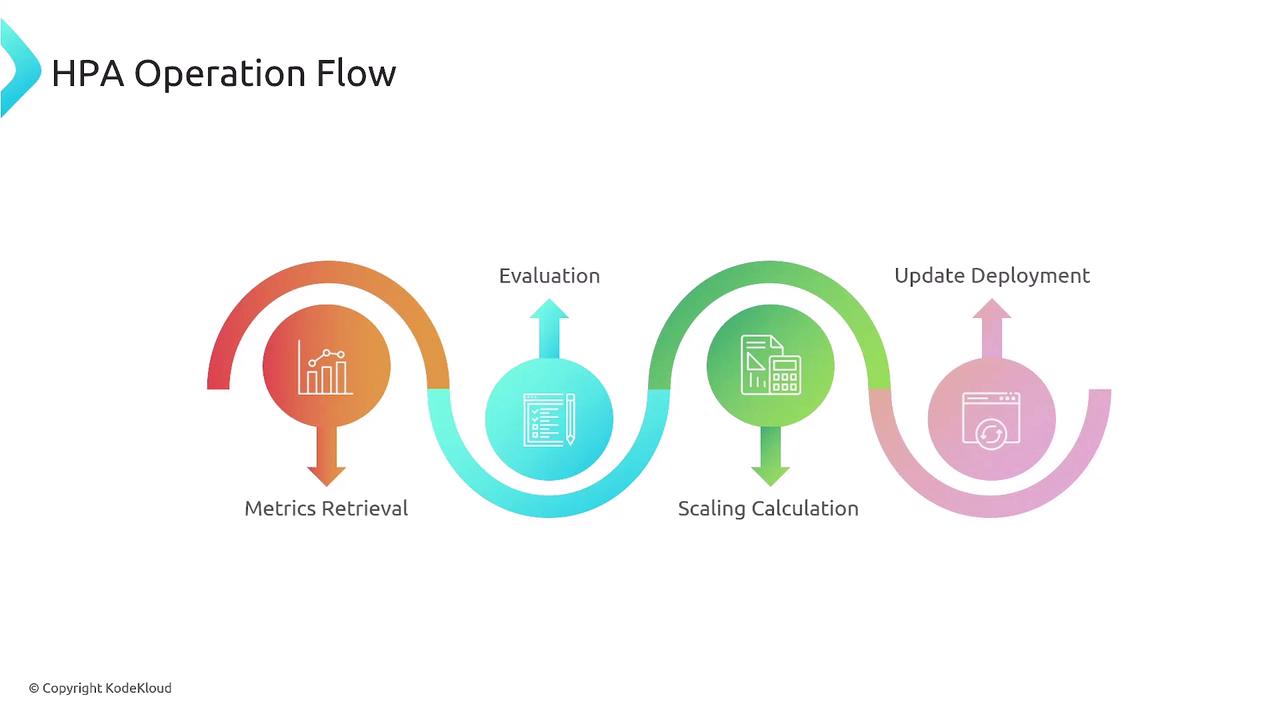
  1. Fetch metrics (CPU/memory) from Metrics Server
  2. Compare to target thresholds
  3. Compute desired replica count
  4. Patch the target workload

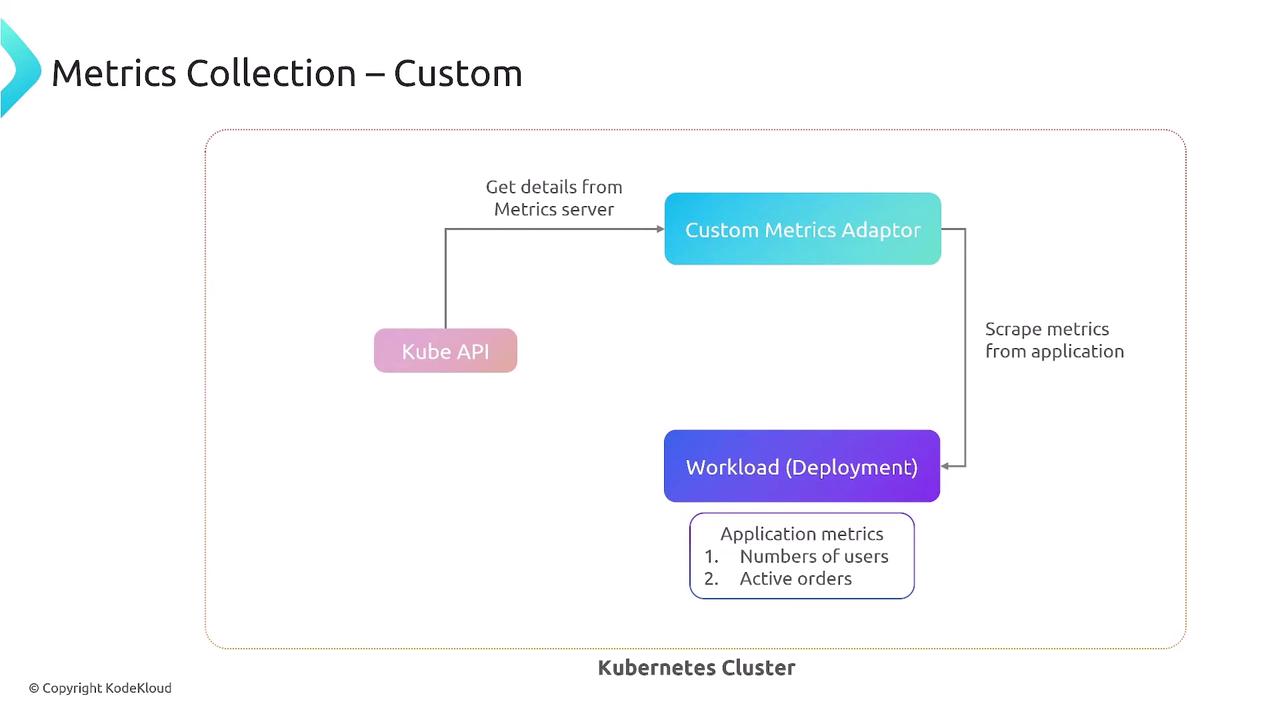
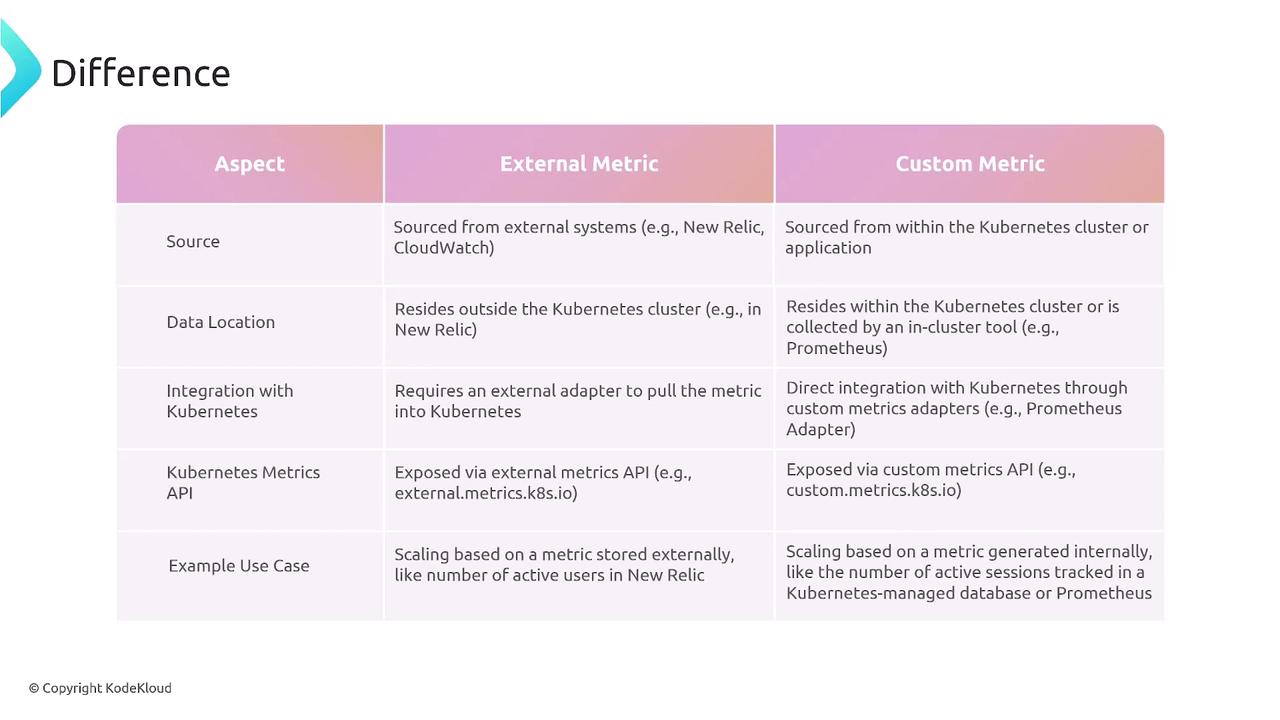
3. Custom Metrics (In-Cluster)

Use custom.metrics.k8s.io and an adapter (e.g., Prometheus Adapter) to scale on application-specific metrics.

The image is a flowchart illustrating custom metrics collection in a Kubernetes cluster, showing interactions between the Kube API, Custom Metrics Adaptor, and Workload (Deployment).

Example: scale a Deployment on HTTP requests per second.

apiVersion: autoscaling/v2
kind: HorizontalPodAutoscaler
metadata:
  name: my-app-hpa
  namespace: default
spec:
  scaleTargetRef:
    apiVersion: apps/v1
    kind: Deployment
    name: my-app
  minReplicas: 2
  maxReplicas: 10
  metrics:
    - type: Pods
      pods:
        metric:
          name: http_requests_per_second
        target:
          type: AverageValue
          averageValue: "100"

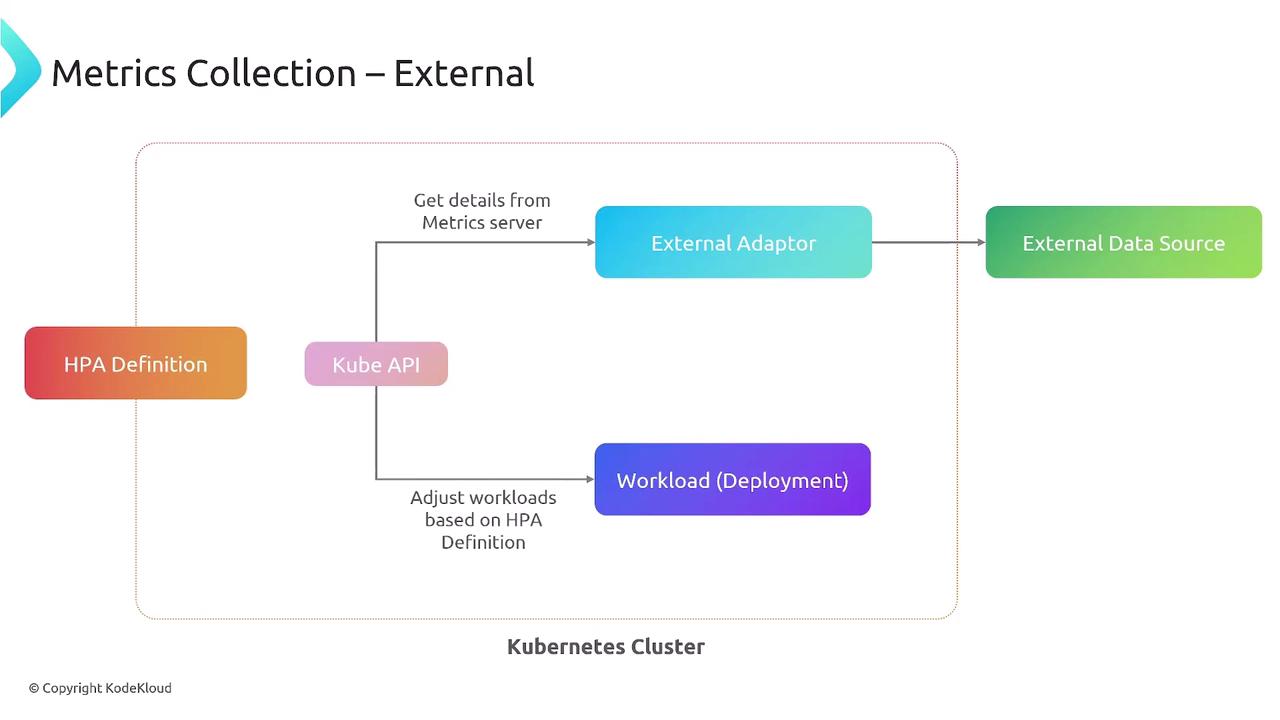
4. External Metrics (Outside Cluster)

Leverage metrics from external systems—cloud providers, SaaS tools—via external.metrics.k8s.io and a suitable adapter.

The image is a flowchart illustrating the process of external metrics collection in a Kubernetes cluster, showing interactions between HPA Definition, Kube API, External Adaptor, External Data Source, and Workload (Deployment).

Example using New Relic response time:

apiVersion: autoscaling/v2
kind: HorizontalPodAutoscaler
metadata:
  name: my-app-hpa
  namespace: default
spec:
  scaleTargetRef:
    apiVersion: apps/v1
    kind: Deployment
    name: my-app
  minReplicas: 2
  maxReplicas: 10
  metrics:
    - type: External
      external:
        metric:
          name: newrelic.app.response_time
        target:
          type: Value
          value: "500"

5. Metrics APIs and Adapters

Kubernetes exposes three metric APIs:

Metric TypeAPI EndpointAdapter Example
Resourcemetrics.k8s.ioMetrics Server
Customcustom.metrics.k8s.ioPrometheus Adapter
Externalexternal.metrics.k8s.ioNew Relic Adapter, AWS CloudWatch Adapter

The image is a comparison table detailing the differences between external and custom metrics in Kubernetes, covering aspects like source, data location, integration, API exposure, and use cases.

Note

Adapters translate between Kubernetes and metric providers, enabling HPA to consume non-native metrics.

6. HPA Control Loop and Operation Flow

The HPA controller continuously runs a loop to keep your pods scaled to demand.
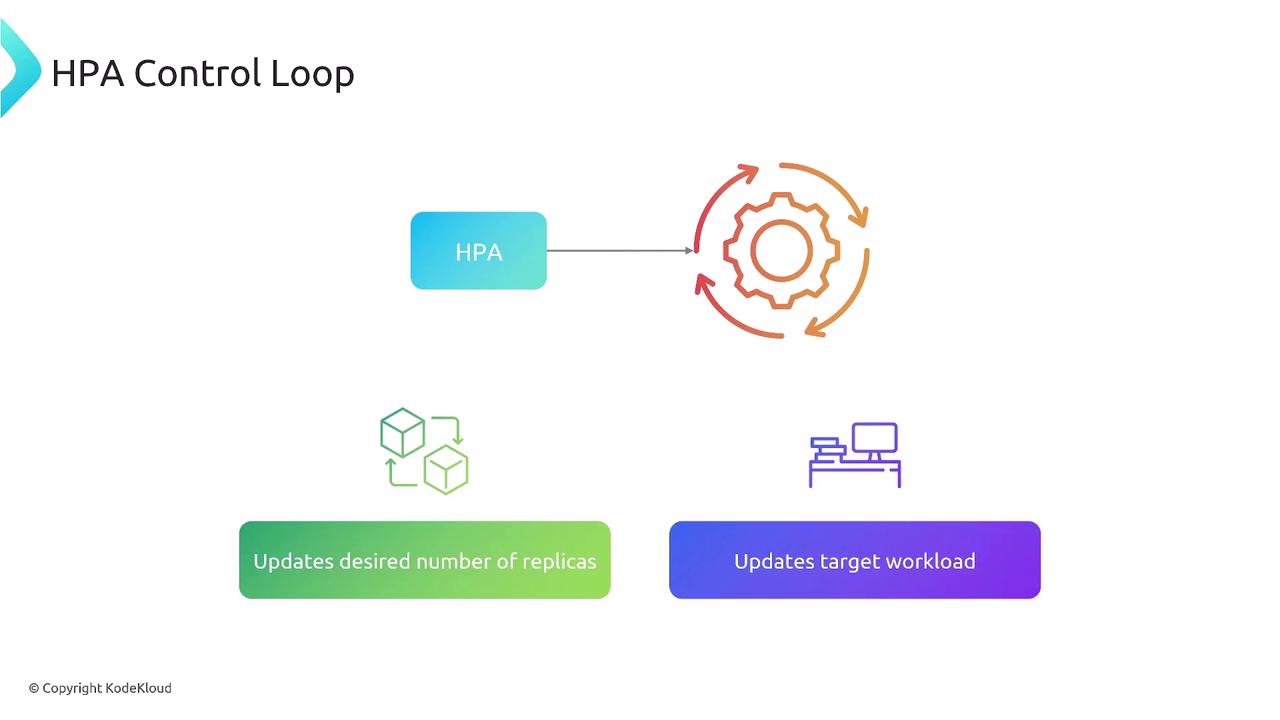
The image illustrates the HPA (Horizontal Pod Autoscaler) control loop, showing how it updates the desired number of replicas and the target workload.

The image illustrates the HPA (Horizontal Pod Autoscaler) operation flow, showing a process from metrics retrieval to evaluation, scaling calculation, and update deployment.

Key Considerations

  • Ensure the Metrics Server is installed for resource metrics.
  • Deploy custom/external adapters before referencing their APIs.
  • Configure scale-up/down policies and stabilization windows to avoid flapping.
  • Tune the control loop interval and thresholds based on workload patterns.

Warning

Incorrect thresholds or missing adapters can lead to no scaling or unexpected behavior. Always test HPA configurations in a staging environment.

Watch Video

Watch video content

Practice Lab

Practice lab

Previous
What Is HPA