Kubernetes Networking Deep Dive
Network Security
Demo Cilium Hubble
Prerequisites
- A running Kubernetes cluster with Cilium installed (v1.15.3 or later).
- Prometheus and Grafana deployed in the
cilium-monitoringnamespace.
Note
Hubble components (Relay, UI, metrics) are disabled by default. You must enable them via Helm to collect and visualize network flows.
1. Verify Cilium and Hubble Status
First, confirm Cilium is healthy and Hubble is not yet active:
root@controlplane ~ ➜ cilium status
Cilium:               OK
Operator:             OK
Envoy DaemonSet:      disabled (using embedded mode)
Hubble Relay:         disabled
ClusterMesh:          disabled

Deployment          cilium-operator     Desired: 1, Ready: 1/1, Available: 1/1
DaemonSet           cilium              Desired: 2, Ready: 2/2, Available: 2/2
Containers:         cilium              Running: 2
                    cilium-operator     Running: 1

Cluster Pods:  5/5 managed by Cilium
Helm chart version:        v1.15.3
Image versions
  cilium            quay.io/cilium/cilium:v1.15.3
  cilium-operator   quay.io/cilium/operator-generic:v1.15.3
Verify that Grafana and Prometheus are up but not receiving Hubble metrics:
root@controlplane ~ ➜ kubectl get all -n cilium-monitoring
NAME                           READY   STATUS    RESTARTS   AGE
pod/grafana-xxx                1/1     Running   0          10m
pod/prometheus-yyy             1/1     Running   0          10m

NAME                TYPE       CLUSTER-IP      PORT(S)
service/grafana     NodePort   10.98.81.88     3000:32000/TCP
service/prometheus  ClusterIP  10.99.242.121   9090/TCP
Check that the Cilium Helm repo is configured:
root@controlplane ~ ➜ helm repo list
NAME    URL
cilium  https://helm.cilium.io/
2. Enable Hubble Components
Upgrade your Cilium installation to enable Hubble Relay, UI, and Prometheus metrics:
root@controlplane ~ ➜ helm upgrade cilium cilium/cilium --version 1.15.4 \
  --namespace kube-system \
  --reuse-values \
  --set hubble.enabled=true \
  --set hubble.relay.enabled=true \
  --set hubble.ui.enabled=true \
  --set hubble.metrics.enableOpenMetrics=true \
  --set prometheus.enabled=true \
  --set operator.prometheus.enabled=true \
  --set hubble.metrics.enabled="{dns,drop,tcp,flow,port_distribution,icmp,httpV2:exemplars=true;labelsContext=source_ip,source_namespace,destination_ip,destination_namespace,destination_workload,traffic_direction}"
Hubble Metrics Table
| Metric Type | Description |
|---|---|
| dns | DNS query and response details |
| drop | Packets dropped by policy or misconfiguration |
| tcp, icmp | L4 protocol-specific flow statistics |
| port_distribution | Top ports by traffic volume |
| httpV2 | HTTP/2 requests and response summaries |
After a minute, confirm that Hubble Relay and UI are healthy:
root@controlplane ~ ➜ cilium status
...
Hubble Relay:    OK
Hubble UI:       OK
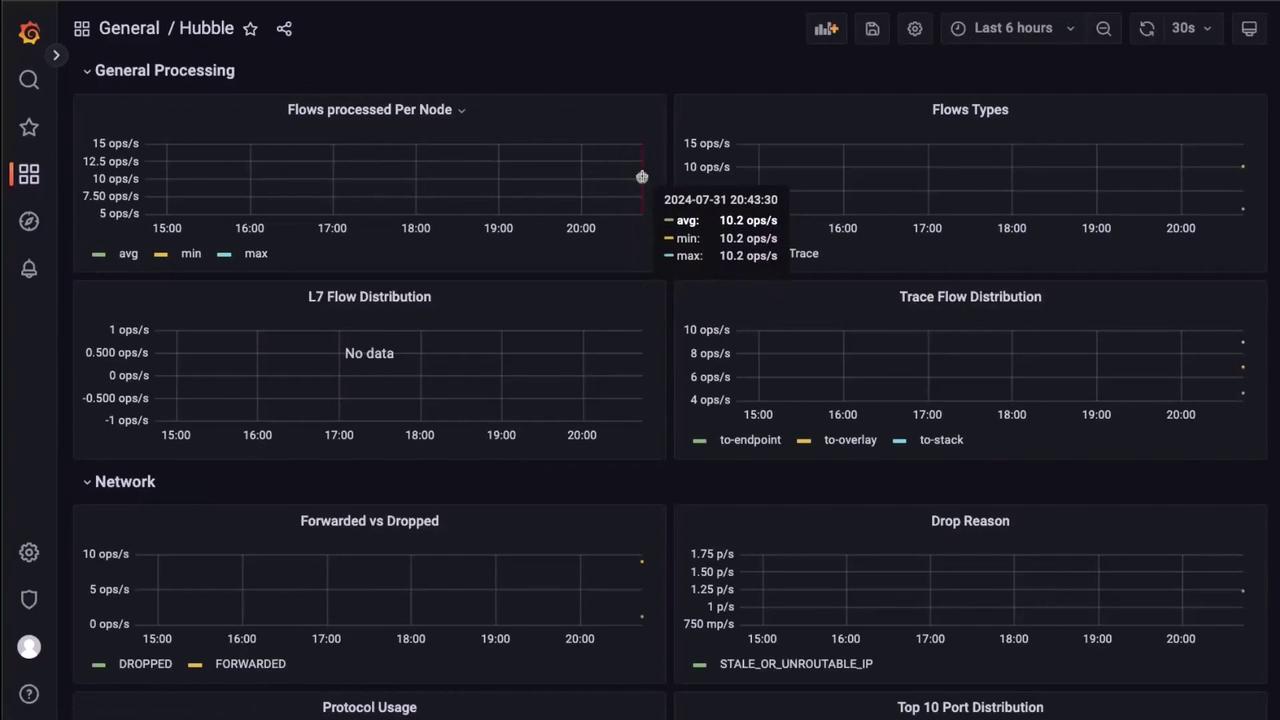
3. View Hubble Metrics in Grafana
Navigate to the Grafana dashboard in the cilium-monitoring namespace. You should see Hubble flow metrics such as flows per node, dropped vs forwarded traffic, and protocol distribution:
4. Expose the Hubble UI as NodePort
By default, the Hubble UI service is ClusterIP. Edit it to use a NodePort for external access:
root@controlplane ~ ➜ kubectl edit svc hubble-ui -n kube-system
Replace the spec with:
apiVersion: v1
kind: Service
metadata:
  name: hubble-ui
  namespace: kube-system
spec:
  type: NodePort
  ports:
    - name: http
      port: 80
      targetPort: 8081
      nodePort: 30000
  selector:
    k8s-app: hubble-ui
Warning
Exposing services via NodePort can open your cluster to external traffic. Ensure proper firewall rules or security groups are in place.
Now you can access the Hubble UI at <NodeIP>:30000.
5. Test Network Flows with curl
We have a demo application offering two endpoints:
/api– restricted to requests with headerX-API-KEY: abc123from pods labeledapp=admin./healthz– open to all traffic.
Create a CiliumNetworkPolicy to enforce this:
apiVersion: cilium.io/v2
kind: CiliumNetworkPolicy
metadata:
  name: demo-policy
  namespace: default
spec:
  endpointSelector:
    matchLabels:
      app: demo
  ingress:
  - fromEndpoints:
    - matchLabels: {app: admin}
    toPorts:
    - ports: [{port: "80", protocol: TCP}]
      rules:
        http:
        - method: GET
          path: /healthz
        - method: GET
          path: /api
          headers: {X-API-KEY: abc123}
Apply the policy and perform valid and invalid requests:
root@controlplane ~ ➜ kubectl run --rm -i --tty admin --labels=app=admin \
  --image=curlimages/curl --restart=Never -- \
  curl -H "X-API-KEY: abc123" http://app-svc-80/api
{"message":"Have a great day!","method":"GET","url":"/api"}
Invalid request (missing API key) will time out:
root@controlplane ~ ➜ kubectl run --rm -i --tty admin --image=curlimages/curl \
  --restart=Never -- curl http://app-svc-80/api --connect-timeout 2
curl: (28) Failed to connect to app-svc-80 port 80 after 2001 ms: Timeout was reached
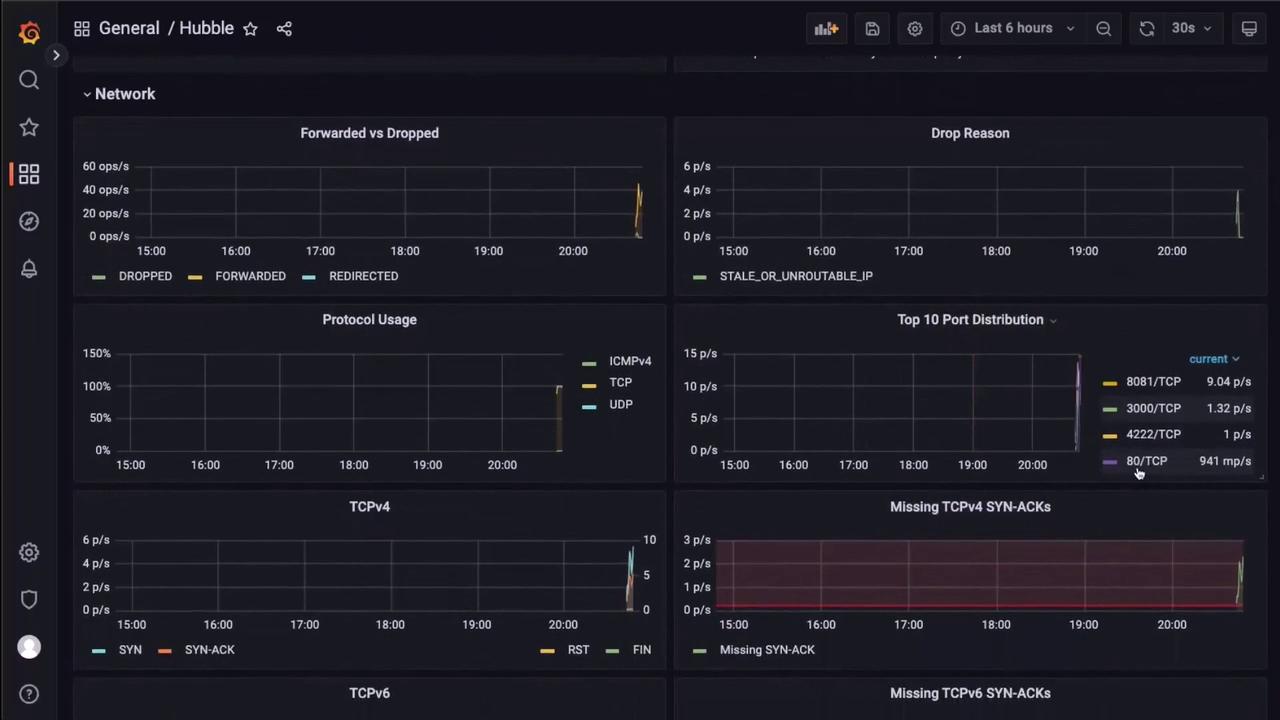
Observe Metrics for Forwarded vs Dropped Flows
Return to Grafana to see the changes in the “Forwarded vs Dropped” panel and other flow statistics:
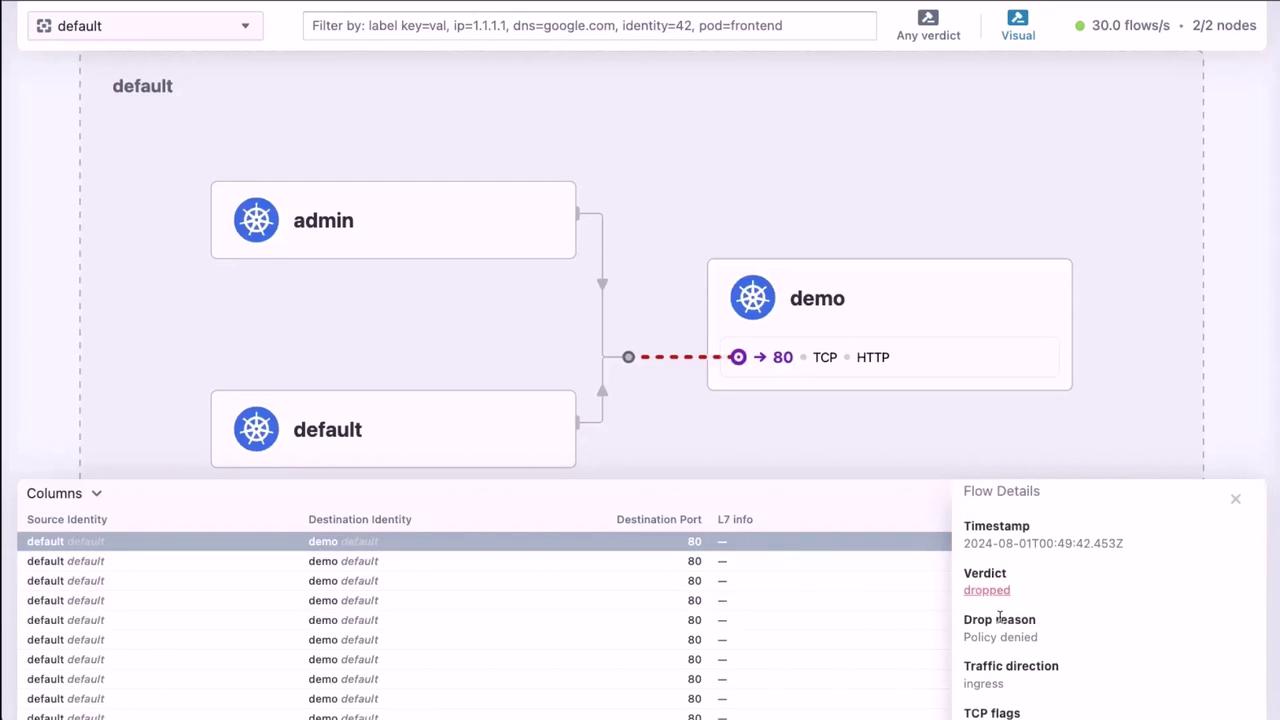
6. Visualize Live Flows in Hubble UI
Open the Hubble UI at <NodeIP>:30000 to explore live network flows. Click on any flow to see detailed metadata and policy verdicts:
7. Using the Hubble CLI
You can also use the Hubble CLI for real-time troubleshooting. Exec into a Cilium agent pod:
root@controlplane ~ ➜ kubectl exec -it -n kube-system cilium-xxxx -c cilium-agent -- /bin/bash
root@cilium:/home/cilium# hubble version
hubble 0.13.2 compiled with go1.21.8 on linux/amd64

root@cilium:/home/cilium# hubble status
Healthcheck (unix:///var/run/cilium/hubble.sock): Ok
Current/Max Flows: 4095/4095 (100.00%)
Flows/s: 4.77
Stream live flow logs:
root@cilium:/home/cilium# hubble observe
Aug  1 00:52:09.273: 10.0.1.84:54976 <> kube-system/hubble-ui:8081 to-overlay FORWARDED (TCP SYN)
Aug  1 00:52:09.276: kube-system/hubble-ui:57128 -> kube-system/hubble-relay:4245 FORWARDED (TCP ACK, PSH)
Filter flows by namespace, pod, time range, or format:
# Only default namespace
root@cilium# hubble observe --namespace default

# From the admin pod
root@cilium# hubble observe --namespace default --from-pod admin

# Last 30 minutes
root@cilium# hubble observe --since 30m

# Follow live updates
root@cilium# hubble observe --follow

# JSON output
root@cilium# hubble observe -o json | jq .
[
  {
    "time": "2024-08-01T00:49:41.474560859Z",
    "source": {
      "pod": "admin",
      "namespace": "default"
    },
    "destination": {
      "pod": "demo-deployment-7ccd685fcc-6grkd",
      "namespace": "default",
      "port": 80
    },
    "Type": "L3_L4",
    "Summary": "TCP SYN"
  }
]
Conclusion
Cilium Hubble delivers powerful network observability through both a rich UI and command-line interface. Integrate Hubble with Prometheus and Grafana for long-term monitoring or use the hubble CLI for on-the-fly troubleshooting.
Links and References
Watch Video
Watch video content