Core Components of the Prometheus Server
Data Retrieval Worker
The data retrieval worker is responsible for gathering metrics from your targets. It does this by sending HTTP requests—typically to the/metrics endpoint—of your applications or systems. Once collected, these metrics are stored in the time series database, ready for analysis.
Time Series Database
The time series database serves as a dedicated repository for the collected metrics. Optimized specifically for time series data, it enables efficient recording and rapid retrieval of metric information.HTTP Server
The HTTP server provides a query interface that allows users to access, visualize, and analyze stored metrics. By leveraging PromQL—Prometheus’s built-in query language—users can interact with the data via either the Prometheus web UI or third-party visualization tools such as Grafana.Additional components such as exporters, service discovery, and Alertmanager extend Prometheus’s functionality in dynamic environments.
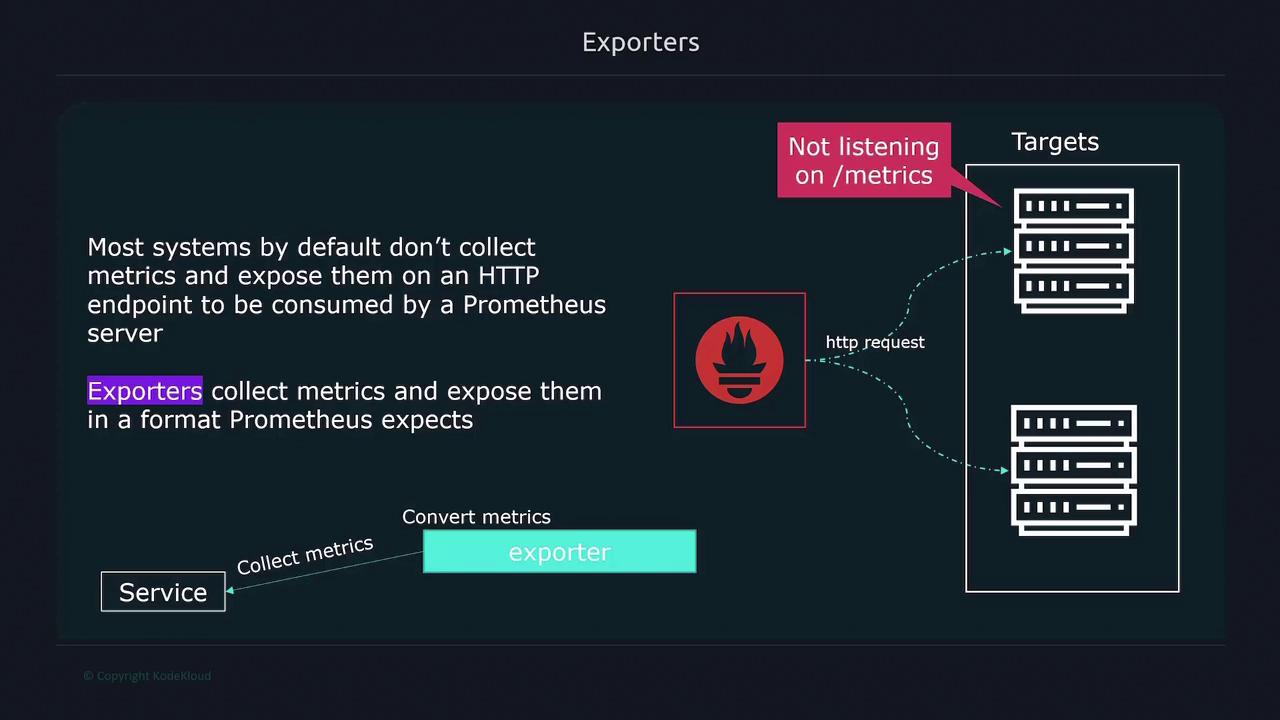
Exporters and Data Collection
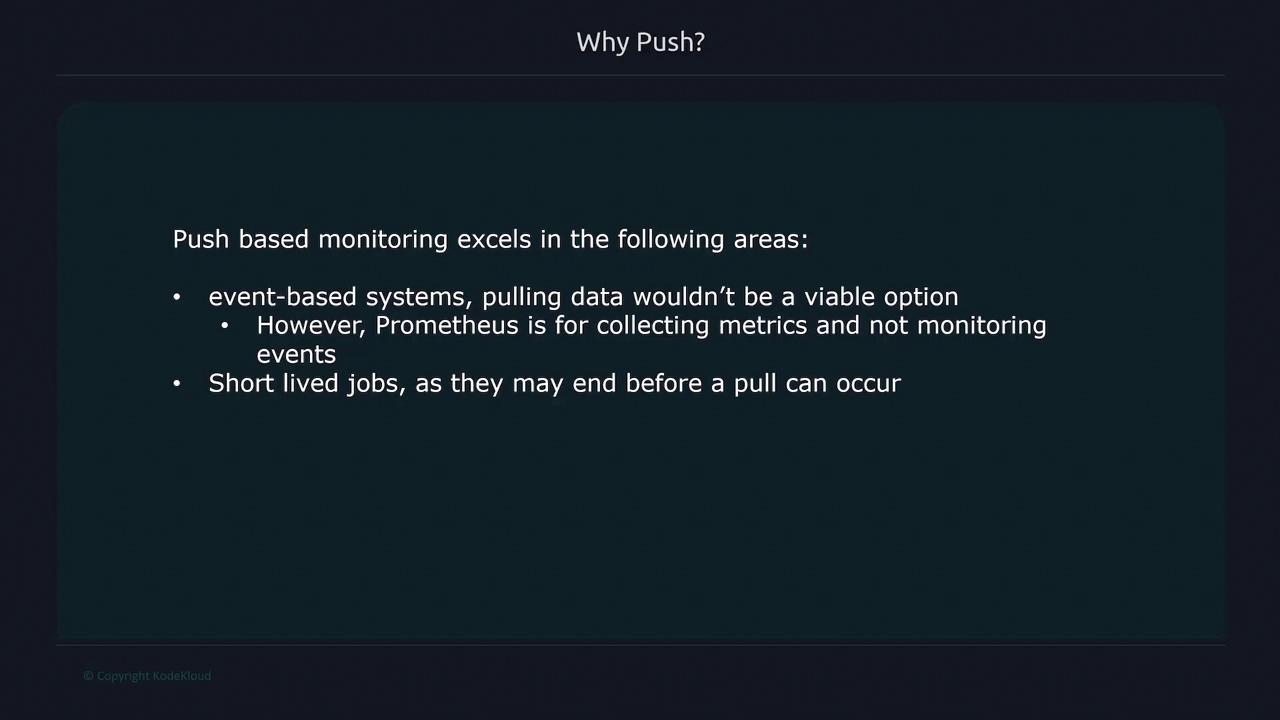
To scrape metrics effectively, Prometheus utilizes exporters. Exporters are lightweight processes running on your targets that expose metrics in a Prometheus-compatible format. Since many systems do not natively present metrics as expected by Prometheus, exporters are essential for converting internal data into a standardized format. Prometheus employs a pull-based model, meaning it actively queries targets. However, for short-lived jobs that might not exist long enough to be scraped, the Pushgateway is used. This component temporarily stores metrics pushed by these jobs until Prometheus can scrape them. Targets to scrape are usually specified in a static configuration file. In dynamic environments, such as Kubernetes or cloud infrastructures, service discovery mechanisms automatically update the target list.Alerting
Prometheus supports alerting by evaluating collected metrics against defined thresholds. While it does not send notifications directly, it forwards alerts to Alertmanager. Alertmanager then manages and dispatches notifications through various channels like email, SMS, or Slack. The overall interaction among these components is illustrated below: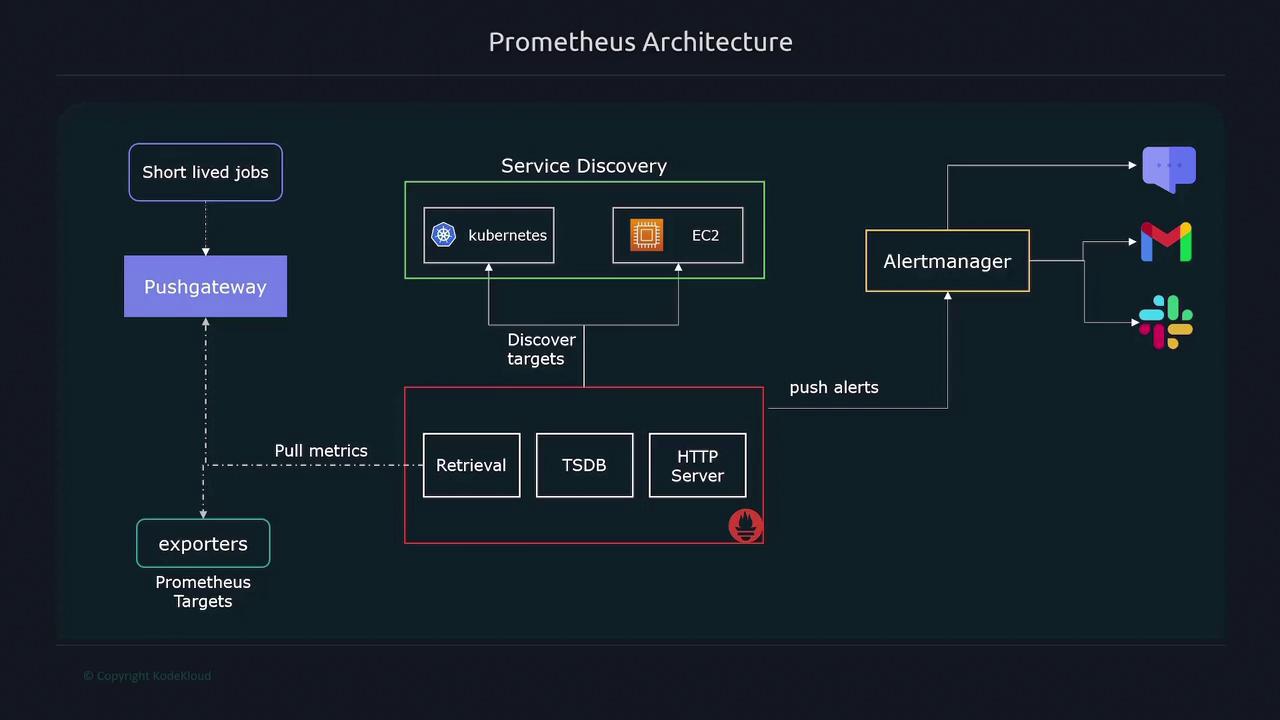
Querying Metrics with PromQL
Prometheus enables users to query and visualize metrics using PromQL, its powerful query language. Whether via the Prometheus web UI or third-party tools like Grafana, PromQL provides flexibility for retrieving and analyzing data. By default, Prometheus scrapes metrics from the/metrics endpoint of each target, though this endpoint can be customized in the configuration if needed.
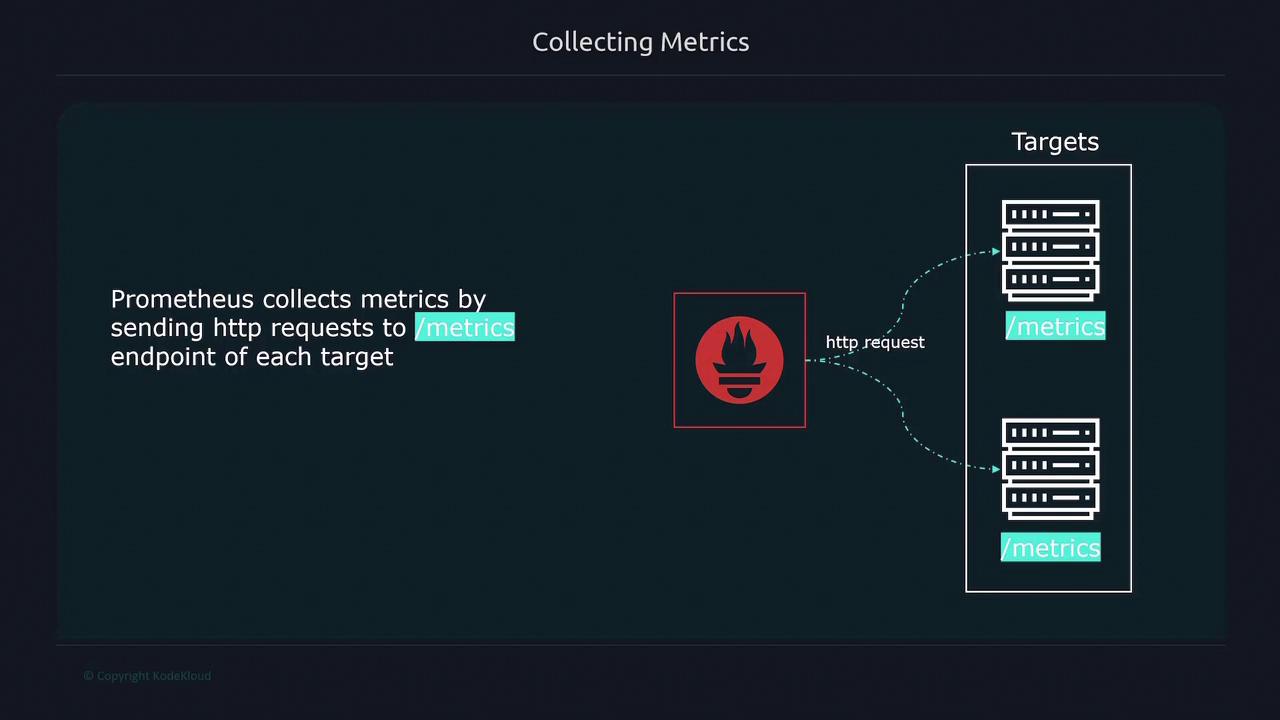
/metrics endpoint for Prometheus to scrape.
Custom Metrics Collection
For applications that require monitoring of custom metrics—such as tracking errors, latency, or execution time—Prometheus provides client libraries in multiple programming languages, including Go, Java, Python, Ruby, and Rust. These libraries enable you to expose application-specific metrics tailored to your needs.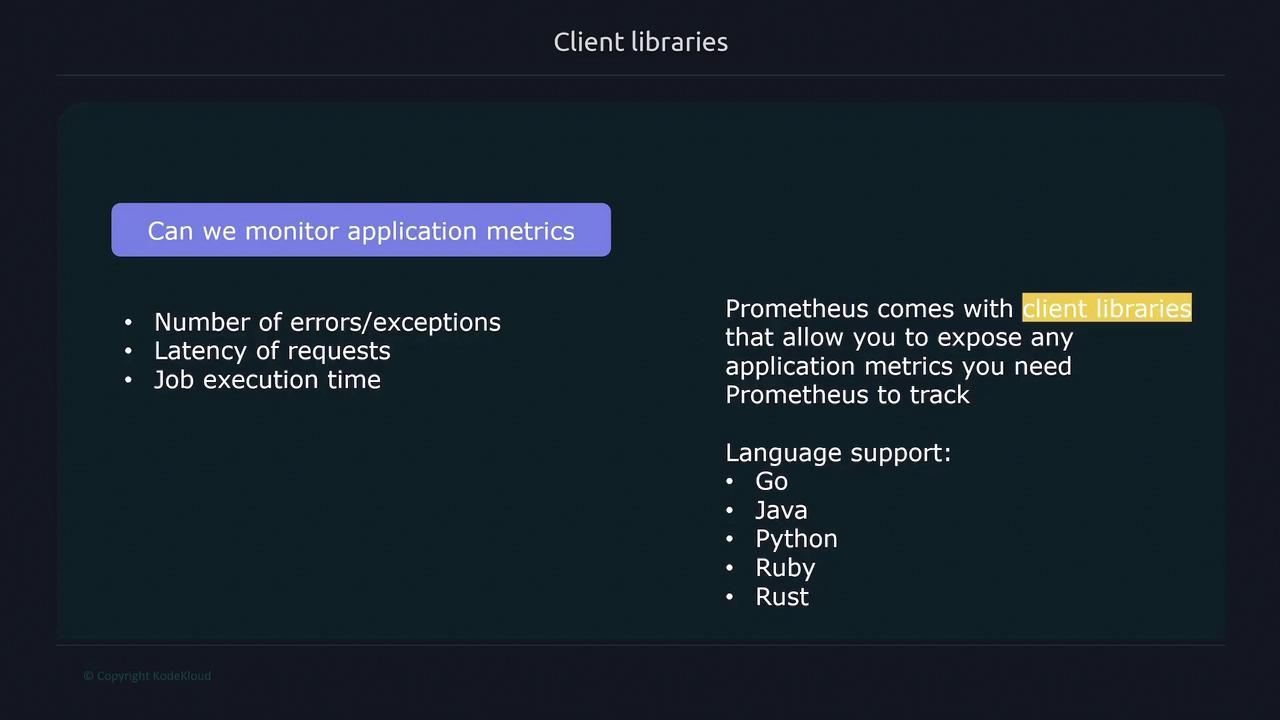
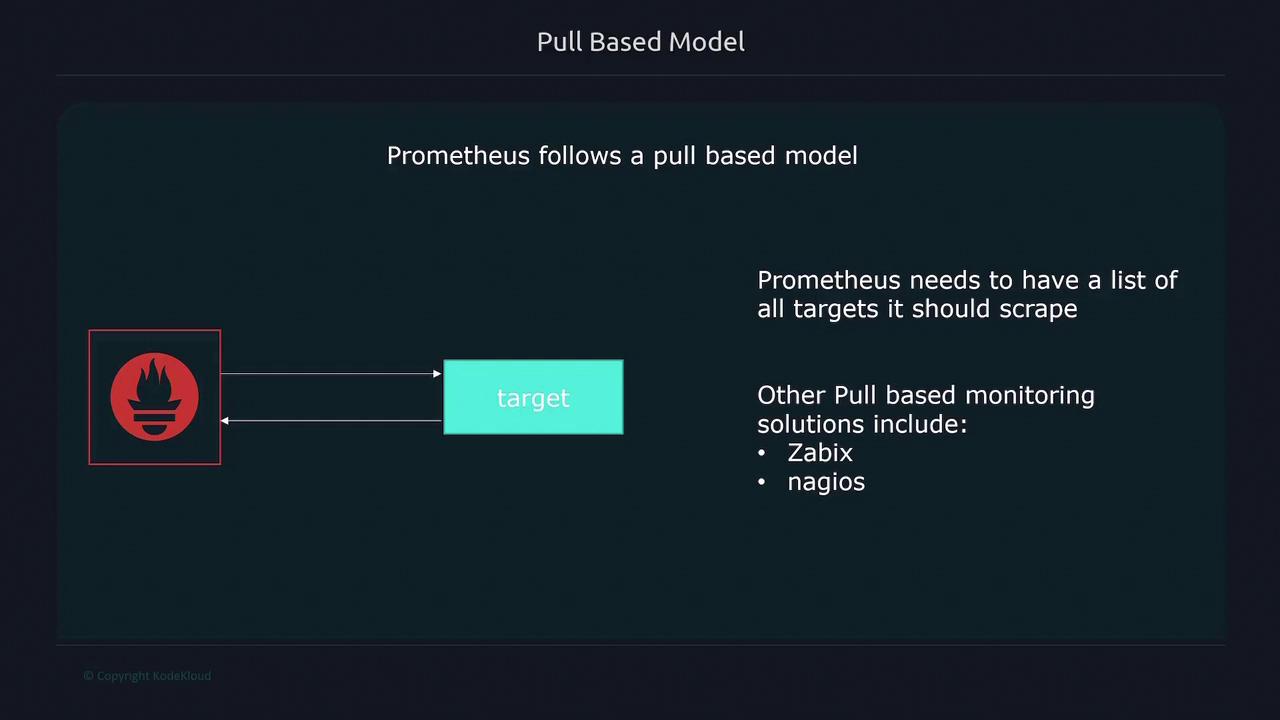
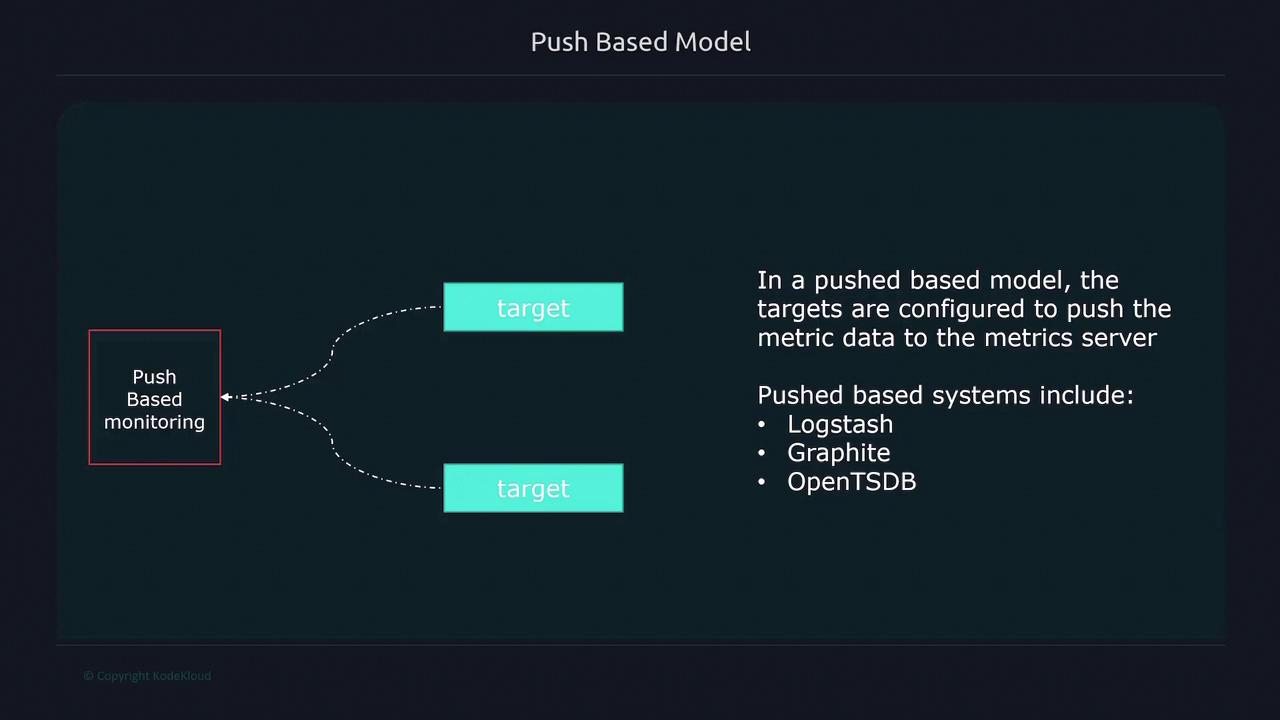
Pull-Based vs. Push-Based Collection Models
Prometheus is primarily built around a pull-based model, meaning it scrapes metrics from known targets. This model offers several advantages:- Easier detection of targets that are down.
- Control over server load, as metrics are collected at scheduled intervals.
- Maintenance of an up-to-date list of targets, ensuring a reliable source of truth.
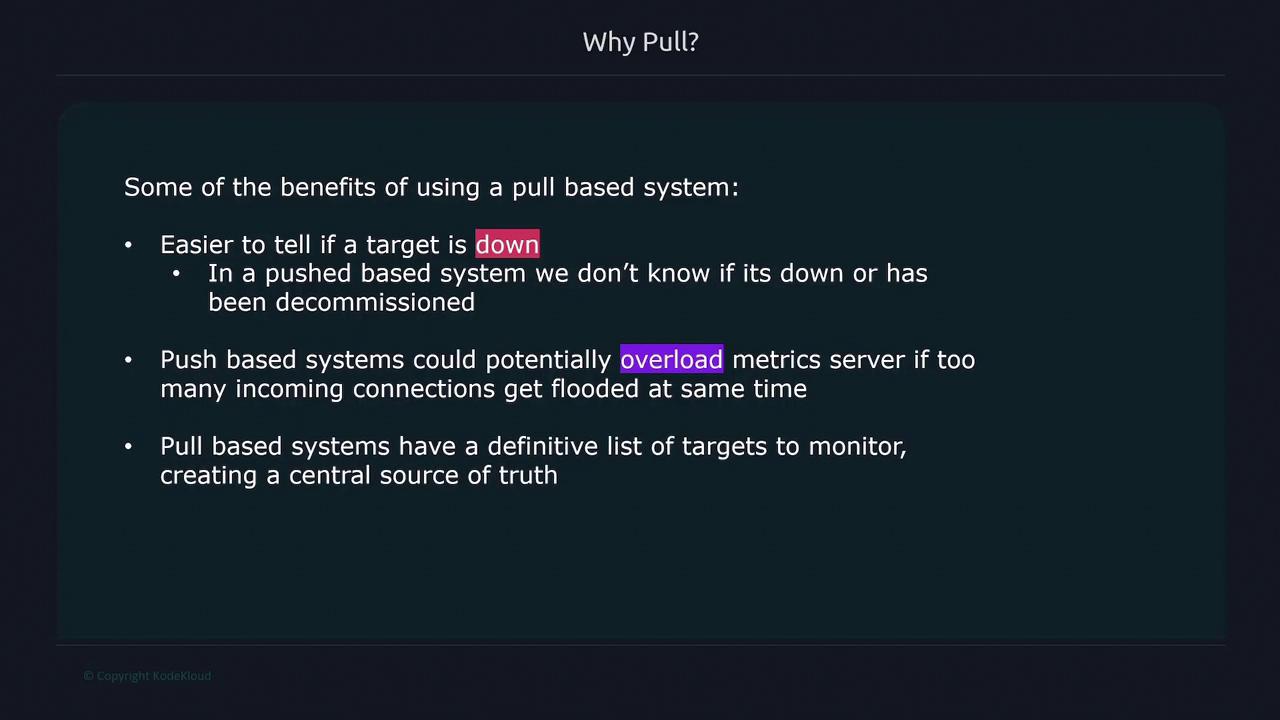
Advantages of the Pull-Based Model
The benefits of using a pull-based model include:- Improved detection of target availability.
- Reduced risk of server overload by controlling the rate of metric collection.
- Maintaining a centralized registry of monitored targets.
Conclusion
Prometheus is engineered for the efficient collection, storage, and querying of time series metrics. Its modular architecture—including key components like exporters, service discovery, and Alertmanager—ensures it can meet the monitoring requirements of both static and dynamic environments. By leveraging a pull-based model and providing push-based alternatives via Pushgateway, Prometheus offers a comprehensive monitoring solution for a wide variety of use cases. For more detailed information, consult the Prometheus Documentation.Learn about setting up exporters and configuring service discovery to streamline your monitoring setup.